| Param | Original file | Final file |
|---|---|---|
| Filename | modeM0/AS1A14_103T01_9000006524_54794cztM0_level2.fits | modeM0/AS1A14_103T01_9000006524_54794cztM0_level2_quad_clean.evt |
| Size (bytes) | 464,310,720 | 93,810,240 |
| Size | 442.8 MB | 89.5 MB |
| Events in quadrant A | 2,835,571 | 618,205 |
| Events in quadrant B | 3,761,160 | 660,219 |
| Events in quadrant C | 5,895,132 | 554,521 |
| Events in quadrant D | 4,180,900 | 545,981 |
| Mode SS | |||
|---|---|---|---|
| Quadrant | BADHDUFLAG | Total packets | Discarded packets |
| A | 0 | 134 | 0 |
| B | 0 | 134 | 0 |
| C | 0 | 134 | 0 |
| D | 0 | 134 | 0 |
| Mode M0 | |||
|---|---|---|---|
| Quadrant | BADHDUFLAG | Total packets | Discarded packets |
| A | 0 | 13736 | 3 |
| B | 0 | 16098 | 2 |
| C | 0 | 22153 | 2 |
| D | 0 | 17283 | 2 |
| Mode M9 | |||
|---|---|---|---|
| Quadrant | BADHDUFLAG | Total packets | Discarded packets |
| A | 0 | 11 | 0 |
| B | 0 | 12 | 0 |
| C | 0 | 12 | 0 |
| D | 0 | 12 | 0 |
| Quadrant | Total seconds | Saturated seconds | Saturation percentage |
|---|---|---|---|
| A | 6622 | 83 | 1.253398% |
| B | 6623 | 187 | 2.823494% |
| C | 6623 | 571 | 8.621471% |
| D | 6623 | 296 | 4.469274% |
Noise dominated data is calculated using 1-second bins in cleaned event files. If a bin has >2000 counts, and if more than 50% of those come from <1% of pixels, then it is considered to be noise-dominated and hence unusable.
| Quadrant | # 1 sec bins | Bins with >0 counts | Bins with >2000 counts | High rate bins dominated by noise | Noise dominated (total time) | Noise dominated (detector-on time) | Marked lightcurve |
|---|---|---|---|---|---|---|---|
| A | 7613 | 6624 | 5 | 5 | 0.07% | 0.08% | 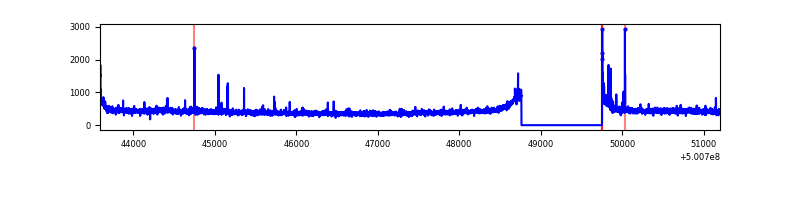 |
| B | 7613 | 6623 | 78 | 78 | 1.02% | 1.18% | 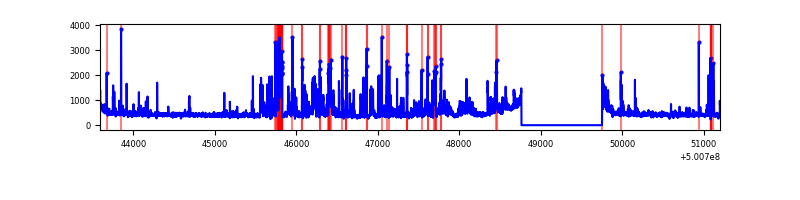 |
| C | 7613 | 6624 | 498 | 498 | 6.54% | 7.52% | 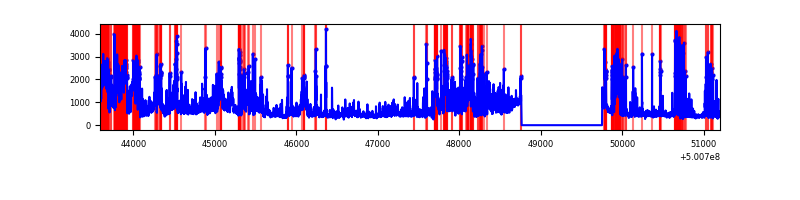 |
| D | 7613 | 6624 | 242 | 242 | 3.18% | 3.65% | 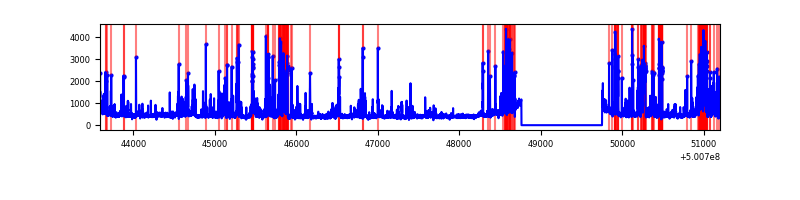 |
Top three noisy pixels from each quadrant. If the there are fewer than three noisy pixels in the level2.evt file, extra rows are filled as -1
| Pixel properties | Quadrant properties | ||||||
|---|---|---|---|---|---|---|---|
| Quadrant | DetID | PixID | Counts | Sigma | Mean | Median | Sigma |
| A | 3 | 14 | 52500 | 299.68 | 697 | 677 | 172.9 |
| A | 11 | 3 | 19342 | 107.93 | 697 | 677 | 172.9 |
| A | 13 | 254 | 17493 | 97.24 | 697 | 677 | 172.9 |
| B | 2 | 249 | 843723 | 5707.61 | 685 | 660 | 147.7 |
| B | 6 | 255 | 89725 | 602.98 | 685 | 660 | 147.7 |
| B | 5 | 185 | 49151 | 328.29 | 685 | 660 | 147.7 |
| C | 9 | 38 | 2410664 | 13256.51 | 658 | 652 | 181.8 |
| C | 13 | 3 | 396356 | 2176.61 | 658 | 652 | 181.8 |
| C | 6 | 223 | 201093 | 1102.55 | 658 | 652 | 181.8 |
| D | 3 | 12 | 477819 | 2525.61 | 664 | 634 | 188.9 |
| D | 15 | 94 | 461836 | 2441.01 | 664 | 634 | 188.9 |
| D | 14 | 52 | 157239 | 828.87 | 664 | 634 | 188.9 |
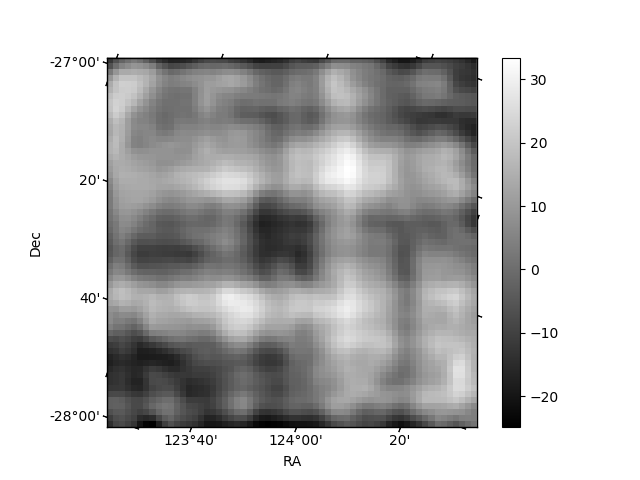
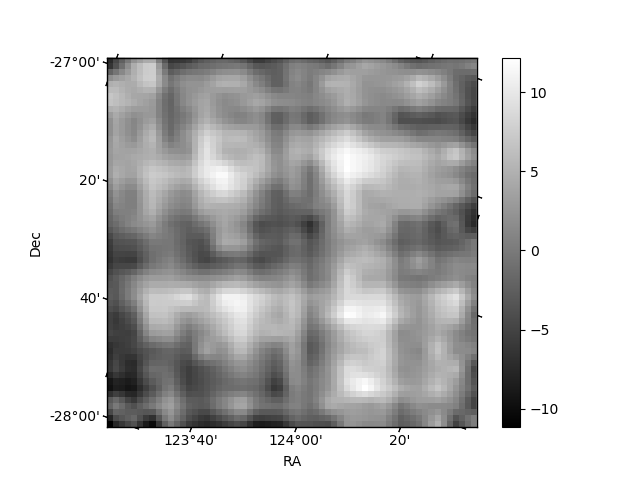
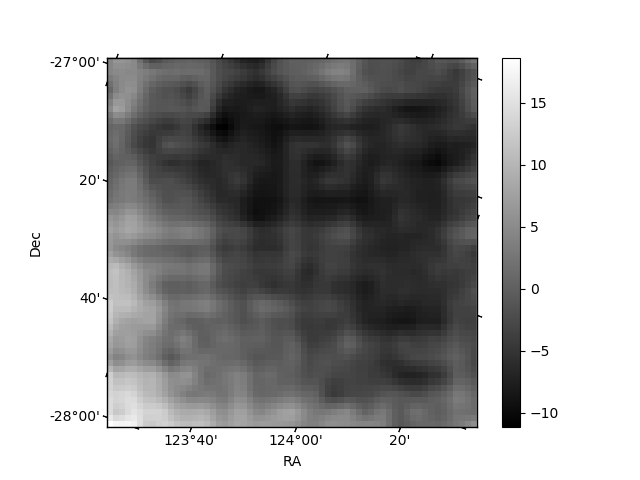
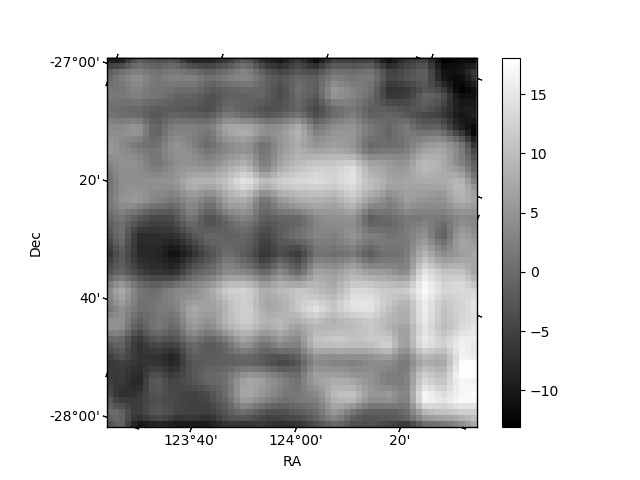
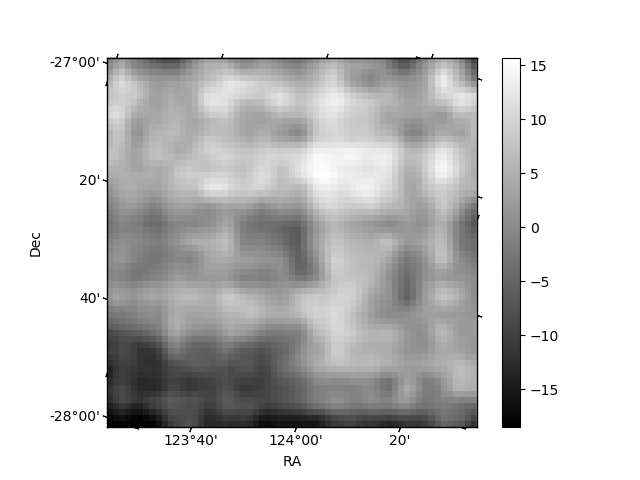
Histogram calculated using DETX and DETY for each event in the final _common_clean file
| Quadrant A | 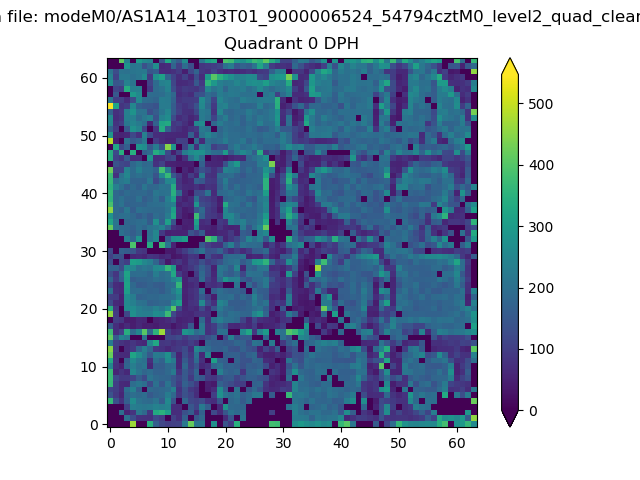 |
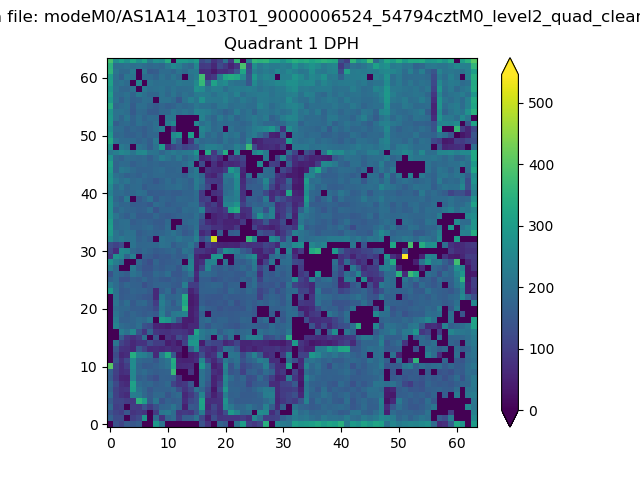 |
Quadrant B |
|---|---|---|---|
| Quadrant D | 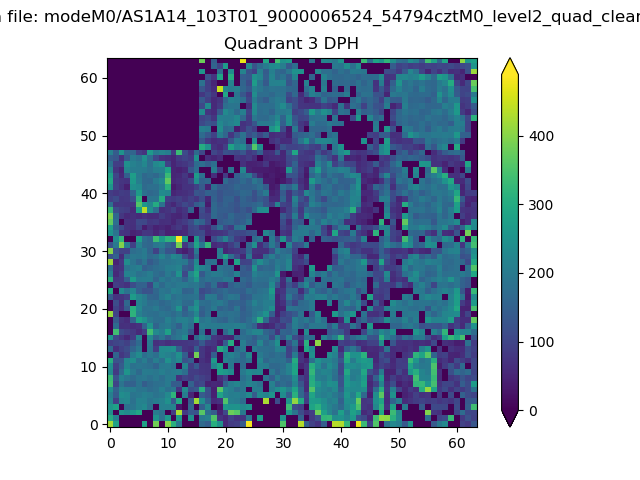 |
 |
Quadrant C |
| Plot type | Count rate plots | Images |
|---|---|---|
| Comparison with Poisson distribution Blue bars denote a histogram of data divided into 1 sec bins. Red curve is a Poisson curve with rate = median count rate of data. |
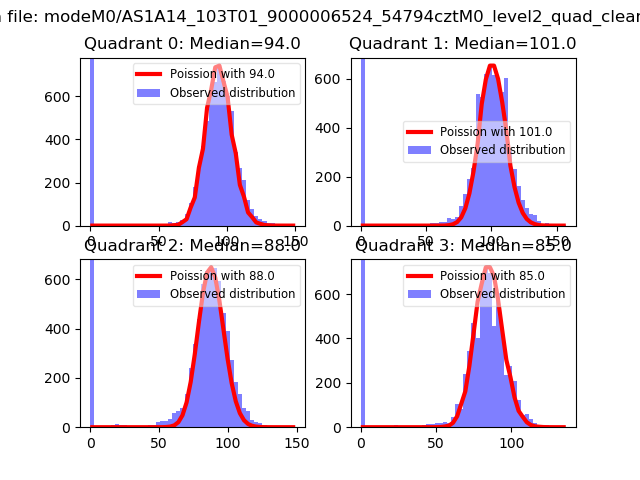 |
 |
| Quadrant-wise count rates Data is divided into 100 sec bins |
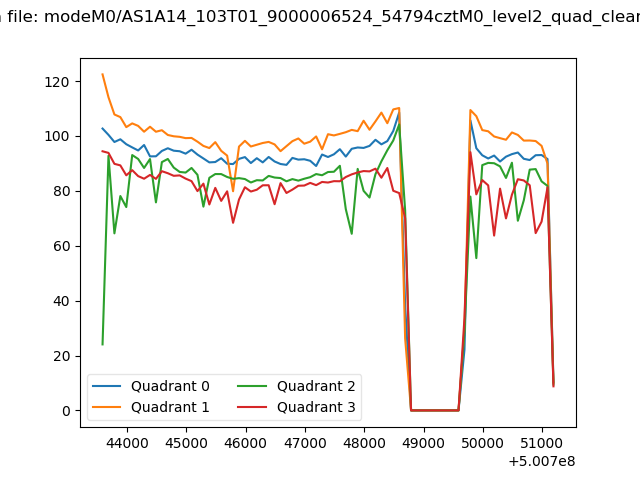 |
|
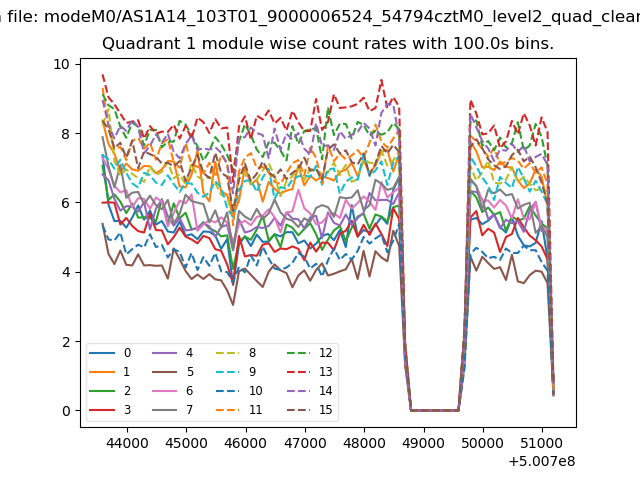
| Module-wise count rates for Quadrant A Data is divided into 100 sec bins |
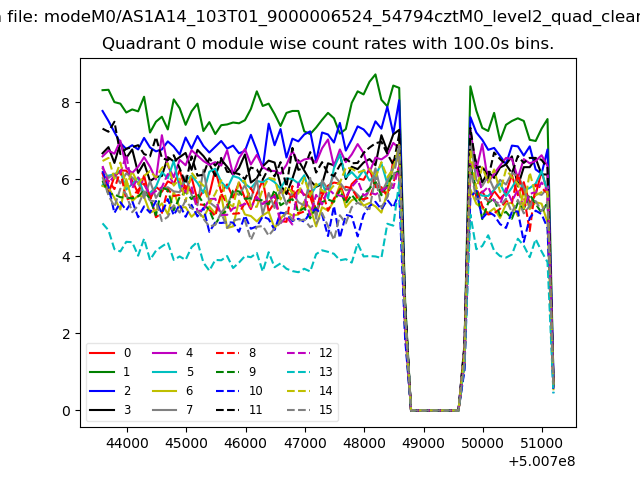 |
 |
| Module-wise count rates for Quadrant B Data is divided into 100 sec bins |
 |
 |
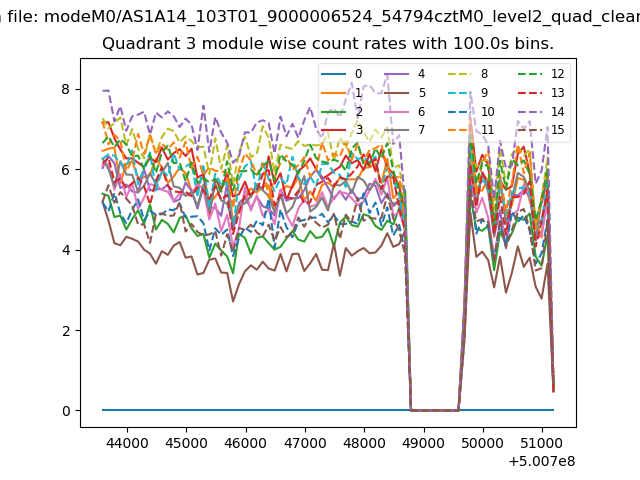
| Module-wise count rates for Quadrant C Data is divided into 100 sec bins |
 |
 |
| Module-wise count rates for Quadrant D Data is divided into 100 sec bins |
 |
 |
| Parameter | Plot |
|---|---|
| CZT HV Monitor | 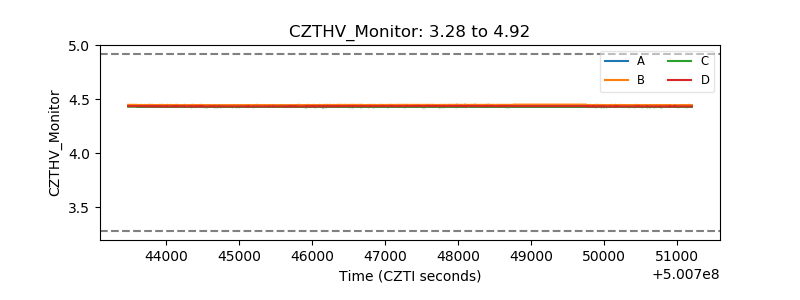 |
| D_VDD | 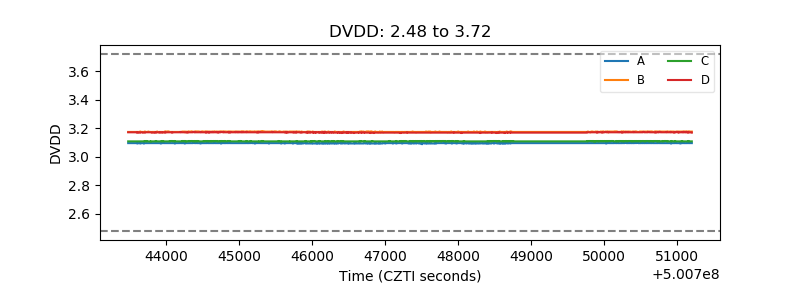 |
| Temperature 1 | 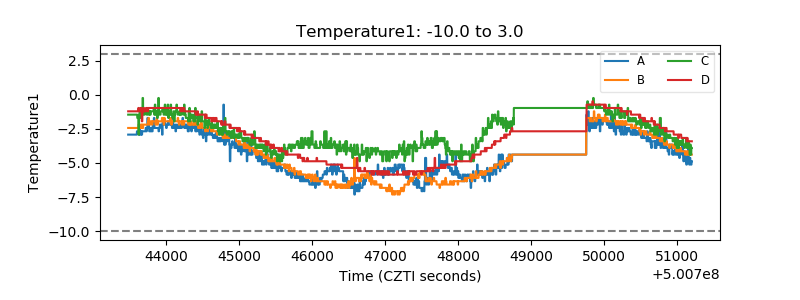 |
| Veto HV Monitor |  |
| Veto LLD | 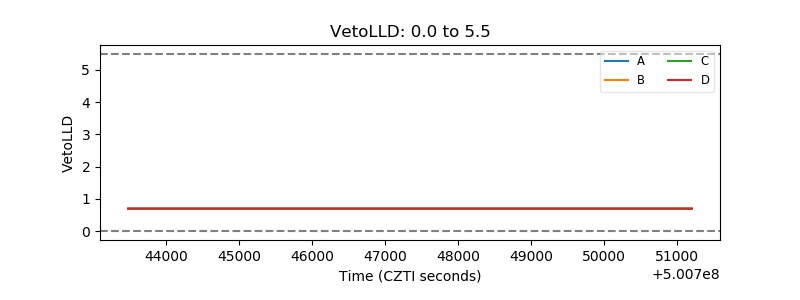 |
| Alpha Counter | 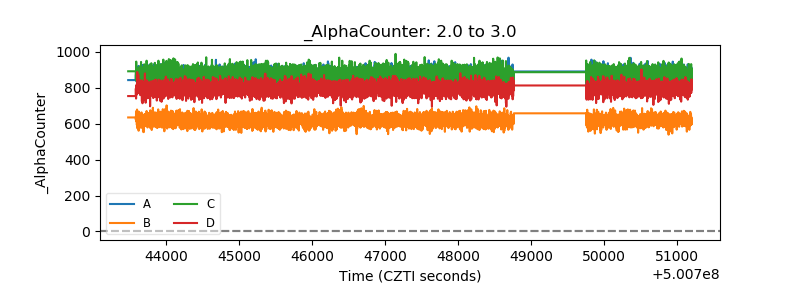 |
| _CPM_Rate | 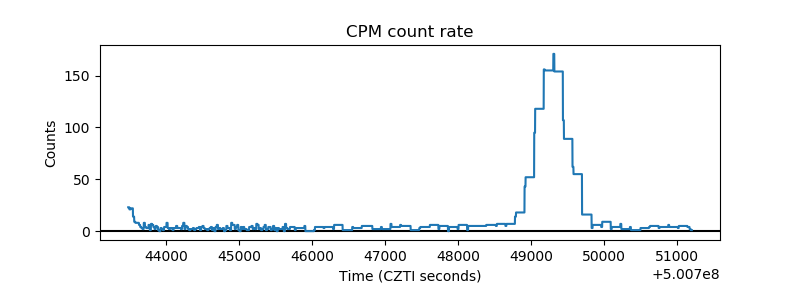 |
| CZT Counter | 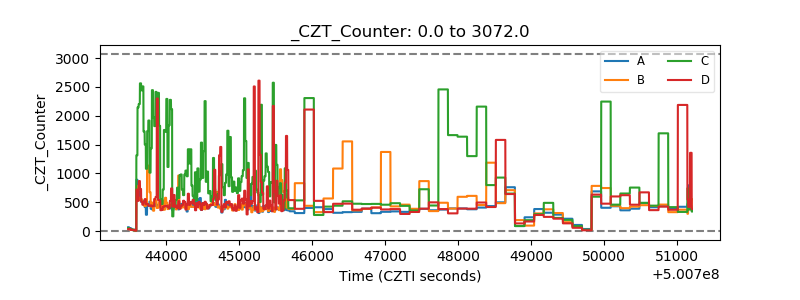 |
| +2.5 Volts monitor |  |
| +5 Volts monitor |  |
| _ROLL_ROT | 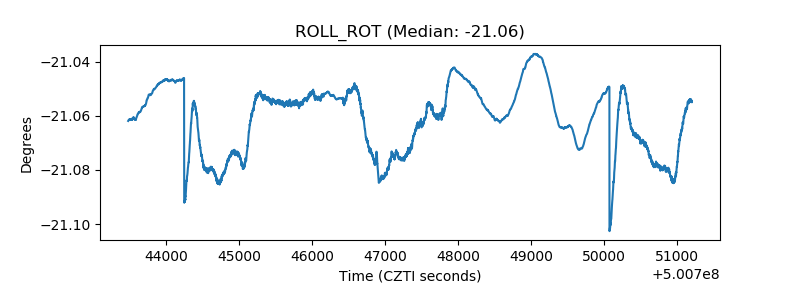 |
| _Roll_DEC | 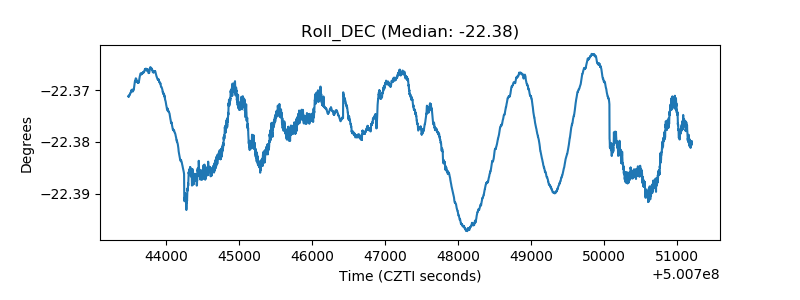 |
| _Roll_RA | 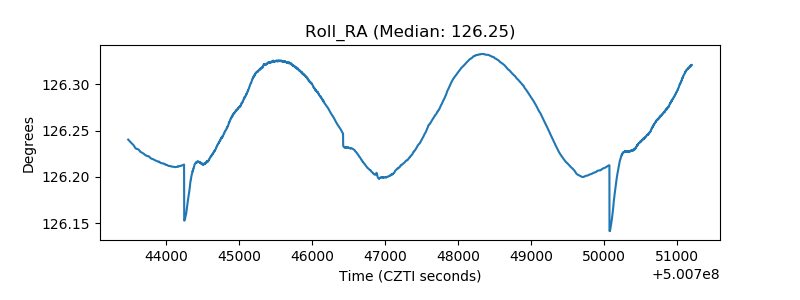 |
| Veto Counter | 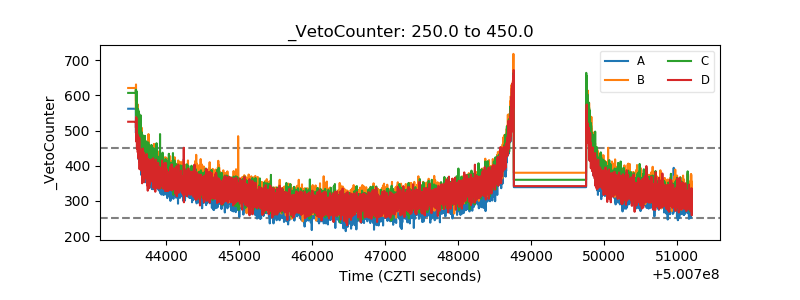 |