| Param | Original file | Final file |
|---|---|---|
| Filename | modeM0/AS1A14_103T01_9000006524_54796cztM0_level2.fits | modeM0/AS1A14_103T01_9000006524_54796cztM0_level2_quad_clean.evt |
| Size (bytes) | 532,442,880 | 114,310,080 |
| Size | 507.8 MB | 109.0 MB |
| Events in quadrant A | 3,495,847 | 752,749 |
| Events in quadrant B | 3,984,882 | 796,006 |
| Events in quadrant C | 6,662,096 | 695,393 |
| Events in quadrant D | 4,957,957 | 672,749 |
| Mode SS | |||
|---|---|---|---|
| Quadrant | BADHDUFLAG | Total packets | Discarded packets |
| A | 0 | 156 | 0 |
| B | 0 | 156 | 0 |
| C | 0 | 156 | 0 |
| D | 0 | 156 | 0 |
| Mode M0 | |||
|---|---|---|---|
| Quadrant | BADHDUFLAG | Total packets | Discarded packets |
| A | 0 | 16881 | 7 |
| B | 0 | 17769 | 10 |
| C | 0 | 25449 | 7 |
| D | 0 | 20649 | 4 |
| Mode M9 | |||
|---|---|---|---|
| Quadrant | BADHDUFLAG | Total packets | Discarded packets |
| A | 0 | 7 | 0 |
| B | 0 | 7 | 0 |
| C | 0 | 7 | 0 |
| D | 0 | 7 | 0 |
| Quadrant | Total seconds | Saturated seconds | Saturation percentage |
|---|---|---|---|
| A | 7838 | 139 | 1.773412% |
| B | 7835 | 231 | 2.948309% |
| C | 7838 | 459 | 5.856086% |
| D | 7840 | 280 | 3.571429% |
Noise dominated data is calculated using 1-second bins in cleaned event files. If a bin has >2000 counts, and if more than 50% of those come from <1% of pixels, then it is considered to be noise-dominated and hence unusable.
| Quadrant | # 1 sec bins | Bins with >0 counts | Bins with >2000 counts | High rate bins dominated by noise | Noise dominated (total time) | Noise dominated (detector-on time) | Marked lightcurve |
|---|---|---|---|---|---|---|---|
| A | 8468 | 7843 | 24 | 24 | 0.28% | 0.31% | 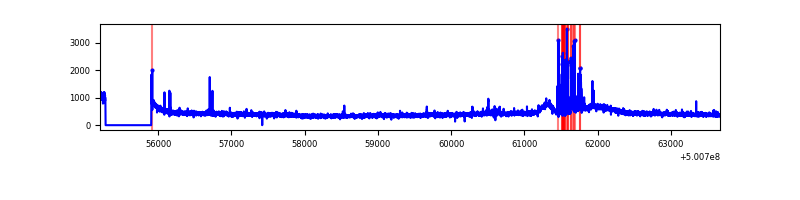 |
| B | 8467 | 7840 | 62 | 62 | 0.73% | 0.79% | 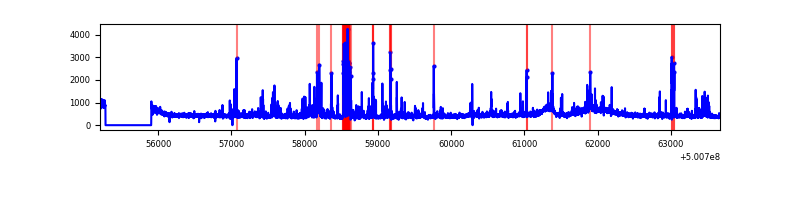 |
| C | 8467 | 7841 | 345 | 345 | 4.07% | 4.40% | 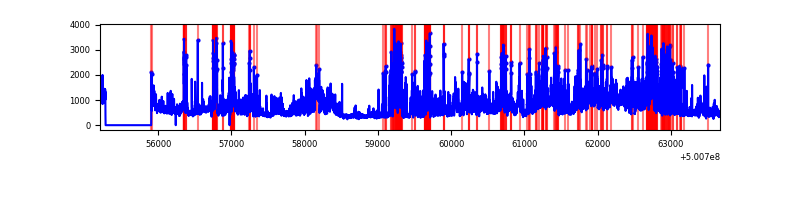 |
| D | 8467 | 7843 | 245 | 245 | 2.89% | 3.12% | 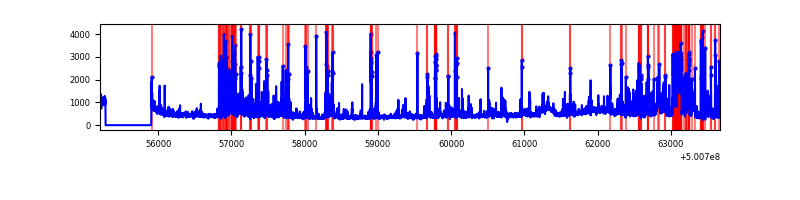 |
Top three noisy pixels from each quadrant. If the there are fewer than three noisy pixels in the level2.evt file, extra rows are filled as -1
| Pixel properties | Quadrant properties | ||||||
|---|---|---|---|---|---|---|---|
| Quadrant | DetID | PixID | Counts | Sigma | Mean | Median | Sigma |
| A | 5 | 240 | 74337 | 343.83 | 849 | 827 | 213.8 |
| A | 12 | 15 | 69697 | 322.12 | 849 | 827 | 213.8 |
| A | 3 | 14 | 22904 | 103.26 | 849 | 827 | 213.8 |
| B | 5 | 185 | 302502 | 1661.15 | 834 | 802 | 181.6 |
| B | 2 | 249 | 235549 | 1292.51 | 834 | 802 | 181.6 |
| B | 10 | 247 | 96869 | 528.94 | 834 | 802 | 181.6 |
| C | 9 | 38 | 2959353 | 13221.52 | 808 | 800 | 223.8 |
| C | 6 | 223 | 196993 | 876.77 | 808 | 800 | 223.8 |
| C | 13 | 3 | 117459 | 521.34 | 808 | 800 | 223.8 |
| D | 3 | 12 | 1212210 | 5201.3 | 814 | 779 | 232.9 |
| D | 14 | 52 | 108599 | 462.93 | 814 | 779 | 232.9 |
| D | 5 | 173 | 68115 | 289.11 | 814 | 779 | 232.9 |
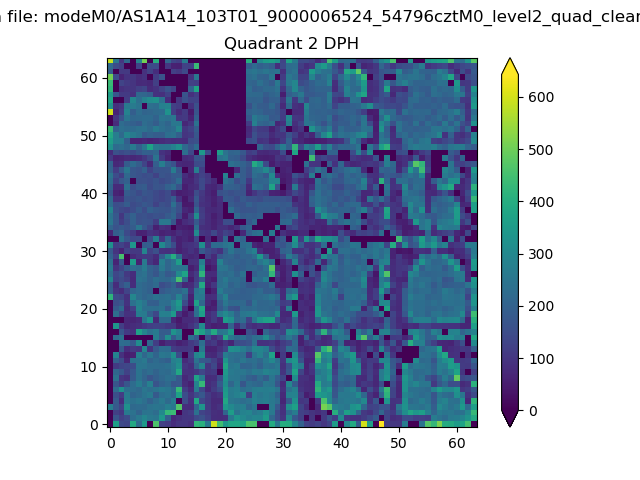
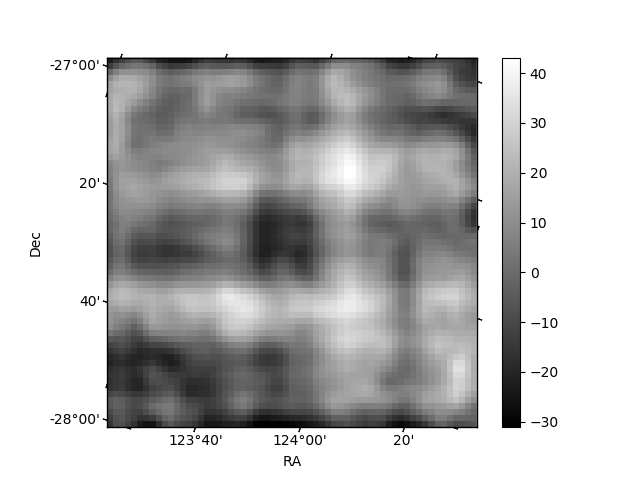
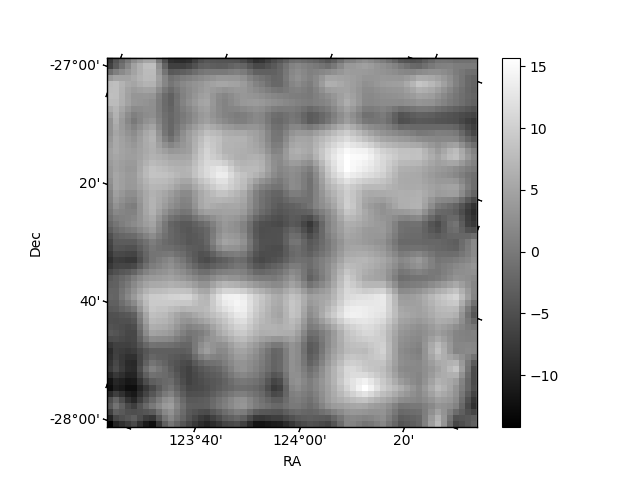
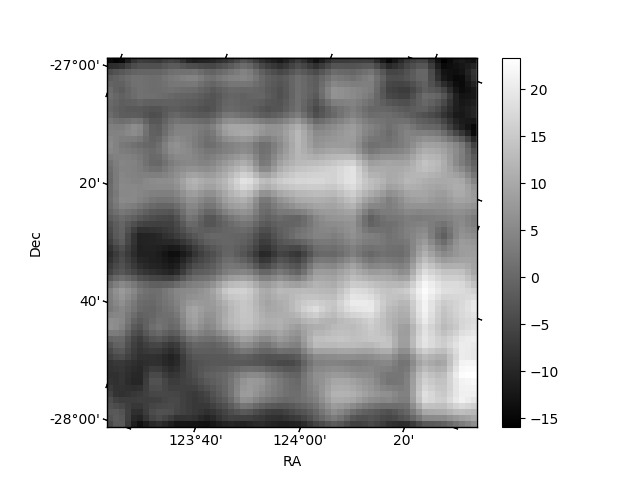
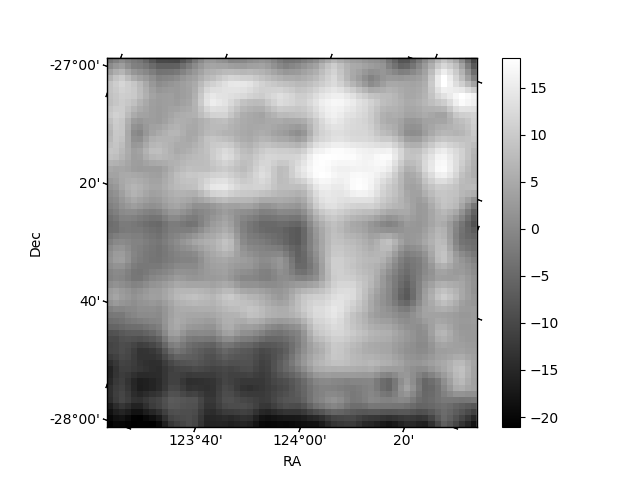
Histogram calculated using DETX and DETY for each event in the final _common_clean file
| Quadrant A | 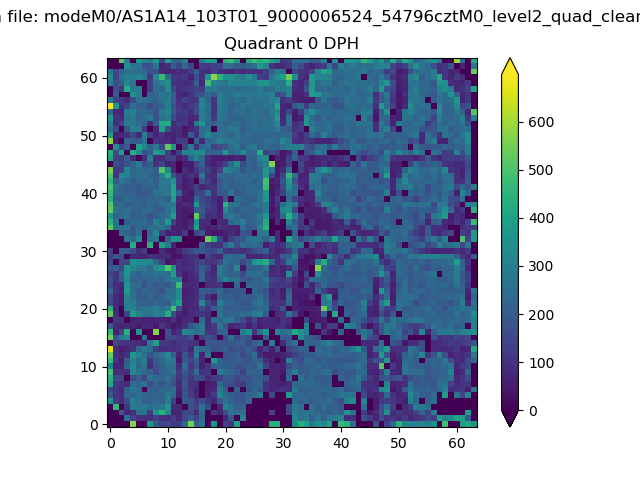 |
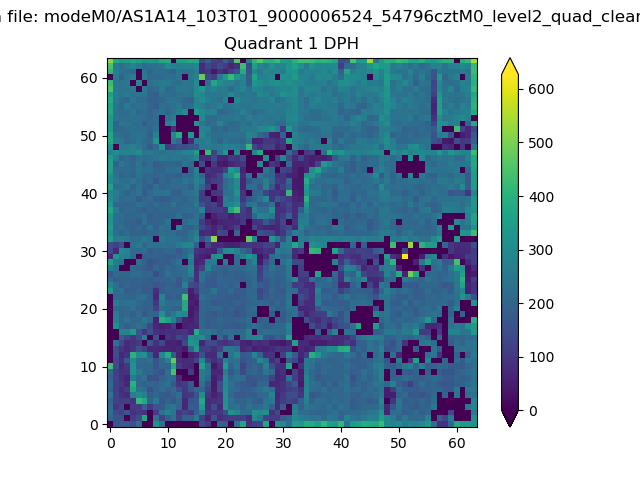 |
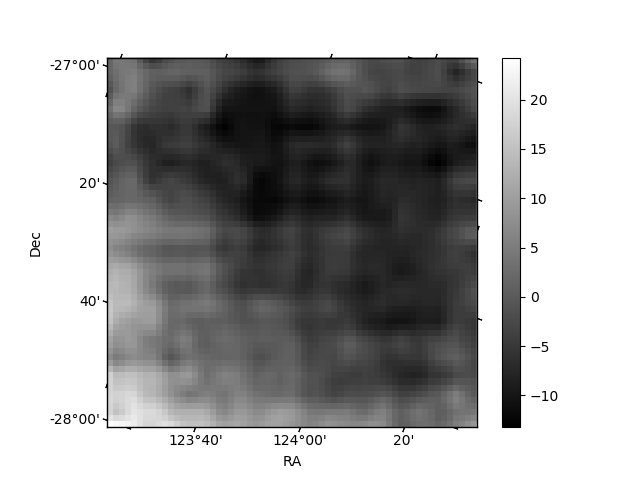
Quadrant B |
|---|---|---|---|
| Quadrant D | 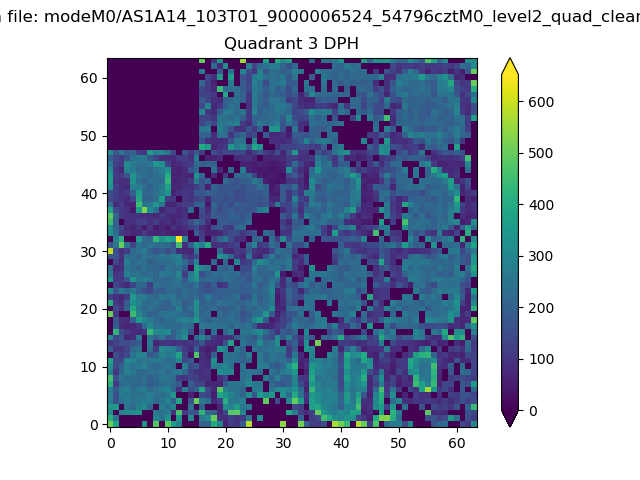 |
 |
Quadrant C |
| Plot type | Count rate plots | Images |
|---|---|---|
| Comparison with Poisson distribution Blue bars denote a histogram of data divided into 1 sec bins. Red curve is a Poisson curve with rate = median count rate of data. |
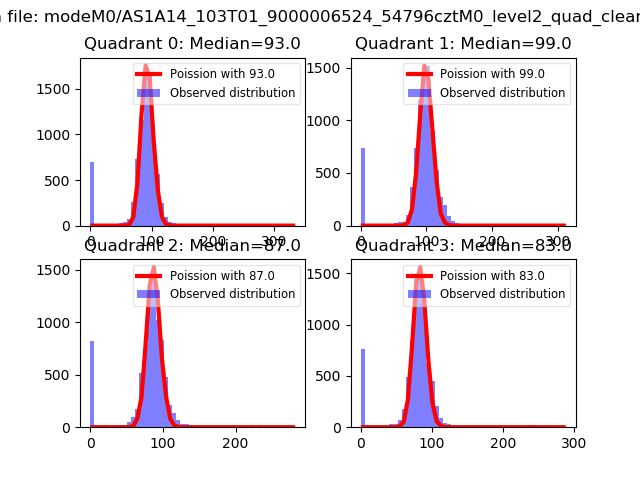 |
 |
| Quadrant-wise count rates Data is divided into 100 sec bins |
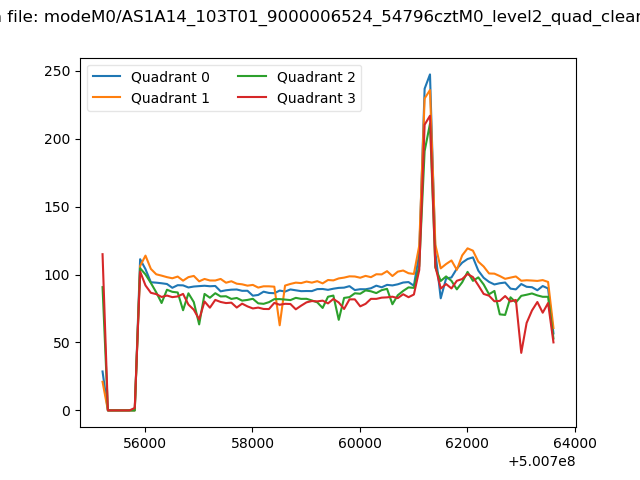 |
|
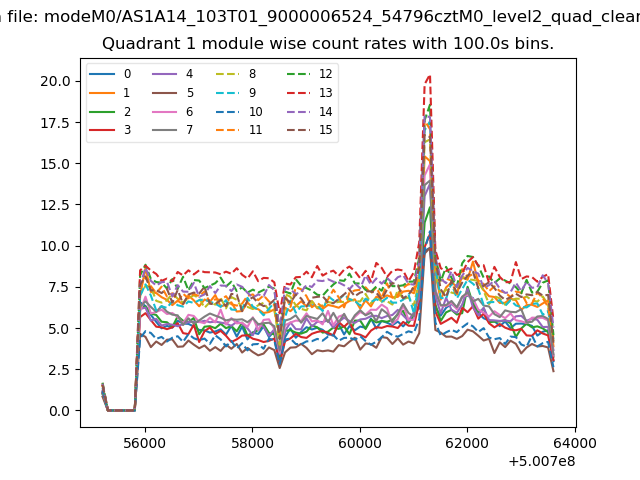
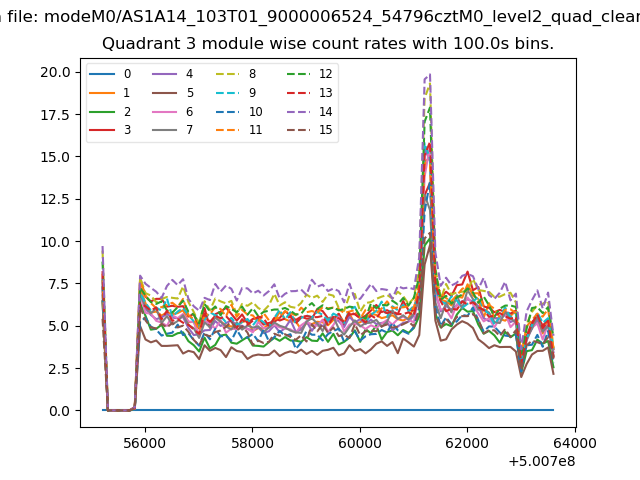
| Module-wise count rates for Quadrant A Data is divided into 100 sec bins |
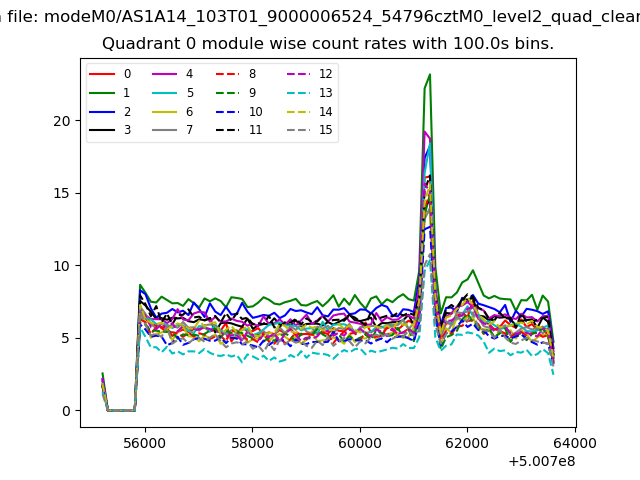 |
 |
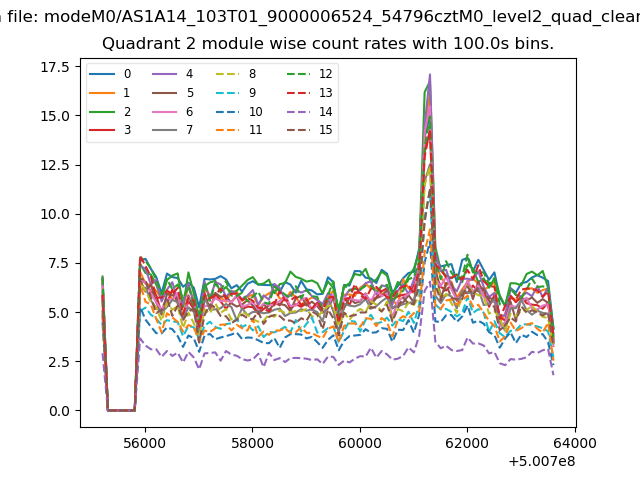
| Module-wise count rates for Quadrant B Data is divided into 100 sec bins |
 |
 |
| Module-wise count rates for Quadrant C Data is divided into 100 sec bins |
 |
 |
| Module-wise count rates for Quadrant D Data is divided into 100 sec bins |
 |
 |
| Parameter | Plot |
|---|---|
| CZT HV Monitor | 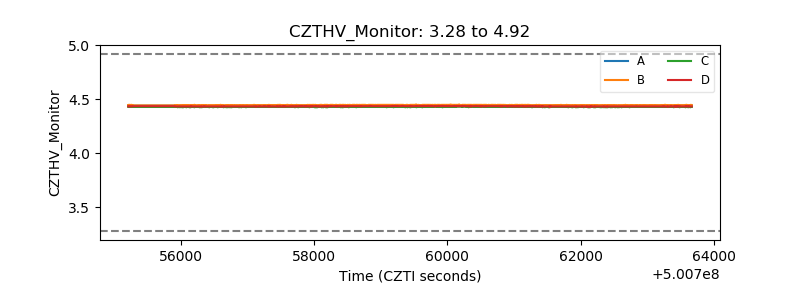 |
| D_VDD | 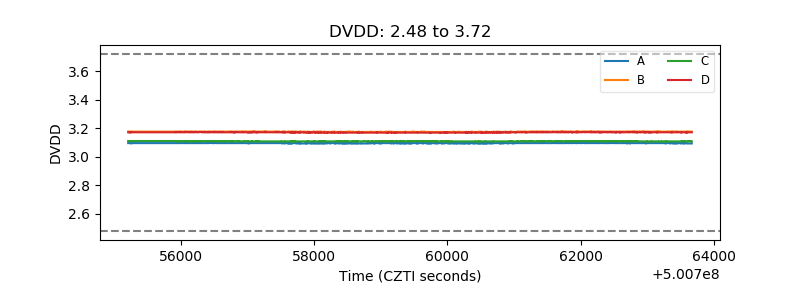 |
| Temperature 1 | 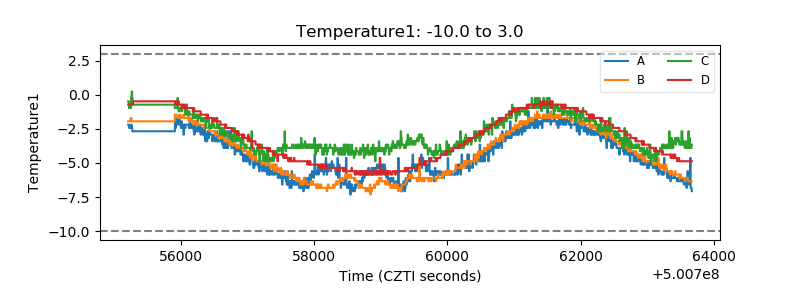 |
| Veto HV Monitor | 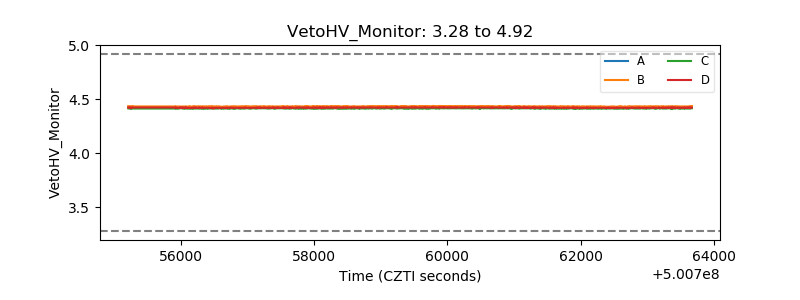 |
| Veto LLD | 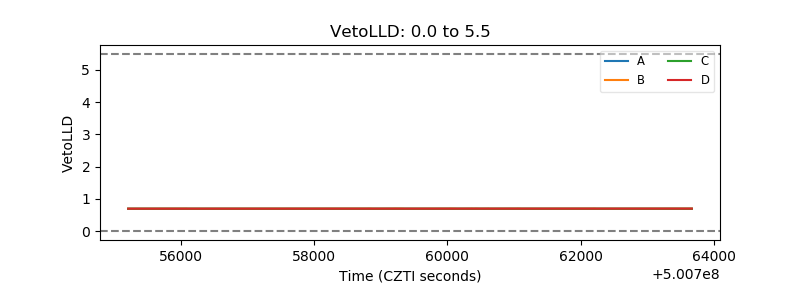 |
| Alpha Counter | 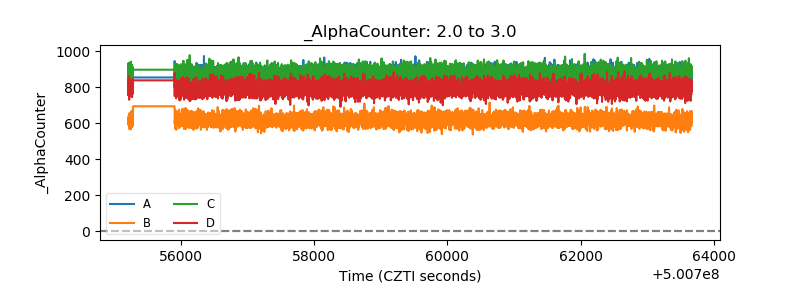 |
| _CPM_Rate | 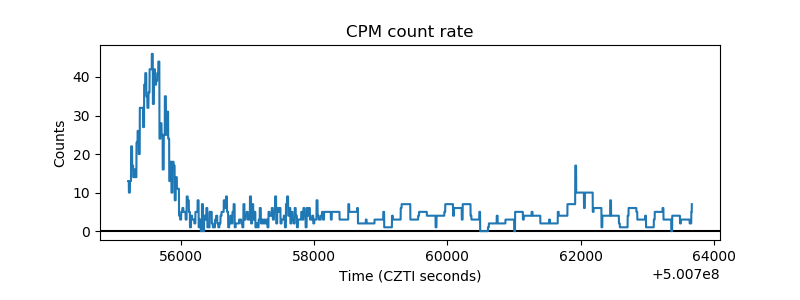 |
| CZT Counter | 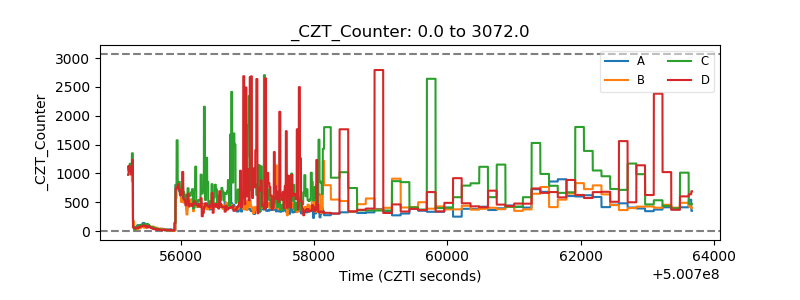 |
| +2.5 Volts monitor | 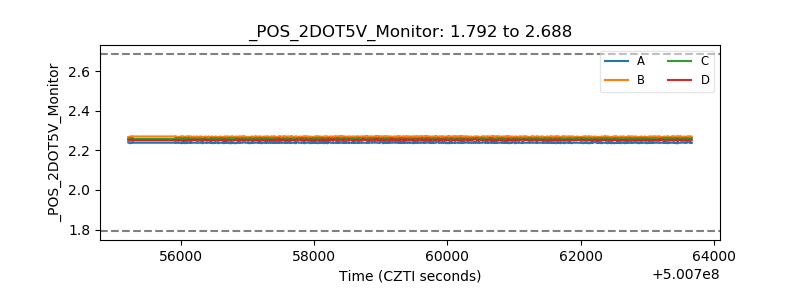 |
| +5 Volts monitor |  |
| _ROLL_ROT | 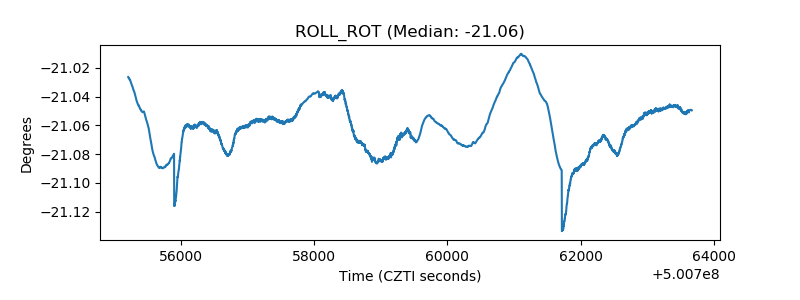 |
| _Roll_DEC | 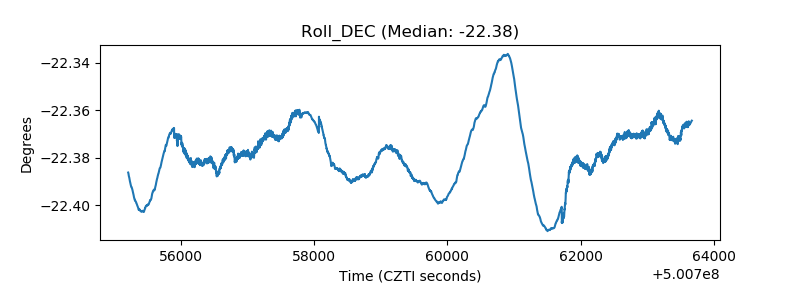 |
| _Roll_RA | 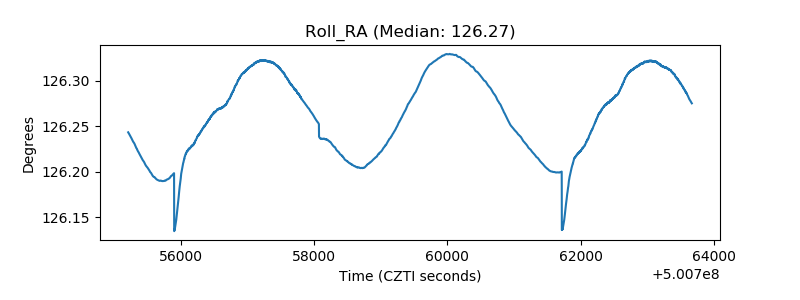 |
| Veto Counter | 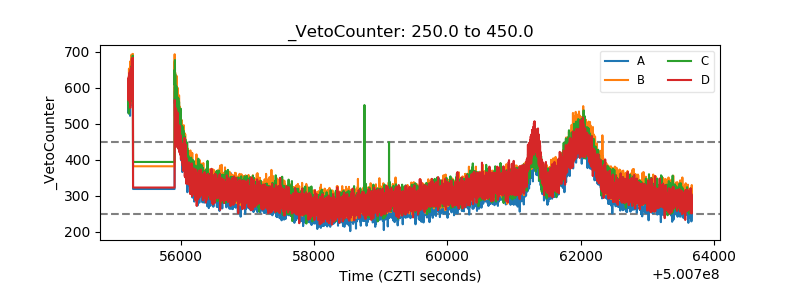 |