| Param | Original file | Final file |
|---|---|---|
| Filename | modeM0/AS1A14_103T01_9000006524_54797cztM0_level2.fits | modeM0/AS1A14_103T01_9000006524_54797cztM0_level2_quad_clean.evt |
| Size (bytes) | 481,870,080 | 115,836,480 |
| Size | 459.5 MB | 110.5 MB |
| Events in quadrant A | 3,348,288 | 757,163 |
| Events in quadrant B | 3,821,856 | 806,037 |
| Events in quadrant C | 5,162,614 | 706,546 |
| Events in quadrant D | 4,871,769 | 671,801 |
| Mode SS | |||
|---|---|---|---|
| Quadrant | BADHDUFLAG | Total packets | Discarded packets |
| A | 0 | 164 | 0 |
| B | 0 | 164 | 0 |
| C | 0 | 164 | 0 |
| D | 0 | 164 | 0 |
| Mode M0 | |||
|---|---|---|---|
| Quadrant | BADHDUFLAG | Total packets | Discarded packets |
| A | 0 | 16623 | 3 |
| B | 0 | 17491 | 15 |
| C | 0 | 21404 | 0 |
| D | 0 | 20811 | 7 |
| Quadrant | Total seconds | Saturated seconds | Saturation percentage |
|---|---|---|---|
| A | 8143 | 13 | 0.159646% |
| B | 8135 | 61 | 0.749846% |
| C | 8146 | 228 | 2.798920% |
| D | 8142 | 198 | 2.431835% |
Noise dominated data is calculated using 1-second bins in cleaned event files. If a bin has >2000 counts, and if more than 50% of those come from <1% of pixels, then it is considered to be noise-dominated and hence unusable.
| Quadrant | # 1 sec bins | Bins with >0 counts | Bins with >2000 counts | High rate bins dominated by noise | Noise dominated (total time) | Noise dominated (detector-on time) | Marked lightcurve |
|---|---|---|---|---|---|---|---|
| A | 8145 | 8144 | 1 | 1 | 0.01% | 0.01% | 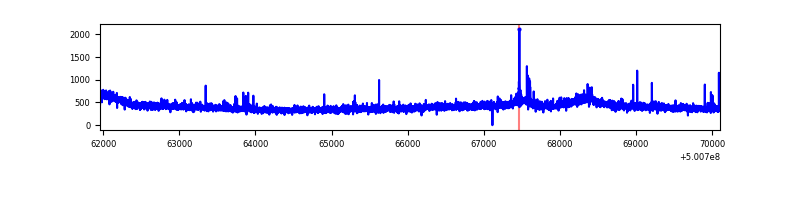 |
| B | 8145 | 8140 | 18 | 18 | 0.22% | 0.22% | 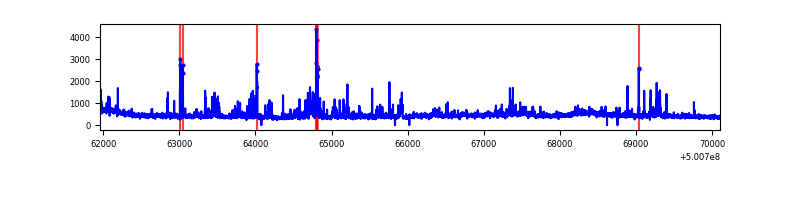 |
| C | 8146 | 8146 | 195 | 195 | 2.39% | 2.39% | 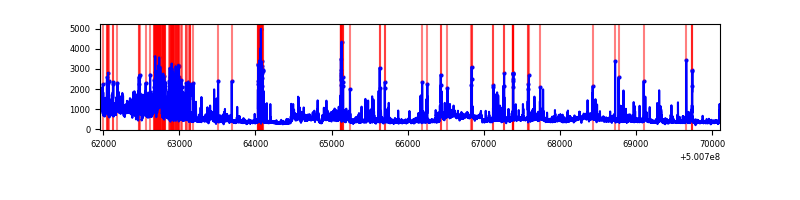 |
| D | 8145 | 8144 | 200 | 200 | 2.46% | 2.46% | 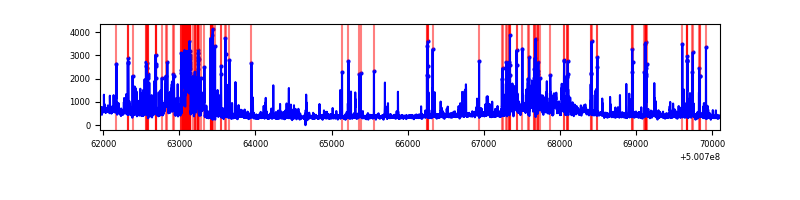 |
Top three noisy pixels from each quadrant. If the there are fewer than three noisy pixels in the level2.evt file, extra rows are filled as -1
| Pixel properties | Quadrant properties | ||||||
|---|---|---|---|---|---|---|---|
| Quadrant | DetID | PixID | Counts | Sigma | Mean | Median | Sigma |
| A | 3 | 14 | 25984 | 119.11 | 842 | 821 | 211.3 |
| A | 13 | 254 | 17498 | 78.94 | 842 | 821 | 211.3 |
| A | 8 | 246 | 17226 | 77.66 | 842 | 821 | 211.3 |
| B | 2 | 249 | 268571 | 1484.94 | 833 | 805 | 180.3 |
| B | 5 | 185 | 111456 | 613.63 | 833 | 805 | 180.3 |
| B | 10 | 247 | 80052 | 439.48 | 833 | 805 | 180.3 |
| C | 9 | 38 | 1196246 | 5364.02 | 808 | 798 | 222.9 |
| C | 6 | 223 | 237701 | 1062.99 | 808 | 798 | 222.9 |
| C | 14 | 254 | 204324 | 913.23 | 808 | 798 | 222.9 |
| D | 3 | 12 | 840991 | 3679.37 | 803 | 769 | 228.4 |
| D | 8 | 240 | 275793 | 1204.34 | 803 | 769 | 228.4 |
| D | 14 | 52 | 120874 | 525.95 | 803 | 769 | 228.4 |
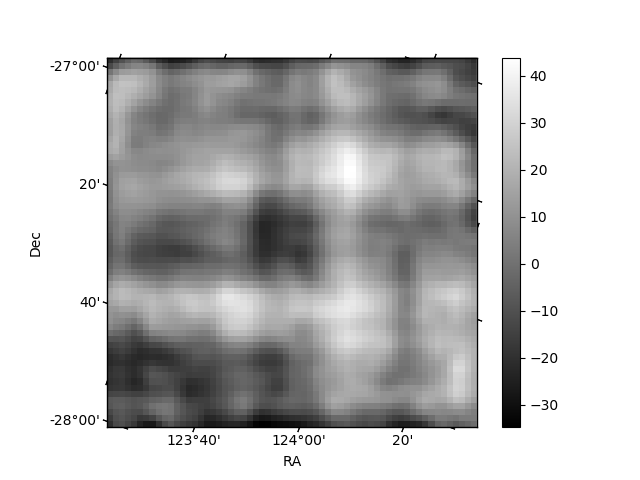
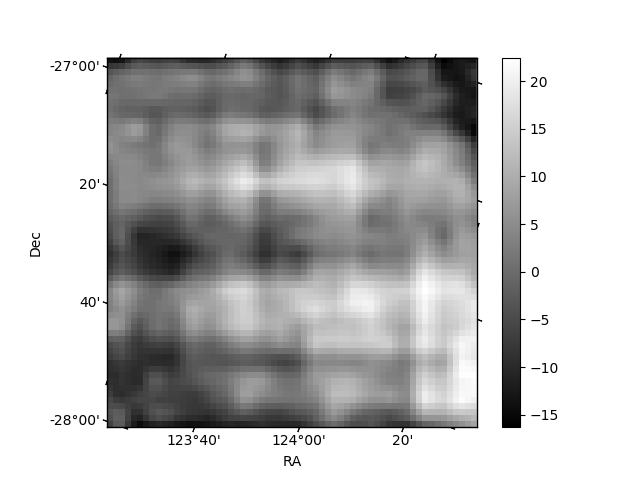
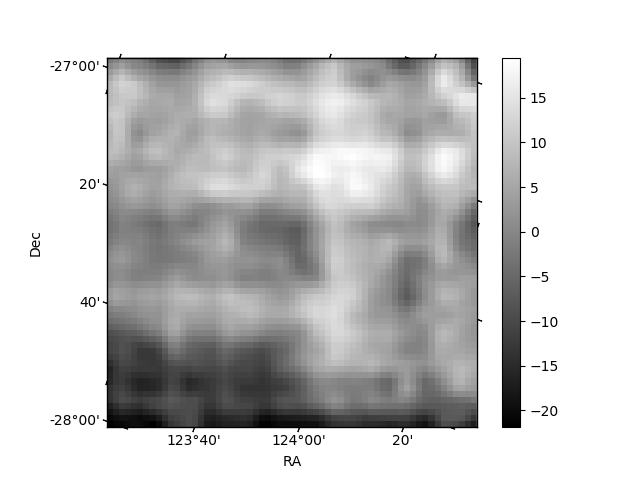
Histogram calculated using DETX and DETY for each event in the final _common_clean file
| Quadrant A | 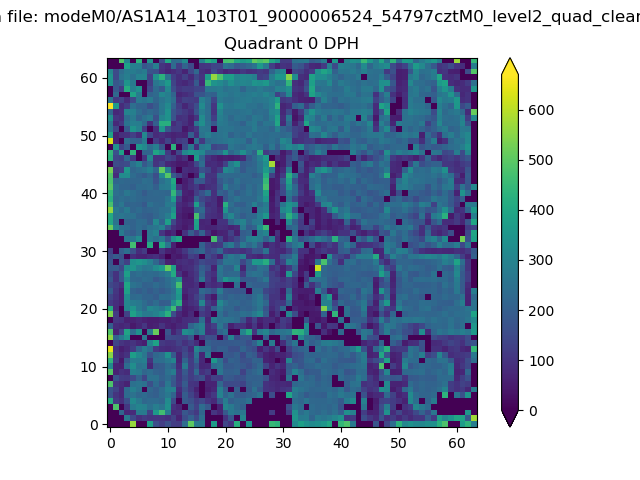 |
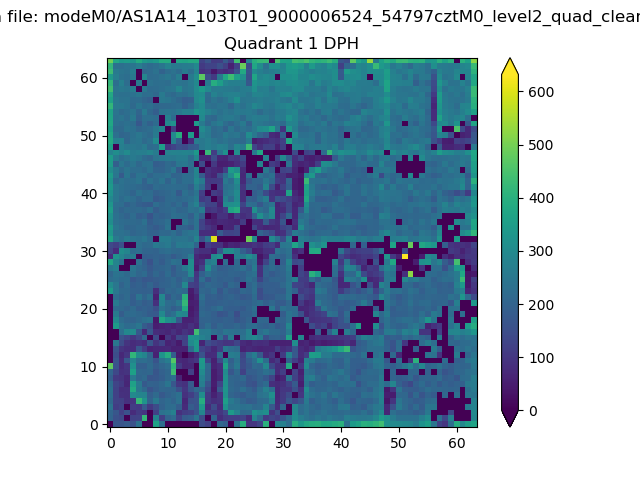 |
Quadrant B |
|---|---|---|---|
| Quadrant D | 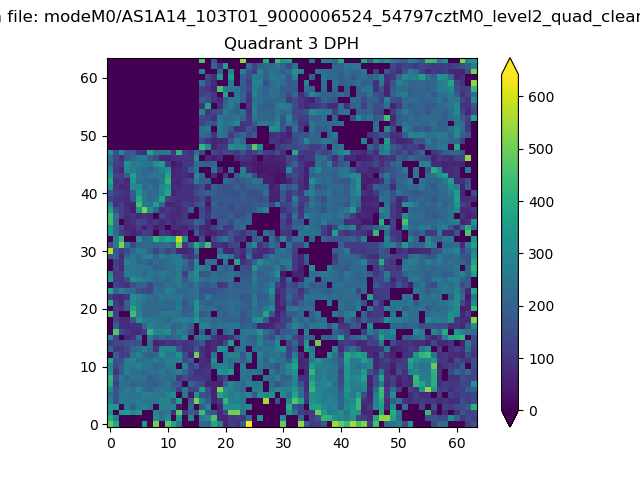 |
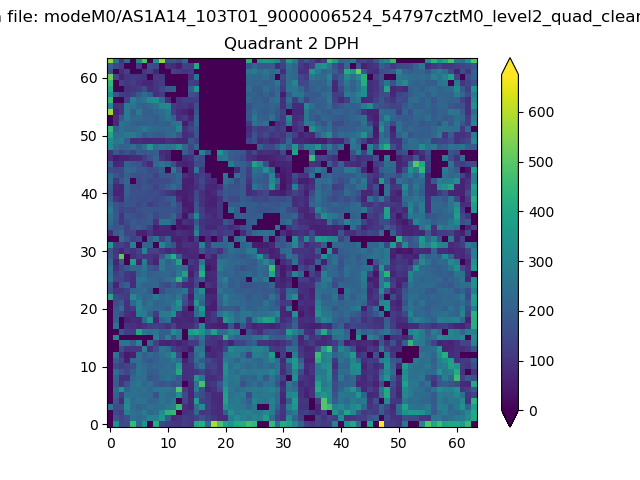 |
Quadrant C |
| Plot type | Count rate plots | Images |
|---|---|---|
| Comparison with Poisson distribution Blue bars denote a histogram of data divided into 1 sec bins. Red curve is a Poisson curve with rate = median count rate of data. |
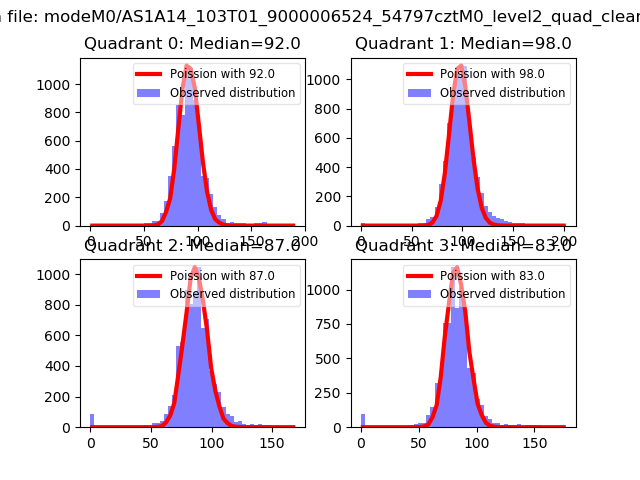 |
 |
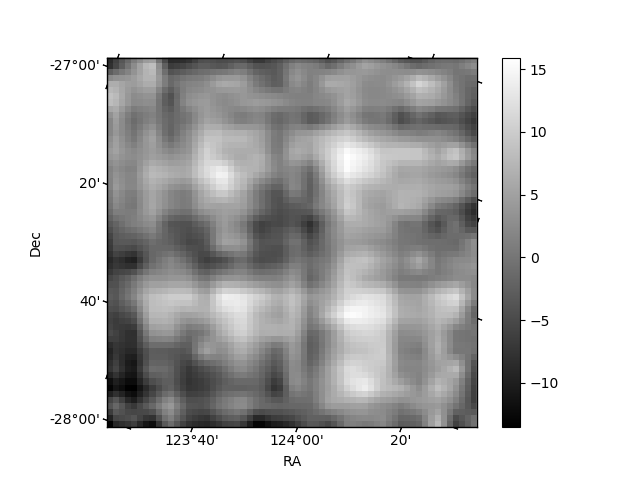
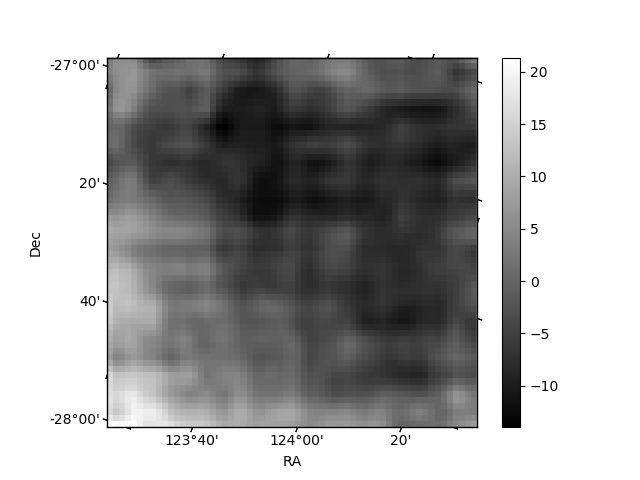
| Quadrant-wise count rates Data is divided into 100 sec bins |
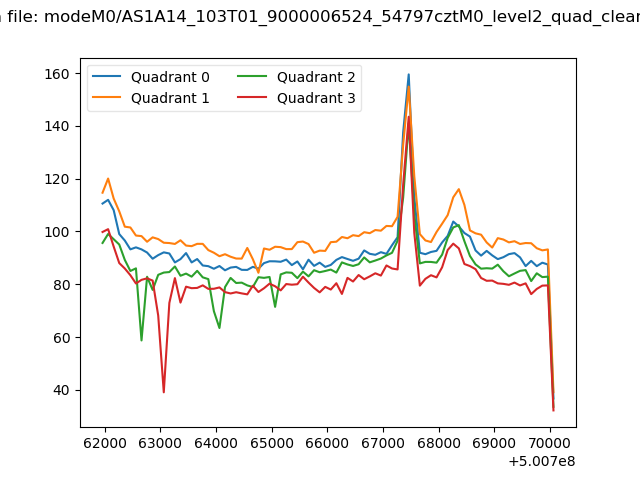 |
|
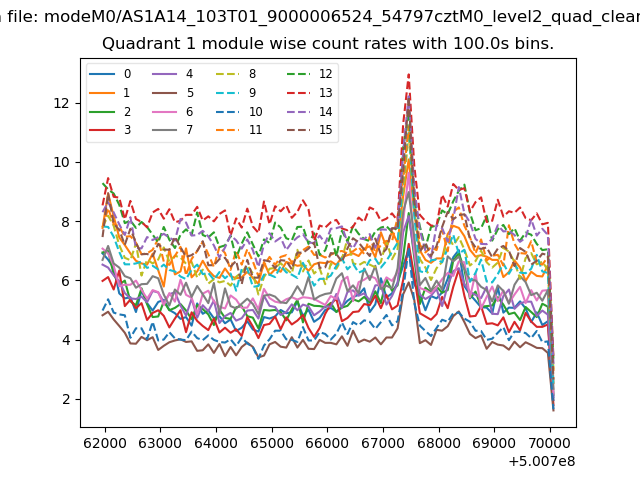
| Module-wise count rates for Quadrant A Data is divided into 100 sec bins |
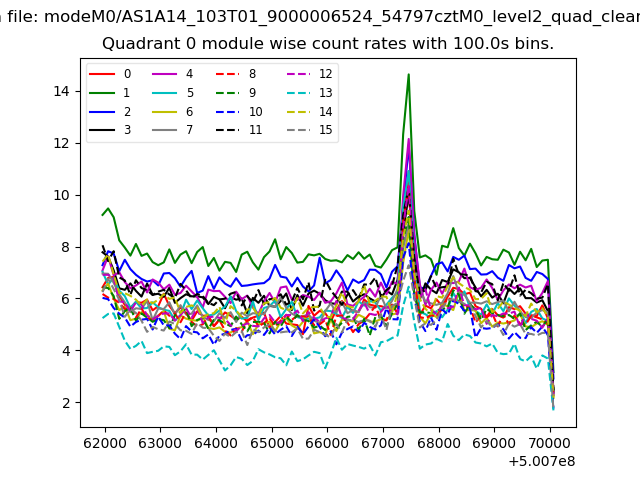 |
 |
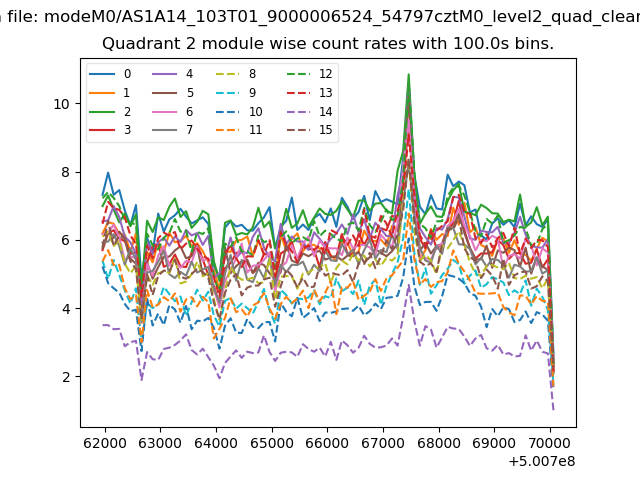
| Module-wise count rates for Quadrant B Data is divided into 100 sec bins |
 |
 |
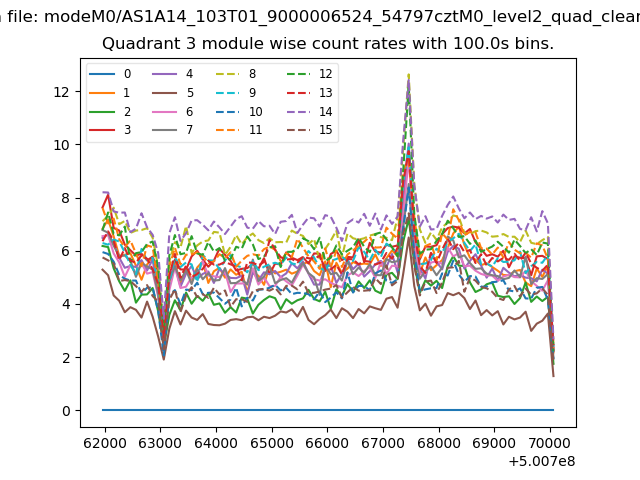
| Module-wise count rates for Quadrant C Data is divided into 100 sec bins |
 |
 |
| Module-wise count rates for Quadrant D Data is divided into 100 sec bins |
 |
 |
| Parameter | Plot |
|---|---|
| CZT HV Monitor | 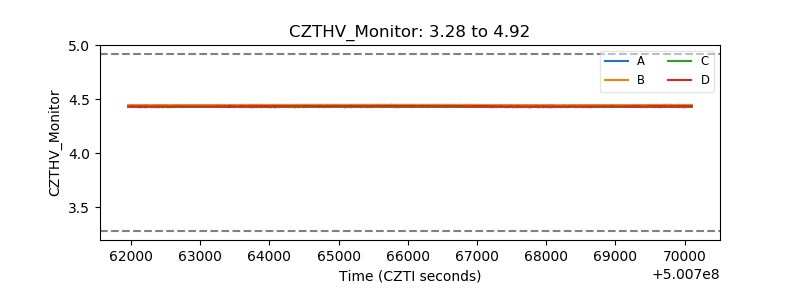 |
| D_VDD | 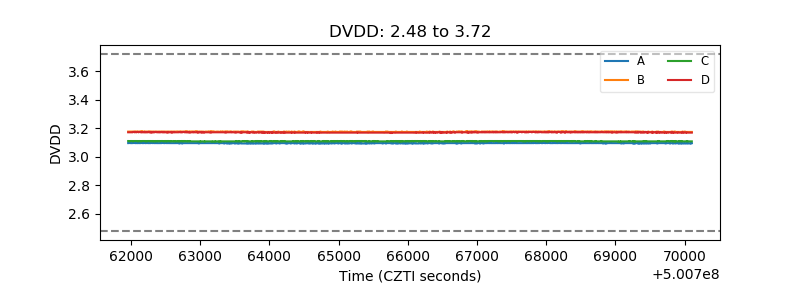 |
| Temperature 1 | 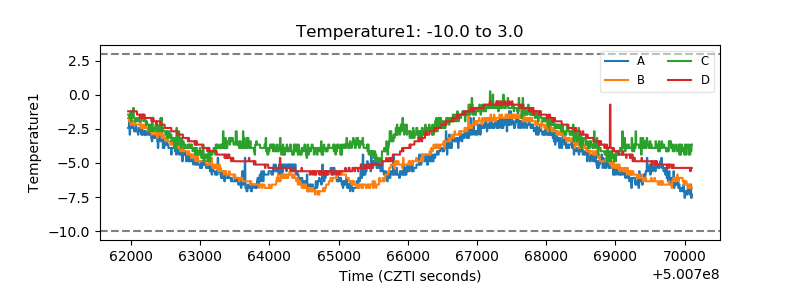 |
| Veto HV Monitor | 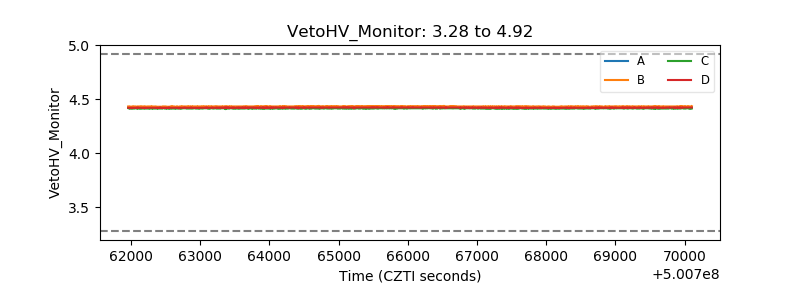 |
| Veto LLD | 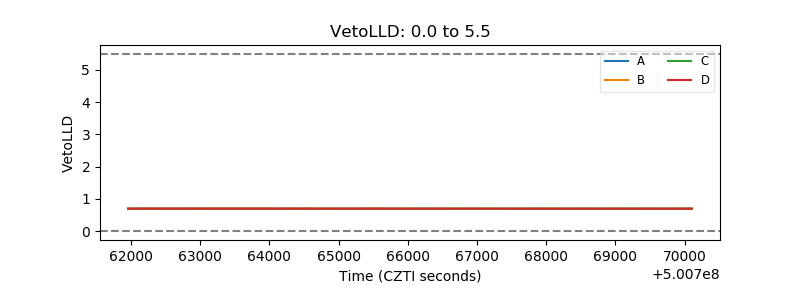 |
| Alpha Counter | 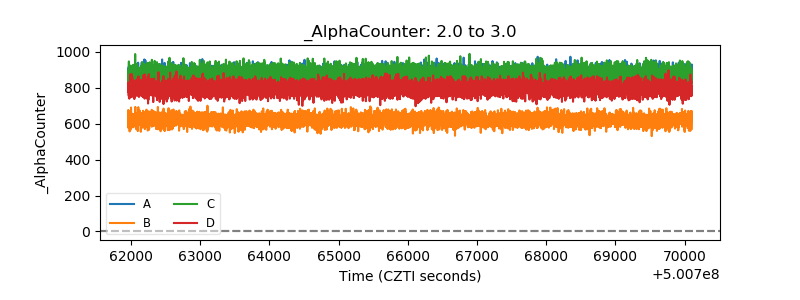 |
| _CPM_Rate | 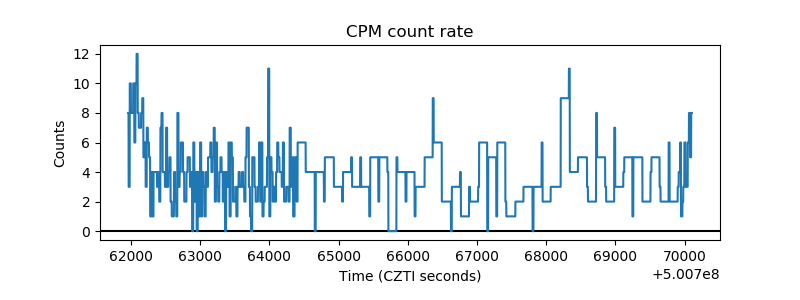 |
| CZT Counter | 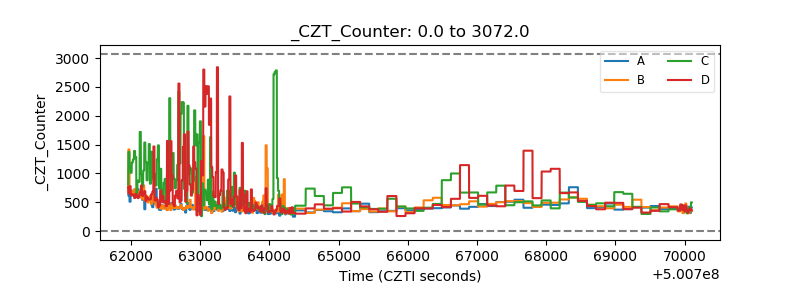 |
| +2.5 Volts monitor | 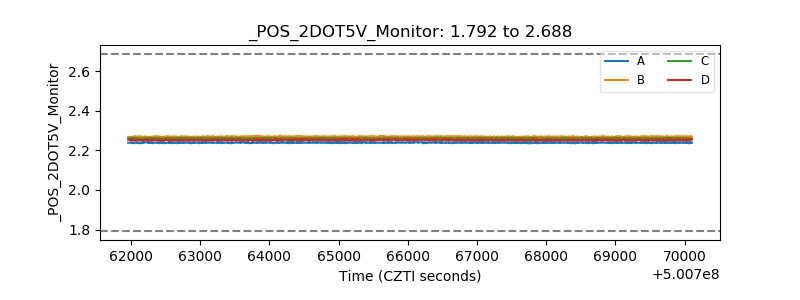 |
| +5 Volts monitor |  |
| _ROLL_ROT | 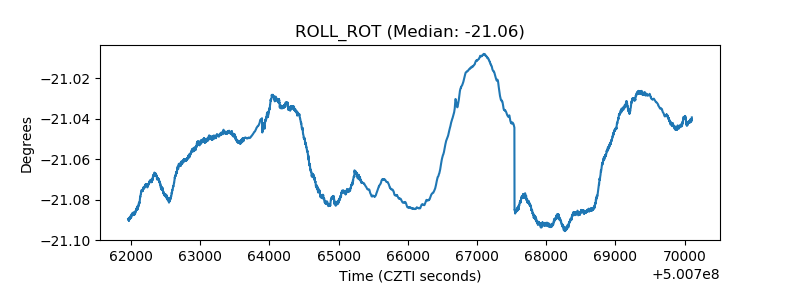 |
| _Roll_DEC | 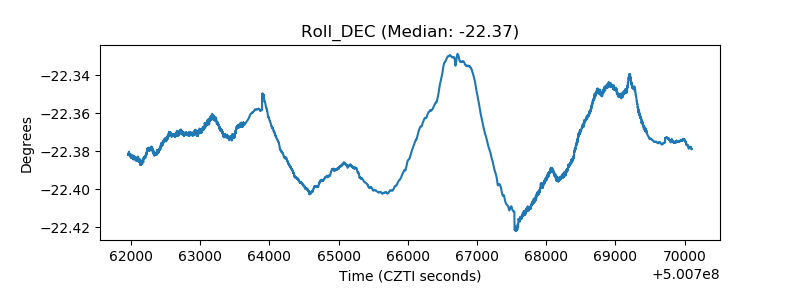 |
| _Roll_RA | 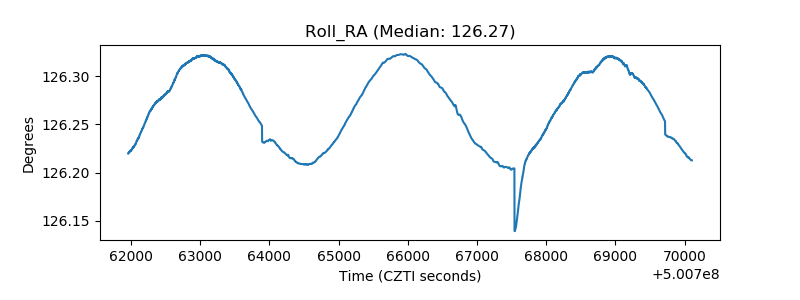 |
| Veto Counter | 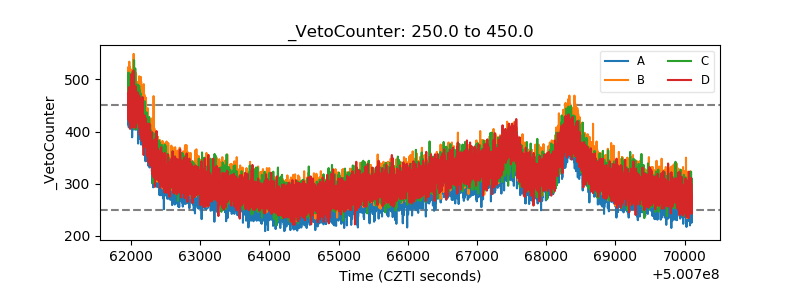 |