| Param | Original file | Final file |
|---|---|---|
| Filename | modeM0/AS1A14_039T06_9000006526cztM0_level2.fits | modeM0/AS1A14_039T06_9000006526cztM0_level2_quad_clean.evt |
| Size (bytes) | 4,474,886,400 | 2,306,416,320 |
| Size | 4.2 GB | 2.1 GB |
| Events in quadrant A | 26,851,756 | 8,707,966 |
| Events in quadrant B | 24,933,530 | 9,232,225 |
| Events in quadrant C | 25,581,128 | 7,989,528 |
| Events in quadrant D | 21,531,550 | 7,312,539 |
| Mode M9 | |||
|---|---|---|---|
| Quadrant | BADHDUFLAG | Total packets | Discarded packets |
| A | 0 | 615 | 0 |
| B | 0 | 615 | 0 |
| C | 0 | 615 | 0 |
| D | 0 | 615 | 0 |
| Mode M0 | |||
|---|---|---|---|
| Quadrant | BADHDUFLAG | Total packets | Discarded packets |
| A | 0 | 1221339 | 0 |
| B | 0 | 1245715 | 0 |
| C | 0 | 1406937 | 0 |
| D | 0 | 1634439 | 0 |
| Mode SS | |||
|---|---|---|---|
| Quadrant | BADHDUFLAG | Total packets | Discarded packets |
| A | 0 | 10831 | 0 |
| B | 0 | 10835 | 0 |
| C | 0 | 10834 | 0 |
| D | 0 | 10837 | 0 |
| Quadrant | Total seconds | Saturated seconds | Saturation percentage |
|---|---|---|---|
| A | 534194 | 11143 | 2.085946% |
| B | 534218 | 19526 | 3.655062% |
| C | 534149 | 25579 | 4.788739% |
| D | 534135 | 47512 | 8.895130% |
Noise dominated data is calculated using 1-second bins in cleaned event files. If a bin has >2000 counts, and if more than 50% of those come from <1% of pixels, then it is considered to be noise-dominated and hence unusable.
| Quadrant | # 1 sec bins | Bins with >0 counts | Bins with >2000 counts | High rate bins dominated by noise | Noise dominated (total time) | Noise dominated (detector-on time) | Marked lightcurve |
|---|---|---|---|---|---|---|---|
| A | 602467 | 534533 | 0 | 0 | 0.00% | 0.00% | 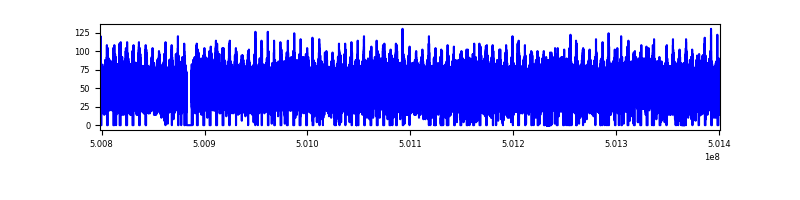 |
| B | 602467 | 534510 | 0 | 0 | 0.00% | 0.00% | 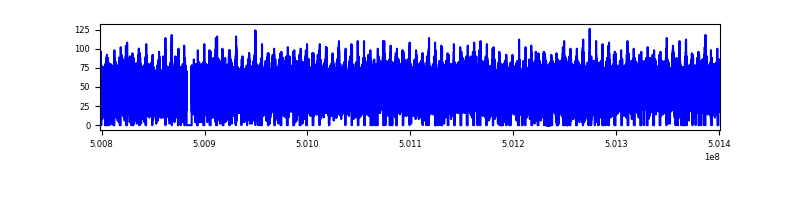 |
| C | 602467 | 533898 | 0 | 0 | 0.00% | 0.00% | 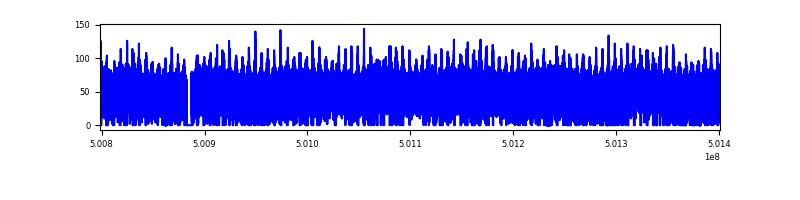 |
| D | 602467 | 532850 | 0 | 0 | 0.00% | 0.00% | 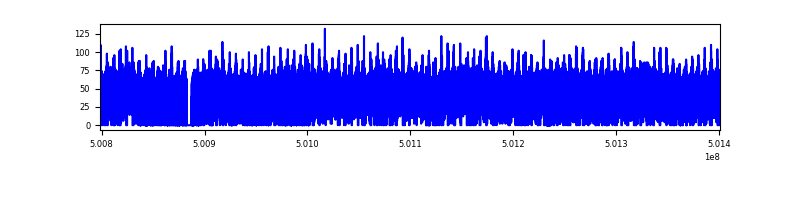 |
Top three noisy pixels from each quadrant. If the there are fewer than three noisy pixels in the level2.evt file, extra rows are filled as -1
| Pixel properties | Quadrant properties | ||||||
|---|---|---|---|---|---|---|---|
| Quadrant | DetID | PixID | Counts | Sigma | Mean | Median | Sigma |
| A | 14 | 188 | 29420 | 9.66 | 7052 | 6480 | 2375.1 |
| A | 9 | 255 | 26771 | 8.54 | 7052 | 6480 | 2375.1 |
| A | 14 | 204 | 23720 | 7.26 | 7052 | 6480 | 2375.1 |
| B | 3 | 25 | 20854 | 9.48 | 6589 | 6209 | 1544.7 |
| B | 3 | 17 | 19410 | 8.55 | 6589 | 6209 | 1544.7 |
| B | 9 | 173 | 19321 | 8.49 | 6589 | 6209 | 1544.7 |
| C | 15 | 175 | 20715 | 6.14 | 6826 | 6172 | 2366.6 |
| C | 15 | 127 | 20333 | 5.98 | 6826 | 6172 | 2366.6 |
| C | 2 | 31 | 19579 | 5.66 | 6826 | 6172 | 2366.6 |
| D | 6 | 218 | 26717 | 10.33 | 6163 | 5473 | 2055.9 |
| D | 15 | 11 | 20381 | 7.25 | 6163 | 5473 | 2055.9 |
| D | 3 | 30 | 20363 | 7.24 | 6163 | 5473 | 2055.9 |
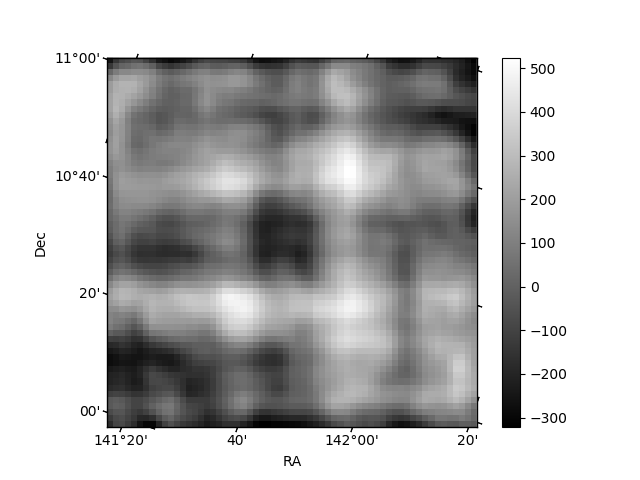
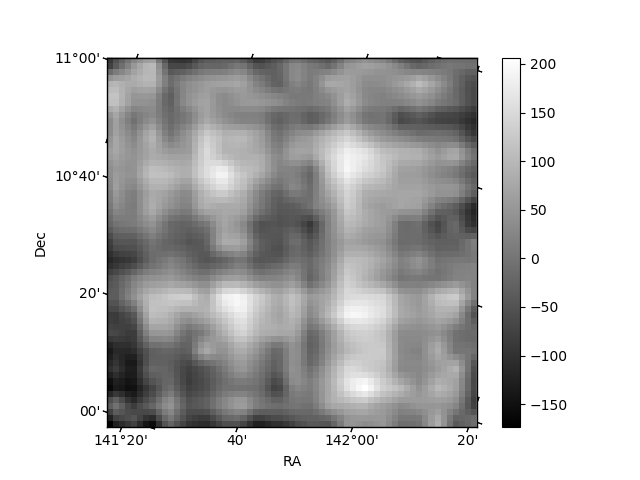
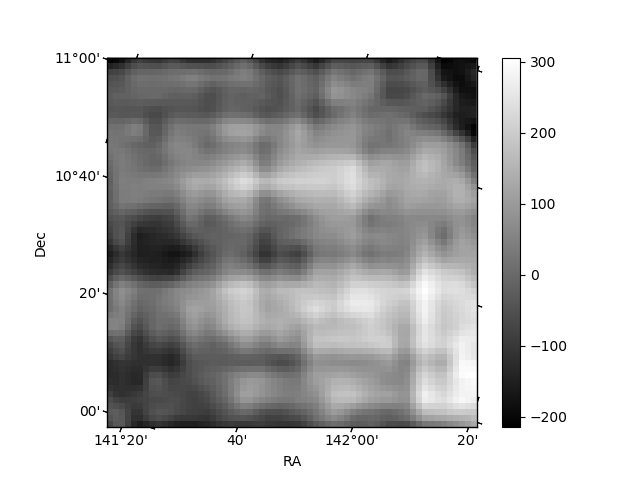
Histogram calculated using DETX and DETY for each event in the final _common_clean file
| Quadrant A | 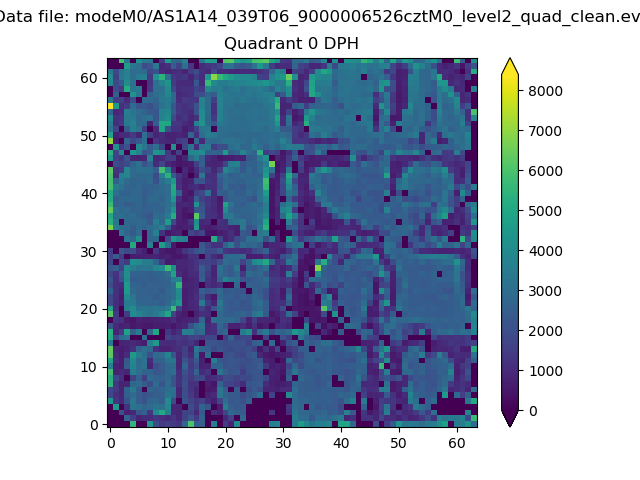 |
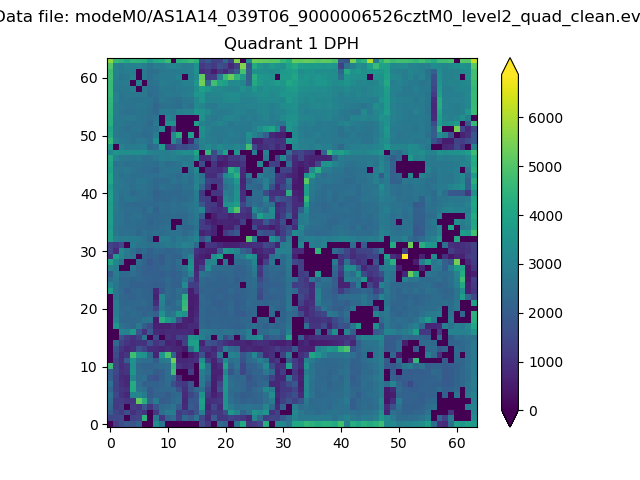 |
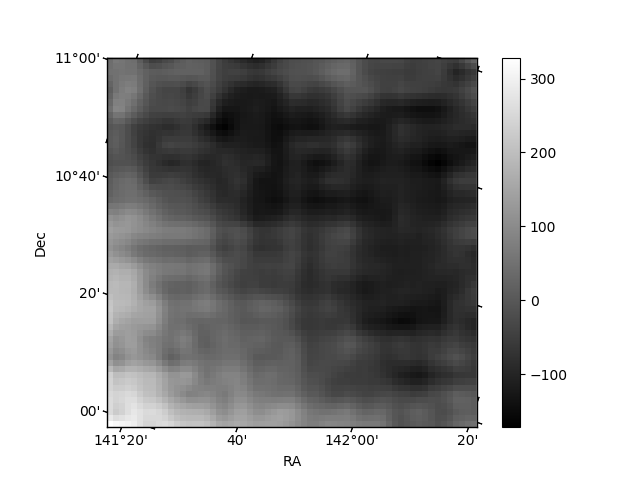
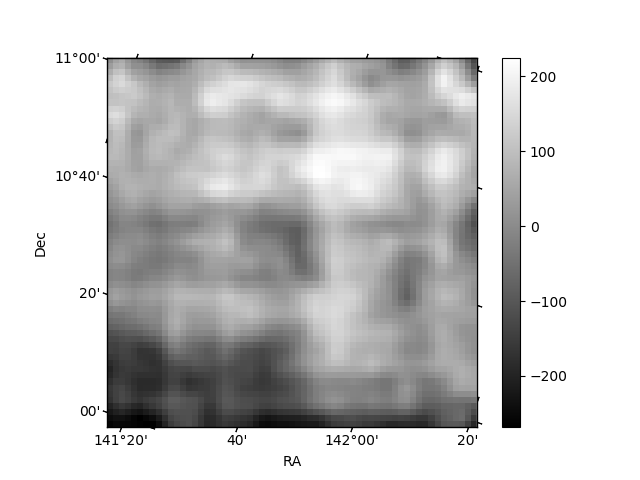
Quadrant B |
|---|---|---|---|
| Quadrant D | 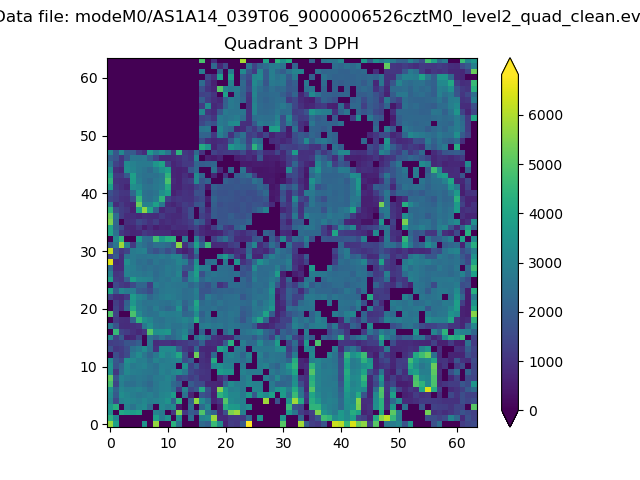 |
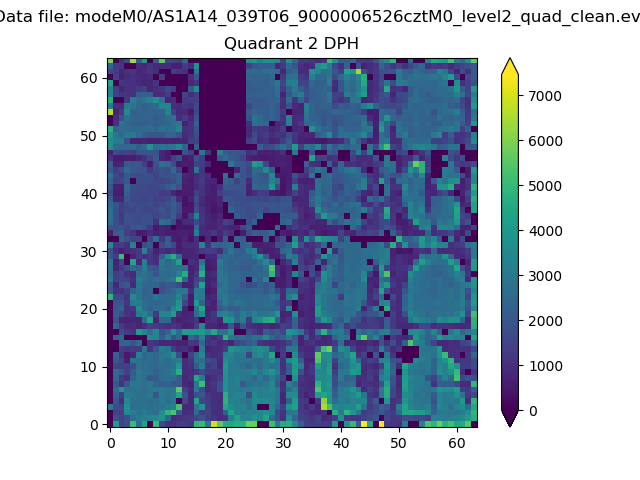 |
Quadrant C |
| Plot type | Count rate plots | Images |
|---|---|---|
| Comparison with Poisson distribution Blue bars denote a histogram of data divided into 1 sec bins. Red curve is a Poisson curve with rate = median count rate of data. |
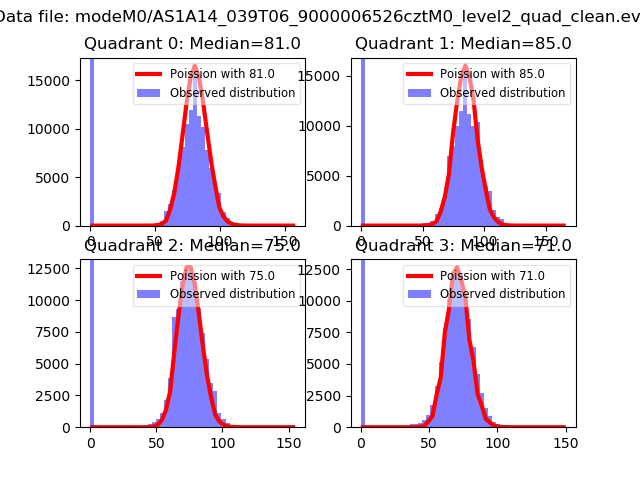 |
 |
| Quadrant-wise count rates Data is divided into 100 sec bins |
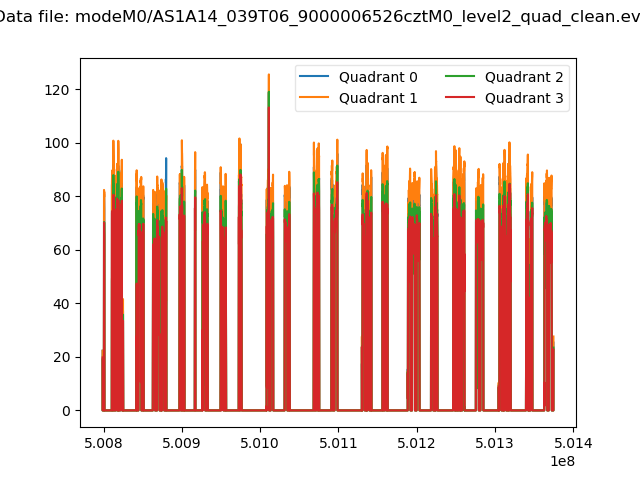 |
|
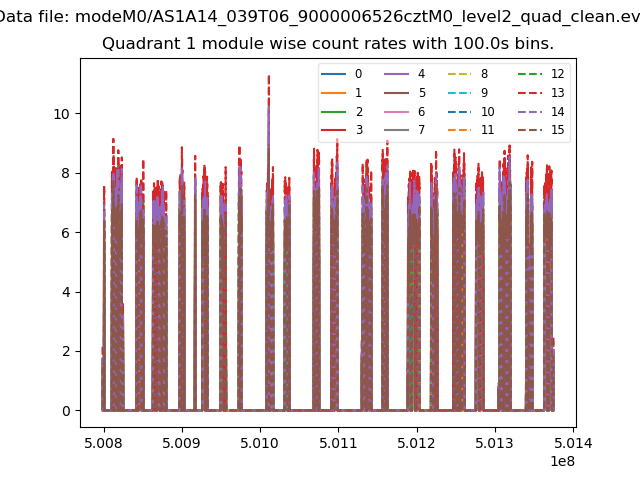
| Module-wise count rates for Quadrant A Data is divided into 100 sec bins |
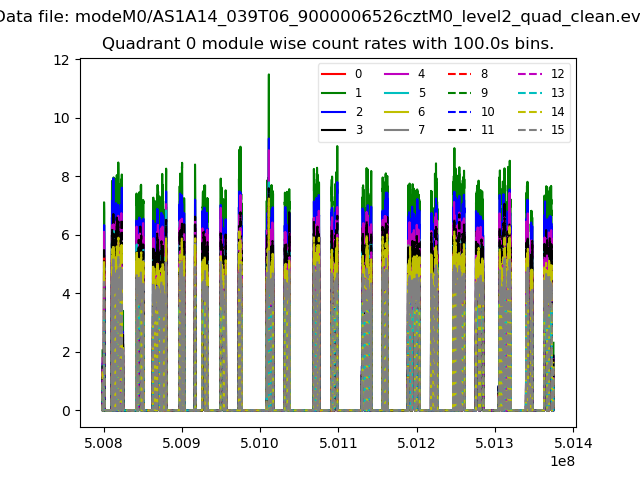 |
 |
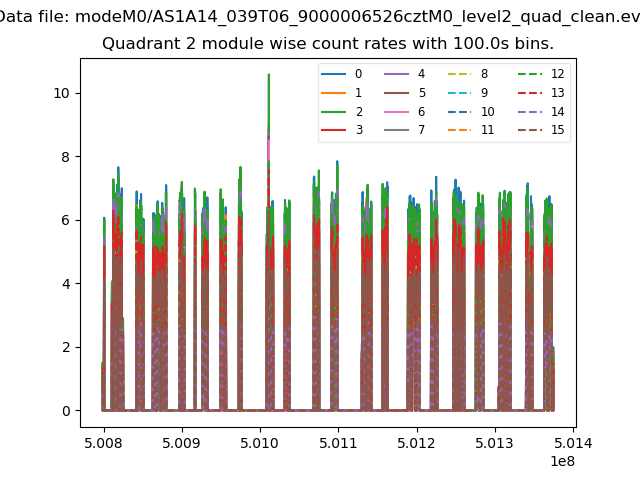
| Module-wise count rates for Quadrant B Data is divided into 100 sec bins |
 |
 |
| Module-wise count rates for Quadrant C Data is divided into 100 sec bins |
 |
 |
| Module-wise count rates for Quadrant D Data is divided into 100 sec bins |
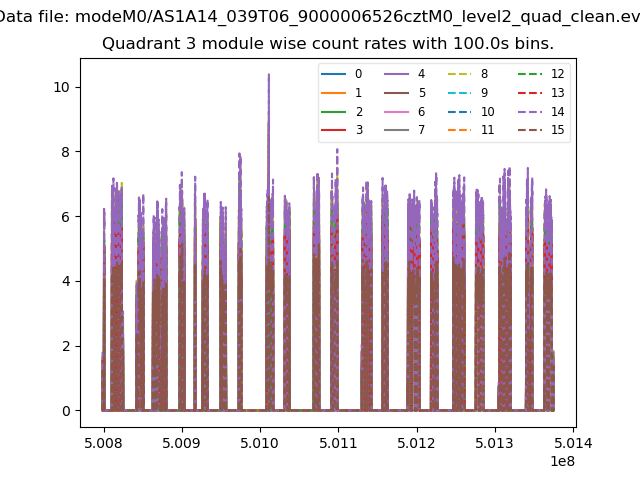 |
 |
| Parameter | Plot |
|---|---|
| CZT HV Monitor | 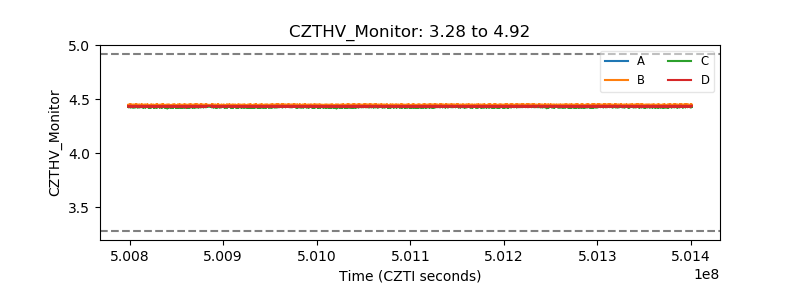 |
| D_VDD | 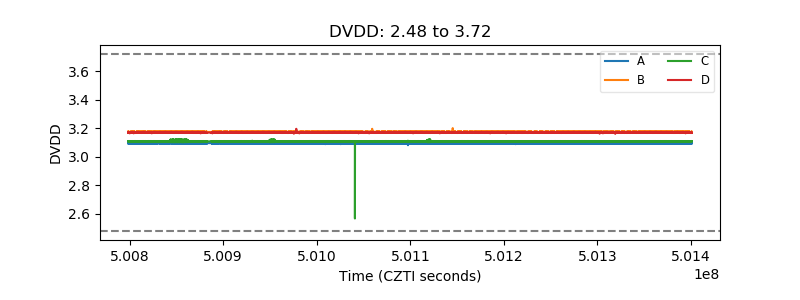 |
| Temperature 1 | 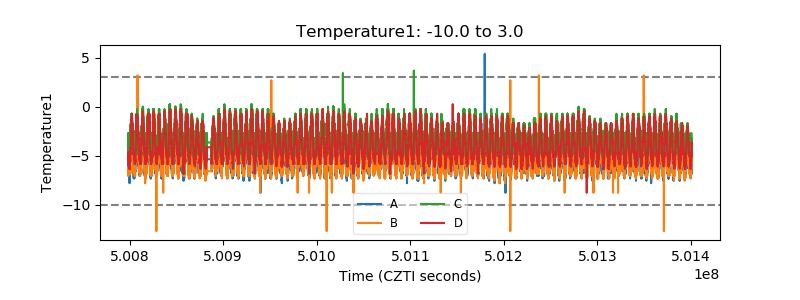 |
| Veto HV Monitor | 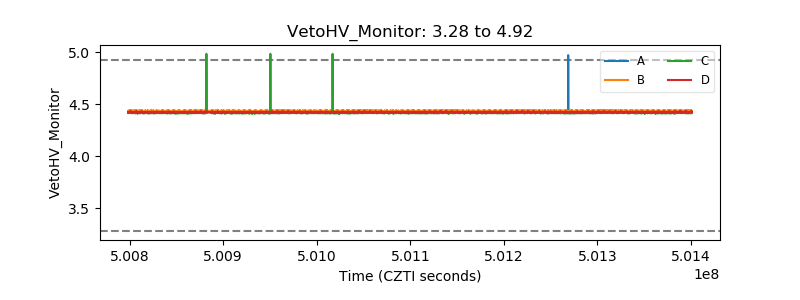 |
| Veto LLD | 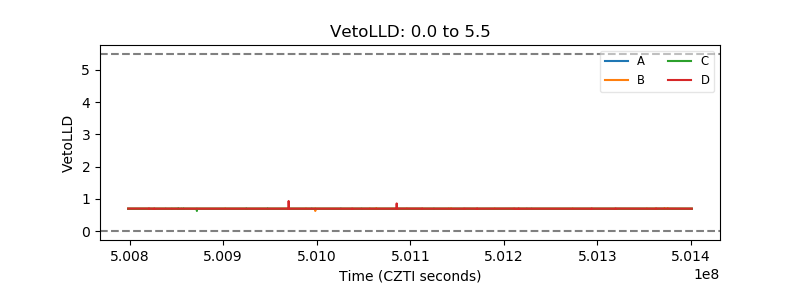 |
| Alpha Counter | 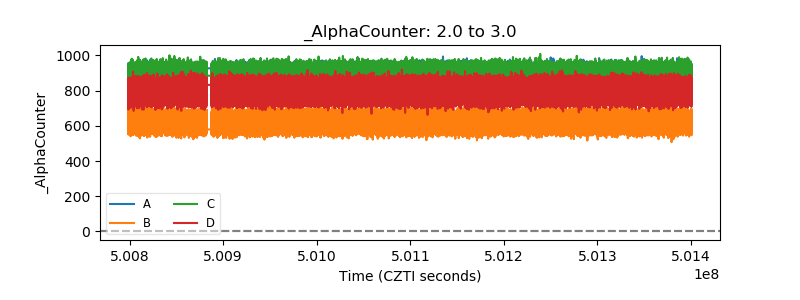 |
| _CPM_Rate | 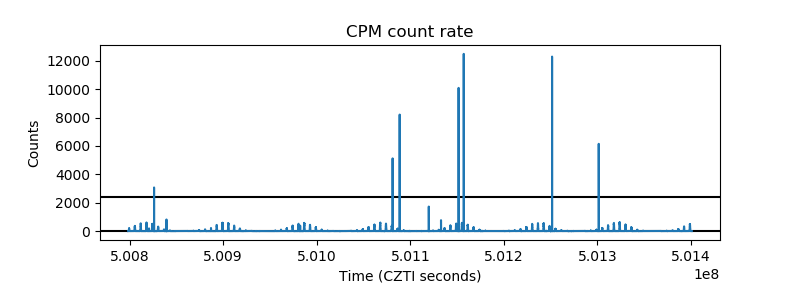 |
| CZT Counter | 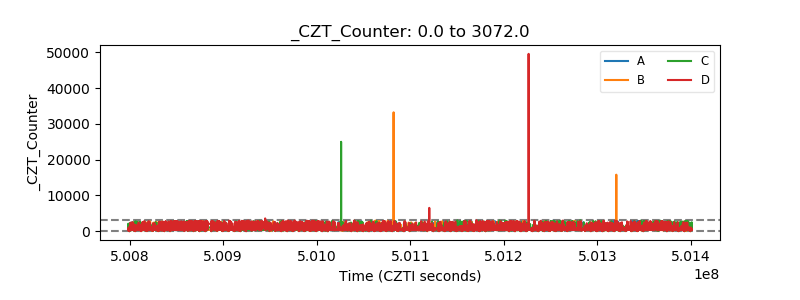 |
| +2.5 Volts monitor | 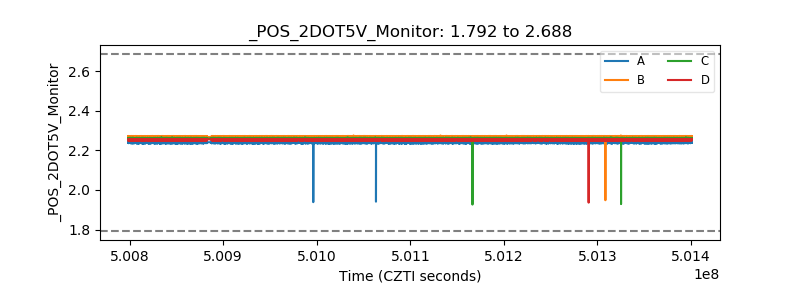 |
| +5 Volts monitor | 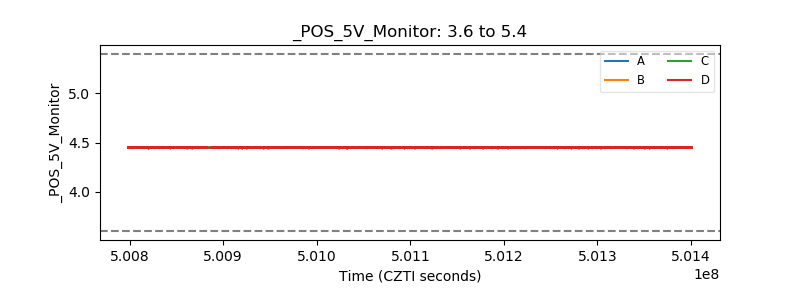 |
| _ROLL_ROT | 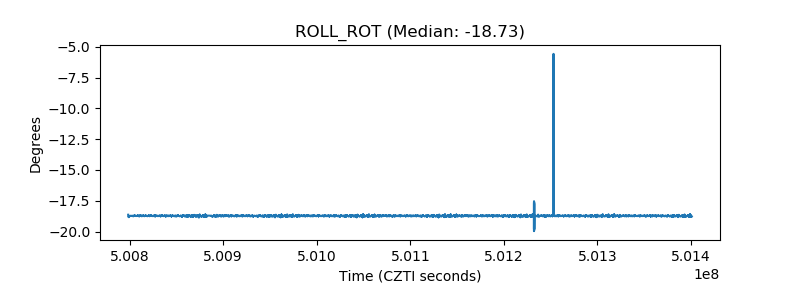 |
| _Roll_DEC |  |
| _Roll_RA | 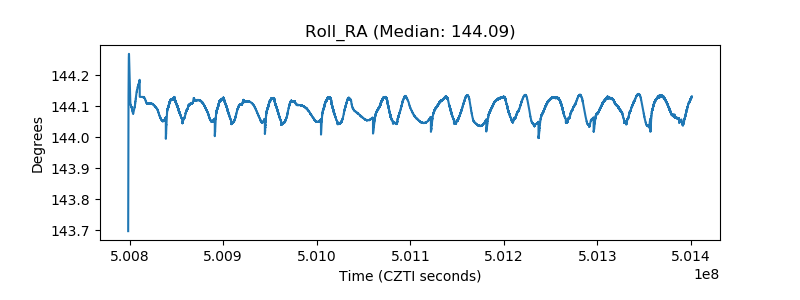 |
| Veto Counter | 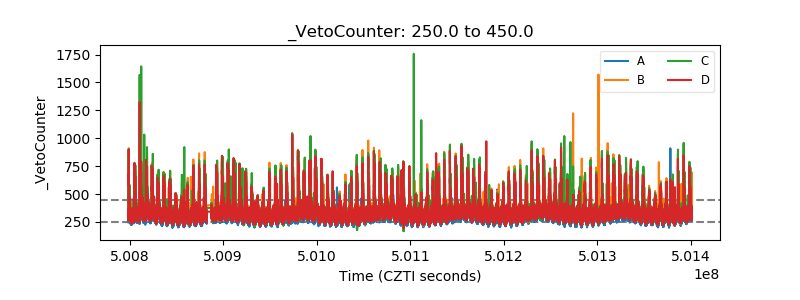 |