| Param | Original file | Final file |
|---|---|---|
| Filename | modeM0/AS1A14_039T06_9000006526_54805cztM0_level2.fits | modeM0/AS1A14_039T06_9000006526_54805cztM0_level2_quad_clean.evt |
| Size (bytes) | 453,136,320 | 82,969,920 |
| Size | 432.1 MB | 79.1 MB |
| Events in quadrant A | 2,490,671 | 556,917 |
| Events in quadrant B | 3,140,148 | 592,604 |
| Events in quadrant C | 7,168,850 | 459,557 |
| Events in quadrant D | 3,514,804 | 490,739 |
| Mode M9 | |||
|---|---|---|---|
| Quadrant | BADHDUFLAG | Total packets | Discarded packets |
| A | 0 | 11 | 0 |
| B | 0 | 11 | 0 |
| C | 0 | 11 | 0 |
| D | 0 | 11 | 0 |
| Mode M0 | |||
|---|---|---|---|
| Quadrant | BADHDUFLAG | Total packets | Discarded packets |
| A | 0 | 12092 | 1 |
| B | 0 | 13610 | 6 |
| C | 0 | 25480 | 9 |
| D | 0 | 14667 | 10 |
| Mode SS | |||
|---|---|---|---|
| Quadrant | BADHDUFLAG | Total packets | Discarded packets |
| A | 0 | 118 | 0 |
| B | 0 | 118 | 0 |
| C | 0 | 118 | 0 |
| D | 0 | 118 | 0 |
| Quadrant | Total seconds | Saturated seconds | Saturation percentage |
|---|---|---|---|
| A | 5910 | 69 | 1.167513% |
| B | 5907 | 143 | 2.420857% |
| C | 5908 | 1014 | 17.163169% |
| D | 5906 | 201 | 3.403319% |
Noise dominated data is calculated using 1-second bins in cleaned event files. If a bin has >2000 counts, and if more than 50% of those come from <1% of pixels, then it is considered to be noise-dominated and hence unusable.
| Quadrant | # 1 sec bins | Bins with >0 counts | Bins with >2000 counts | High rate bins dominated by noise | Noise dominated (total time) | Noise dominated (detector-on time) | Marked lightcurve |
|---|---|---|---|---|---|---|---|
| A | 6950 | 5910 | 2 | 2 | 0.03% | 0.03% | 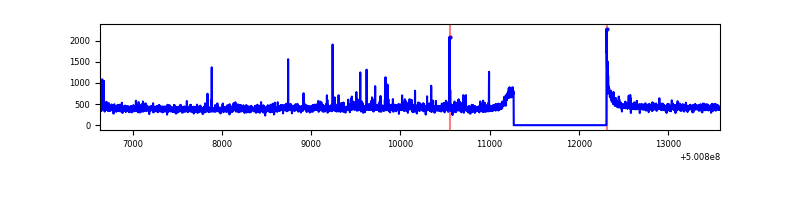 |
| B | 6950 | 5909 | 70 | 70 | 1.01% | 1.18% | 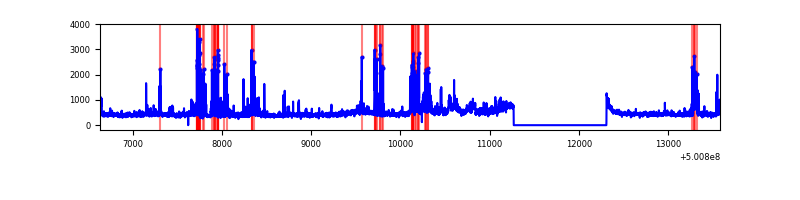 |
| C | 6950 | 5910 | 942 | 942 | 13.55% | 15.94% | 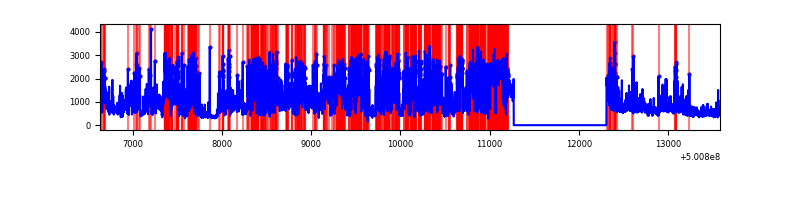 |
| D | 6951 | 5909 | 134 | 134 | 1.93% | 2.27% | 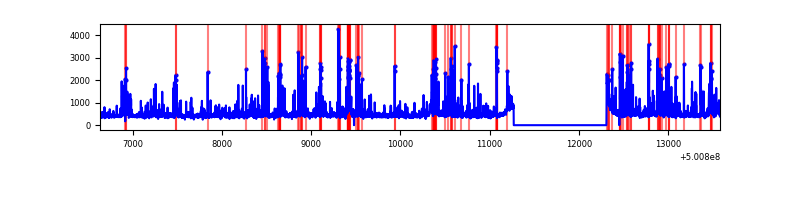 |
Top three noisy pixels from each quadrant. If the there are fewer than three noisy pixels in the level2.evt file, extra rows are filled as -1
| Pixel properties | Quadrant properties | ||||||
|---|---|---|---|---|---|---|---|
| Quadrant | DetID | PixID | Counts | Sigma | Mean | Median | Sigma |
| A | 3 | 94 | 23059 | 144.62 | 621 | 605 | 155.3 |
| A | 8 | 246 | 22598 | 141.65 | 621 | 605 | 155.3 |
| A | 13 | 254 | 11398 | 69.51 | 621 | 605 | 155.3 |
| B | 5 | 185 | 368142 | 2783.99 | 607 | 586 | 132.0 |
| B | 7 | 0 | 216597 | 1636.14 | 607 | 586 | 132.0 |
| B | 2 | 249 | 63071 | 473.28 | 607 | 586 | 132.0 |
| C | 9 | 38 | 4321174 | 27874.64 | 563 | 556 | 155.0 |
| C | 12 | 252 | 261461 | 1683.24 | 563 | 556 | 155.0 |
| C | 14 | 254 | 168655 | 1084.49 | 563 | 556 | 155.0 |
| D | 15 | 109 | 289537 | 1698.77 | 598 | 573 | 170.1 |
| D | 10 | 181 | 205372 | 1203.98 | 598 | 573 | 170.1 |
| D | 2 | 249 | 201342 | 1180.28 | 598 | 573 | 170.1 |
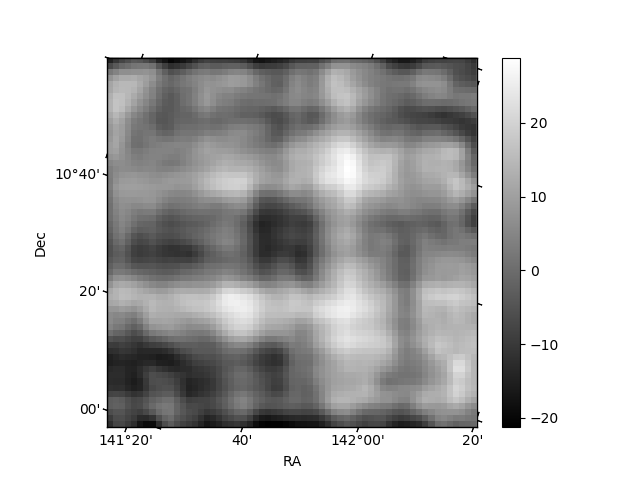
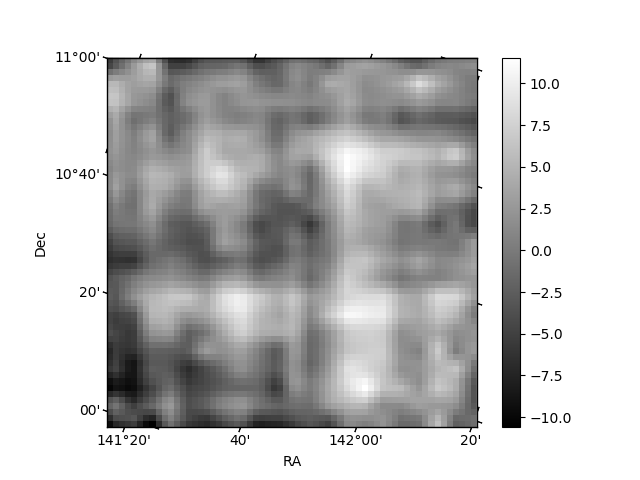
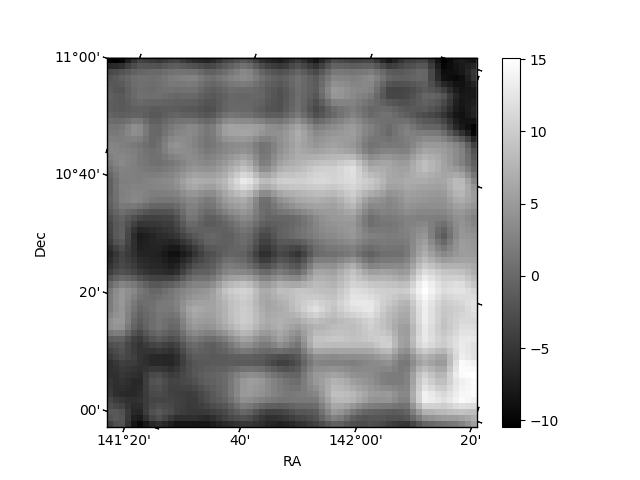
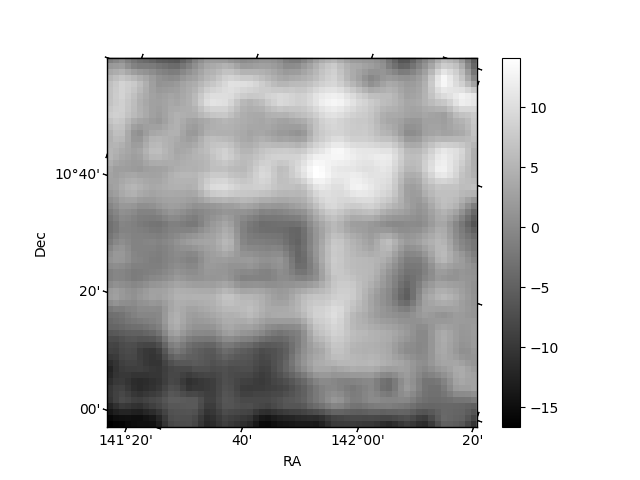
Histogram calculated using DETX and DETY for each event in the final _common_clean file
| Quadrant A | 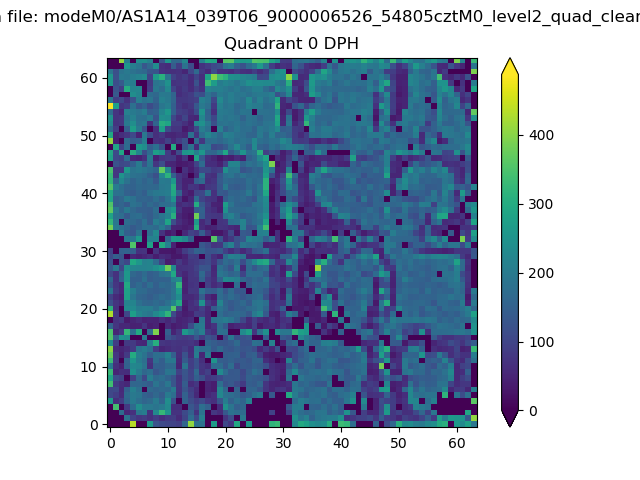 |
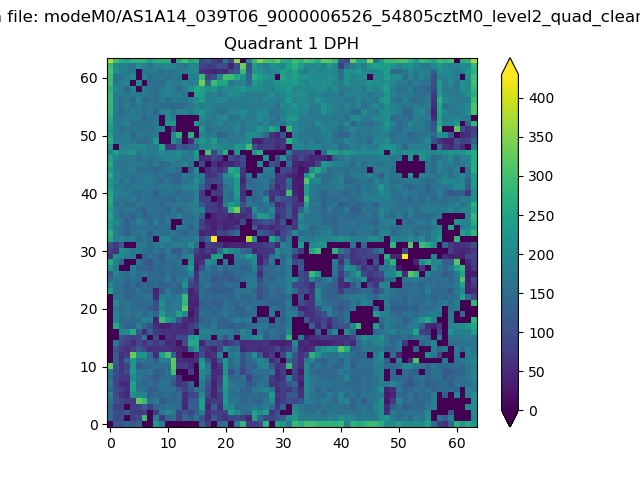 |
Quadrant B |
|---|---|---|---|
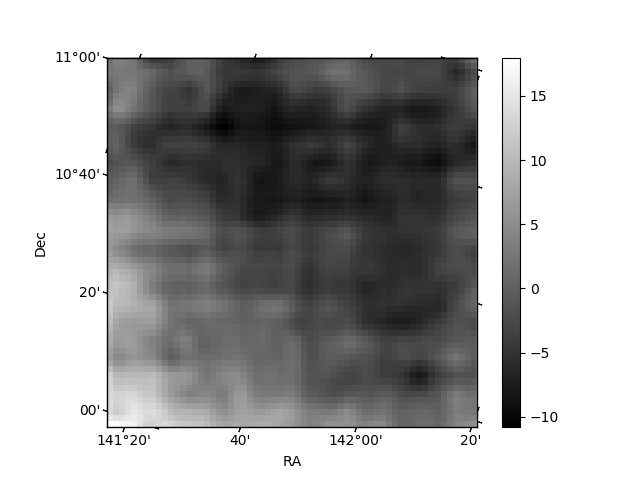
| Quadrant D | 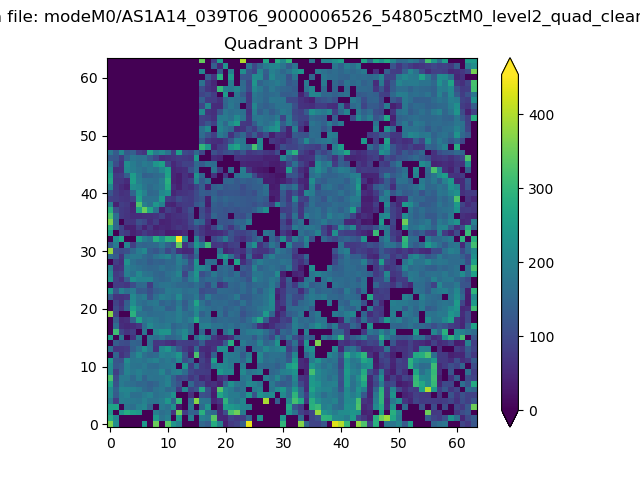 |
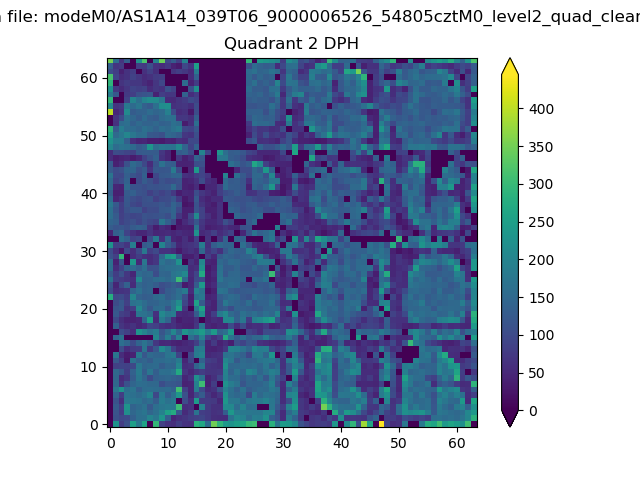 |
Quadrant C |
| Plot type | Count rate plots | Images |
|---|---|---|
| Comparison with Poisson distribution Blue bars denote a histogram of data divided into 1 sec bins. Red curve is a Poisson curve with rate = median count rate of data. |
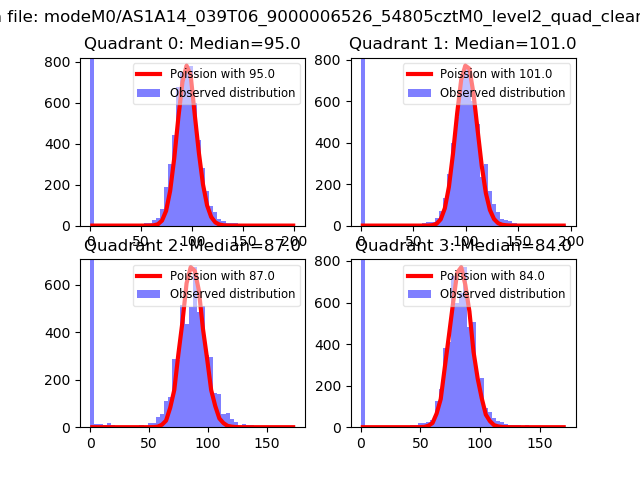 |
 |
| Quadrant-wise count rates Data is divided into 100 sec bins |
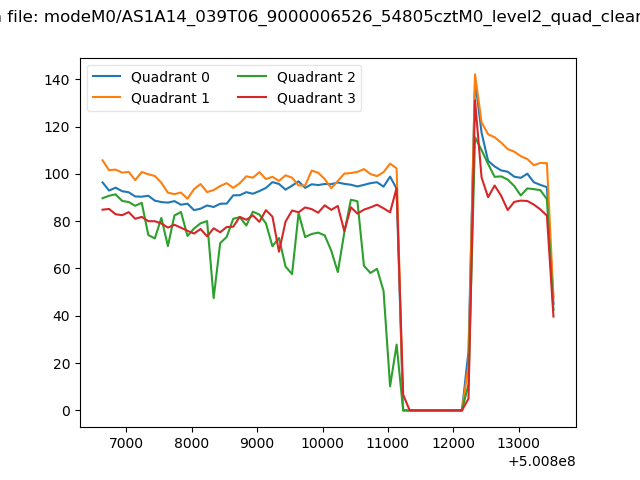 |
|
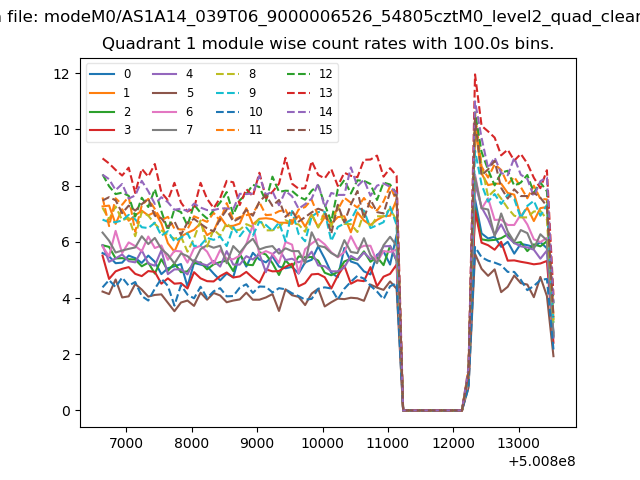
| Module-wise count rates for Quadrant A Data is divided into 100 sec bins |
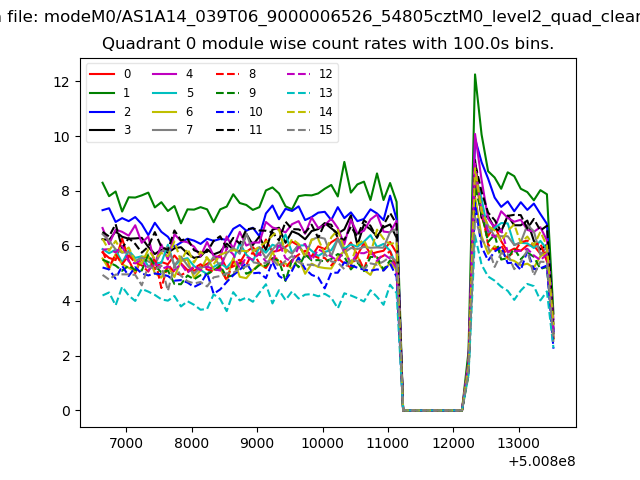 |
 |
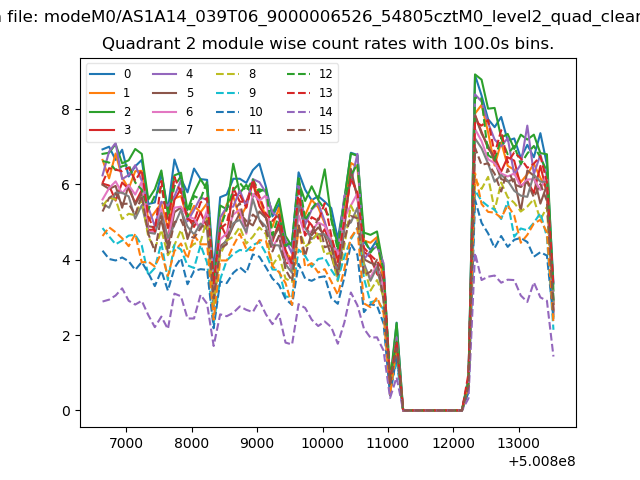
| Module-wise count rates for Quadrant B Data is divided into 100 sec bins |
 |
 |
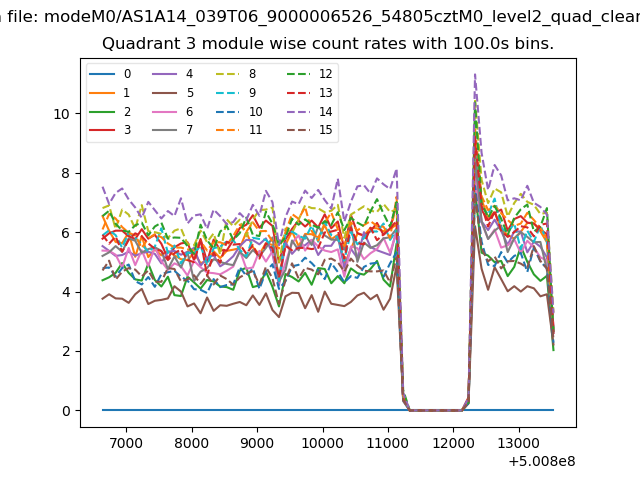
| Module-wise count rates for Quadrant C Data is divided into 100 sec bins |
 |
 |
| Module-wise count rates for Quadrant D Data is divided into 100 sec bins |
 |
 |
| Parameter | Plot |
|---|---|
| CZT HV Monitor | 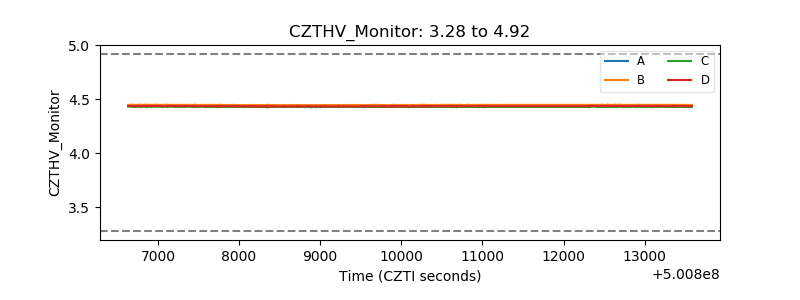 |
| D_VDD | 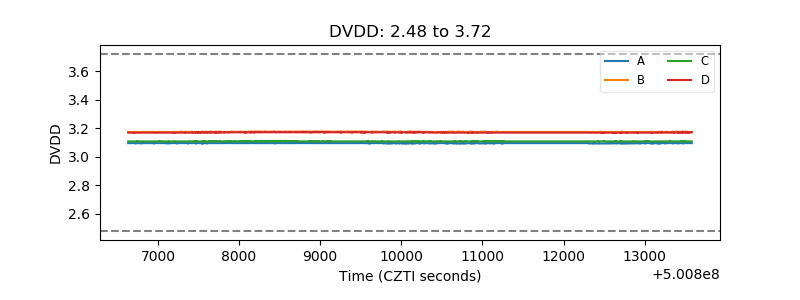 |
| Temperature 1 | 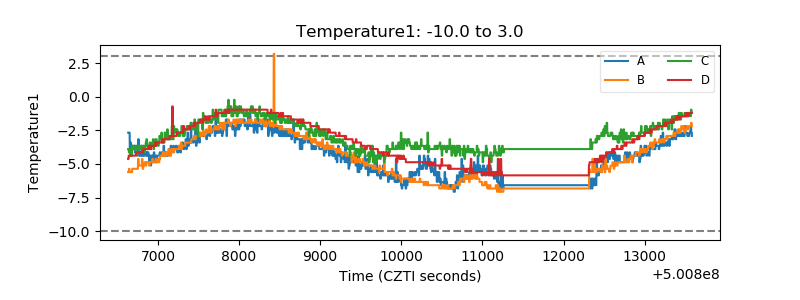 |
| Veto HV Monitor | 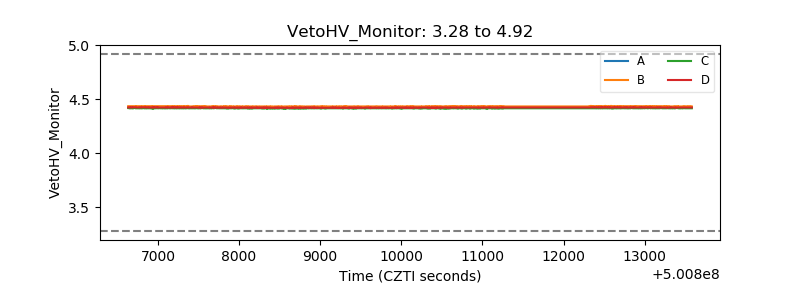 |
| Veto LLD | 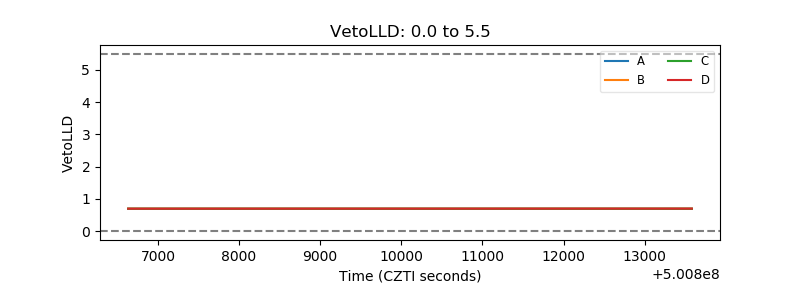 |
| Alpha Counter | 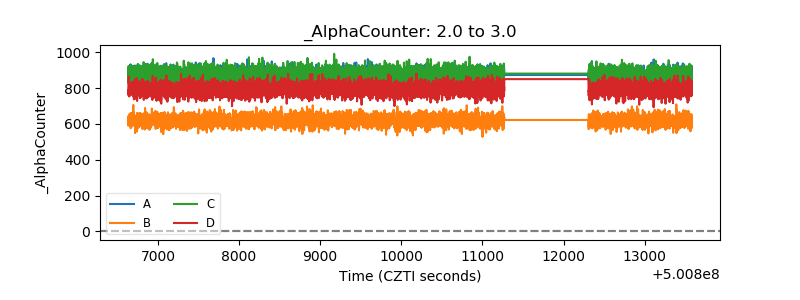 |
| _CPM_Rate | 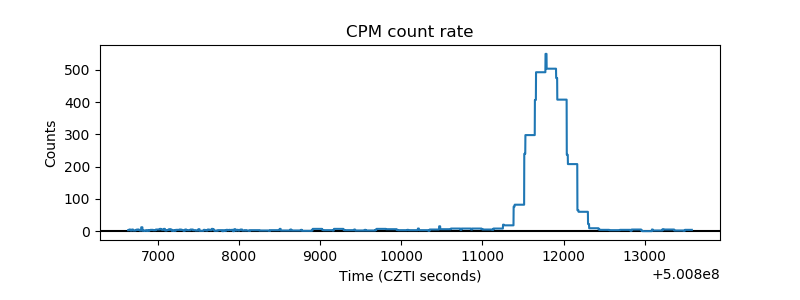 |
| CZT Counter | 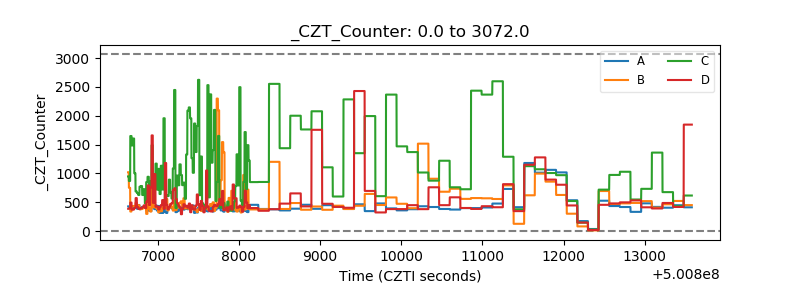 |
| +2.5 Volts monitor | 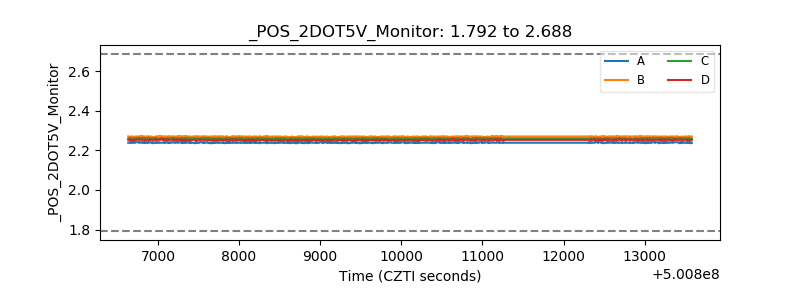 |
| +5 Volts monitor | 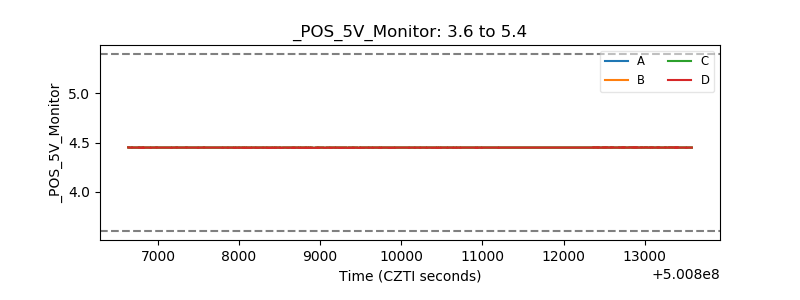 |
| _ROLL_ROT | 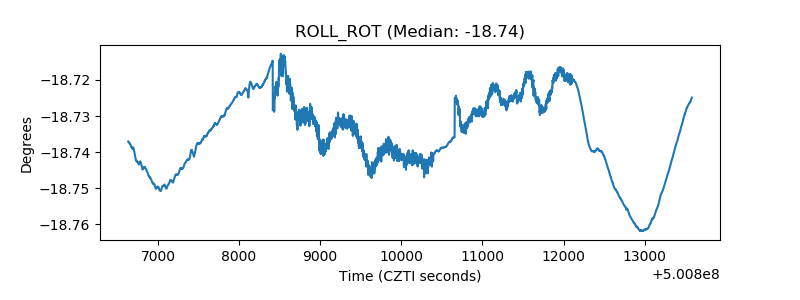 |
| _Roll_DEC | 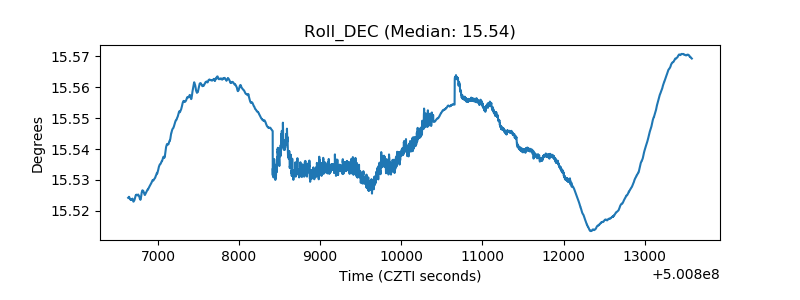 |
| _Roll_RA | 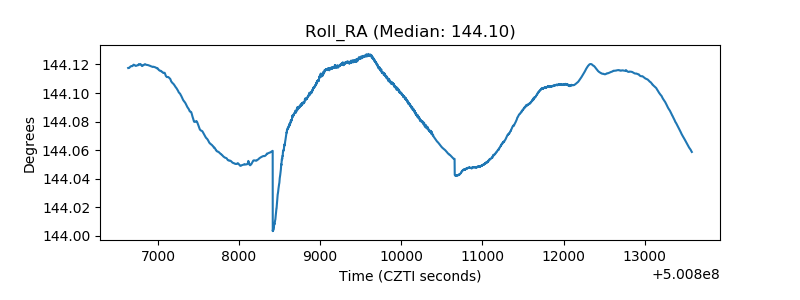 |
| Veto Counter | 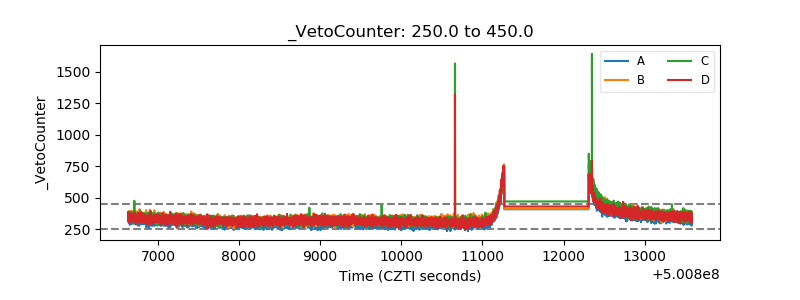 |