| Param | Original file | Final file |
|---|---|---|
| Filename | modeM0/AS1A14_039T06_9000006526_54806cztM0_level2.fits | modeM0/AS1A14_039T06_9000006526_54806cztM0_level2_quad_clean.evt |
| Size (bytes) | 387,714,240 | 92,632,320 |
| Size | 369.8 MB | 88.3 MB |
| Events in quadrant A | 2,698,474 | 607,352 |
| Events in quadrant B | 3,258,476 | 646,094 |
| Events in quadrant C | 3,848,710 | 577,422 |
| Events in quadrant D | 4,056,155 | 534,652 |
| Mode M9 | |||
|---|---|---|---|
| Quadrant | BADHDUFLAG | Total packets | Discarded packets |
| A | 0 | 11 | 0 |
| B | 0 | 11 | 0 |
| C | 0 | 11 | 0 |
| D | 0 | 11 | 0 |
| Mode M0 | |||
|---|---|---|---|
| Quadrant | BADHDUFLAG | Total packets | Discarded packets |
| A | 0 | 12899 | 1 |
| B | 0 | 14213 | 1 |
| C | 0 | 15781 | 1 |
| D | 0 | 16470 | 1 |
| Mode SS | |||
|---|---|---|---|
| Quadrant | BADHDUFLAG | Total packets | Discarded packets |
| A | 0 | 128 | 0 |
| B | 0 | 128 | 0 |
| C | 0 | 128 | 0 |
| D | 0 | 128 | 0 |
| Quadrant | Total seconds | Saturated seconds | Saturation percentage |
|---|---|---|---|
| A | 6296 | 90 | 1.429479% |
| B | 6296 | 175 | 2.779543% |
| C | 6296 | 128 | 2.033037% |
| D | 6296 | 226 | 3.589581% |
Noise dominated data is calculated using 1-second bins in cleaned event files. If a bin has >2000 counts, and if more than 50% of those come from <1% of pixels, then it is considered to be noise-dominated and hence unusable.
| Quadrant | # 1 sec bins | Bins with >0 counts | Bins with >2000 counts | High rate bins dominated by noise | Noise dominated (total time) | Noise dominated (detector-on time) | Marked lightcurve |
|---|---|---|---|---|---|---|---|
| A | 7381 | 6296 | 4 | 4 | 0.05% | 0.06% | 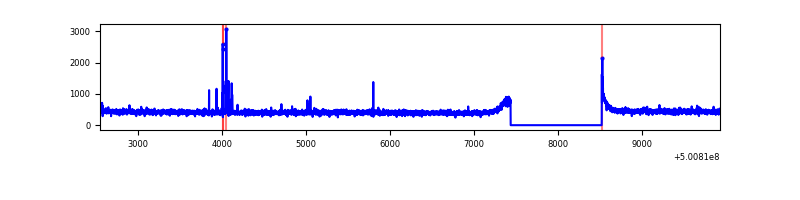 |
| B | 7381 | 6296 | 49 | 49 | 0.66% | 0.78% | 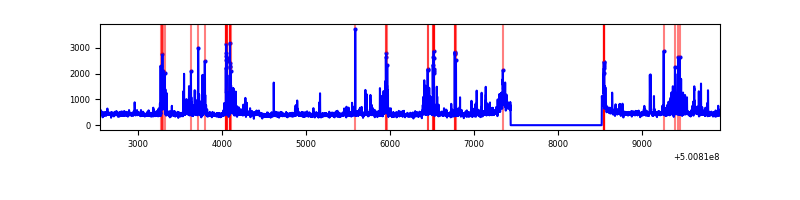 |
| C | 7381 | 6296 | 50 | 50 | 0.68% | 0.79% | 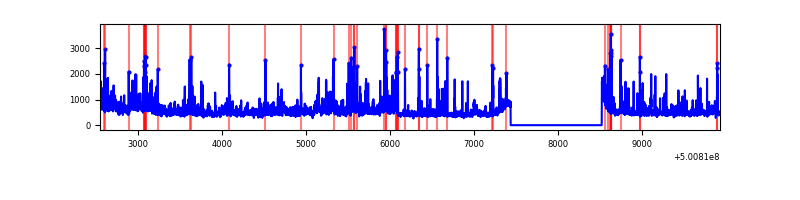 |
| D | 7381 | 6296 | 150 | 150 | 2.03% | 2.38% | 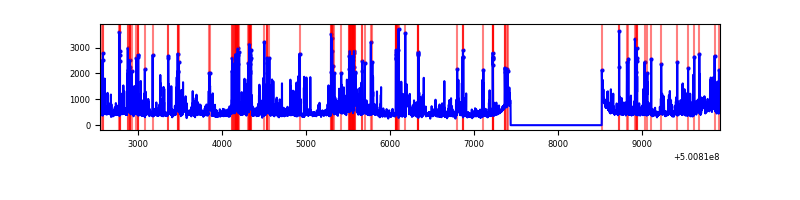 |
Top three noisy pixels from each quadrant. If the there are fewer than three noisy pixels in the level2.evt file, extra rows are filled as -1
| Pixel properties | Quadrant properties | ||||||
|---|---|---|---|---|---|---|---|
| Quadrant | DetID | PixID | Counts | Sigma | Mean | Median | Sigma |
| A | 5 | 240 | 27798 | 160.89 | 684 | 668 | 168.6 |
| A | 13 | 254 | 11860 | 66.37 | 684 | 668 | 168.6 |
| A | 3 | 14 | 9114 | 50.09 | 684 | 668 | 168.6 |
| B | 5 | 185 | 383116 | 2694.41 | 664 | 641 | 142.0 |
| B | 2 | 249 | 109917 | 769.81 | 664 | 641 | 142.0 |
| B | 6 | 255 | 40068 | 277.75 | 664 | 641 | 142.0 |
| C | 9 | 38 | 441068 | 2446.35 | 657 | 651 | 180.0 |
| C | 12 | 252 | 439928 | 2440.02 | 657 | 651 | 180.0 |
| C | 14 | 254 | 161040 | 890.9 | 657 | 651 | 180.0 |
| D | 3 | 12 | 329468 | 1801.97 | 651 | 622 | 182.5 |
| D | 10 | 181 | 265270 | 1450.18 | 651 | 622 | 182.5 |
| D | 2 | 249 | 238811 | 1305.2 | 651 | 622 | 182.5 |
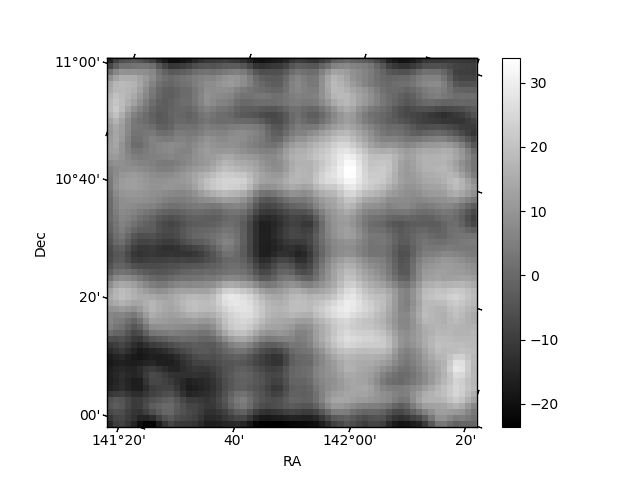
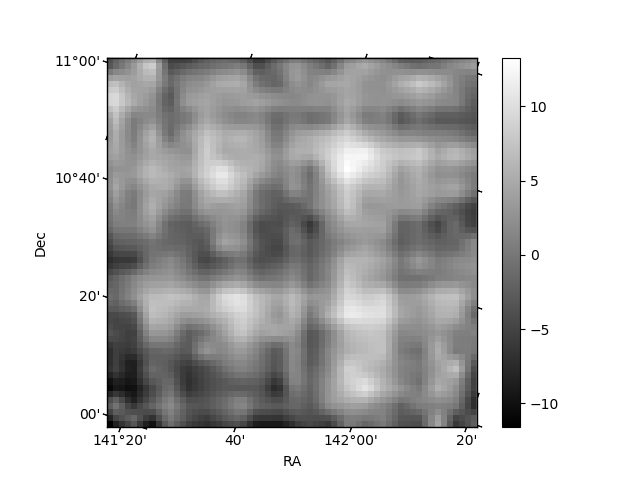
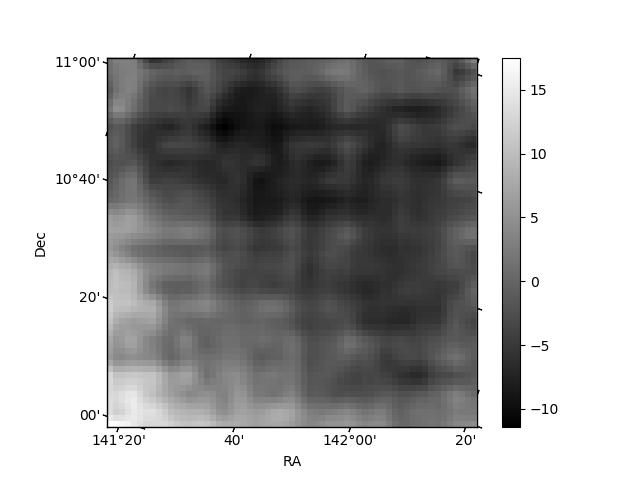
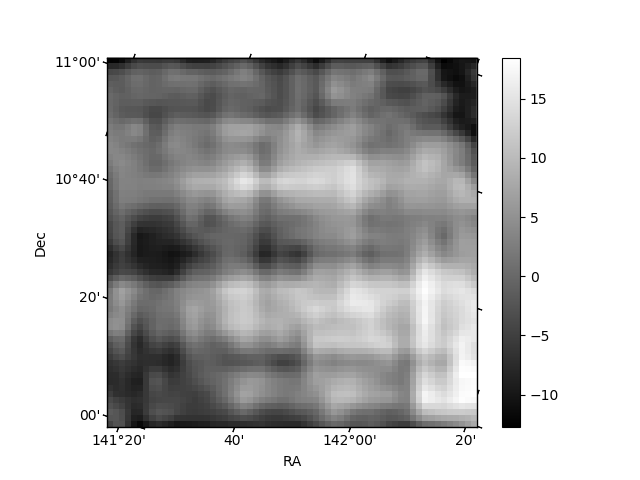
Histogram calculated using DETX and DETY for each event in the final _common_clean file
| Quadrant A | 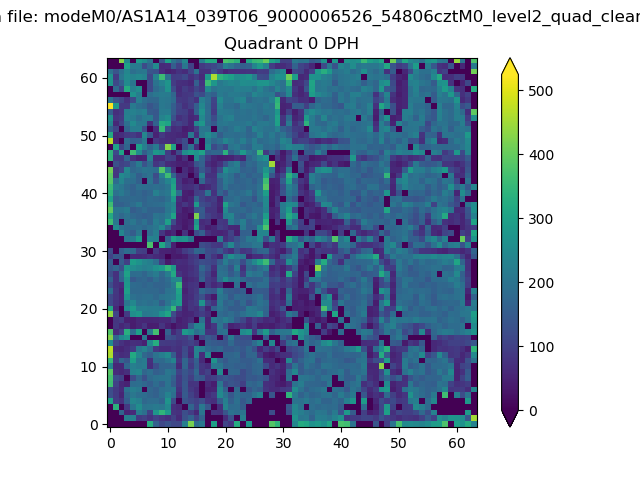 |
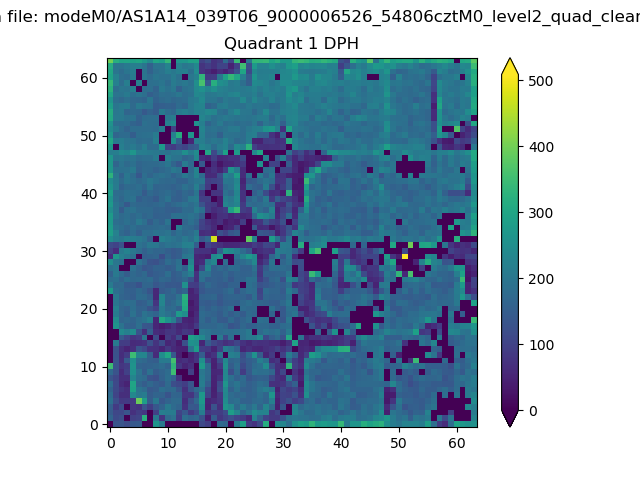 |
Quadrant B |
|---|---|---|---|
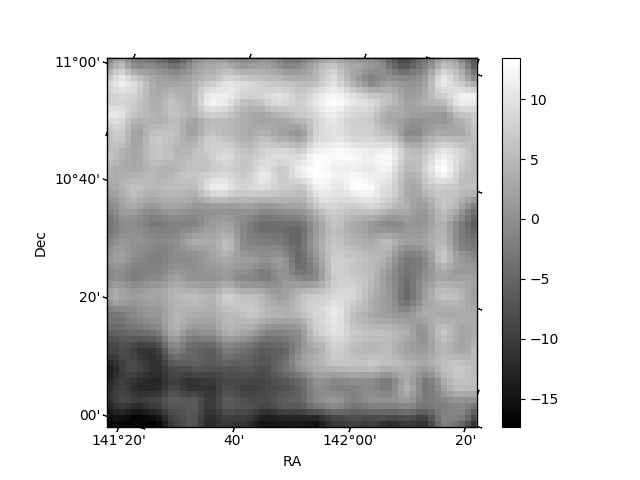
| Quadrant D | 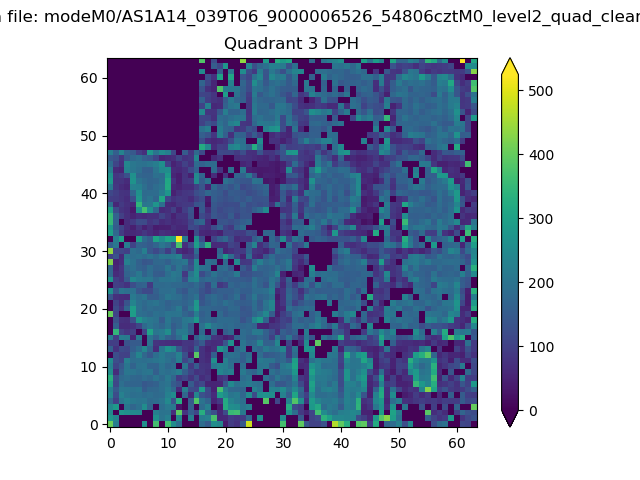 |
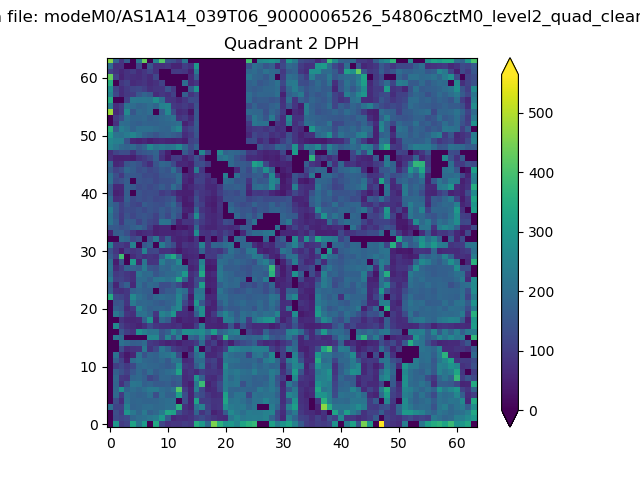 |
Quadrant C |
| Plot type | Count rate plots | Images |
|---|---|---|
| Comparison with Poisson distribution Blue bars denote a histogram of data divided into 1 sec bins. Red curve is a Poisson curve with rate = median count rate of data. |
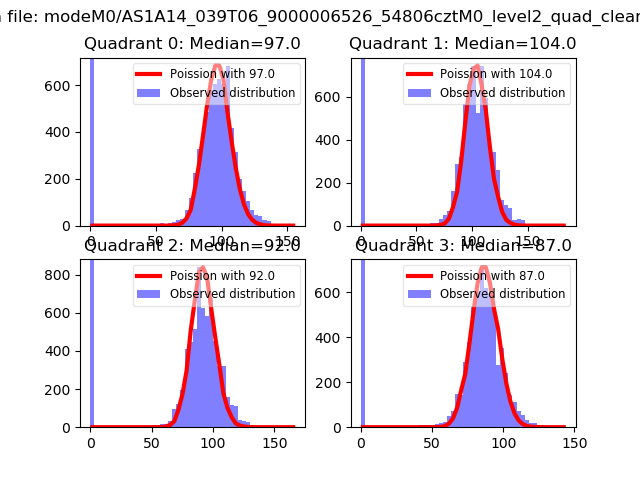 |
 |
| Quadrant-wise count rates Data is divided into 100 sec bins |
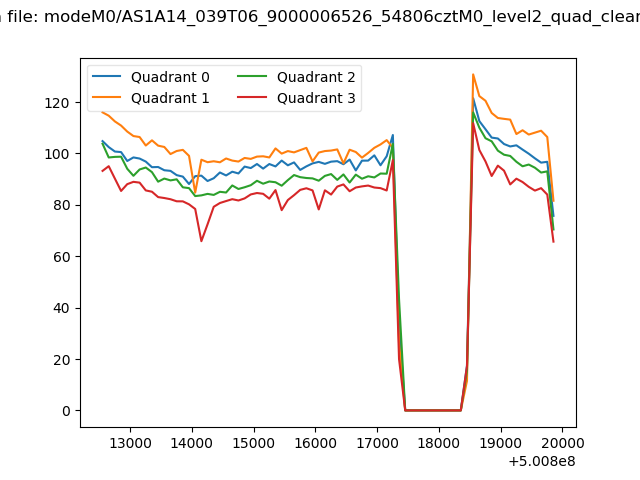 |
|
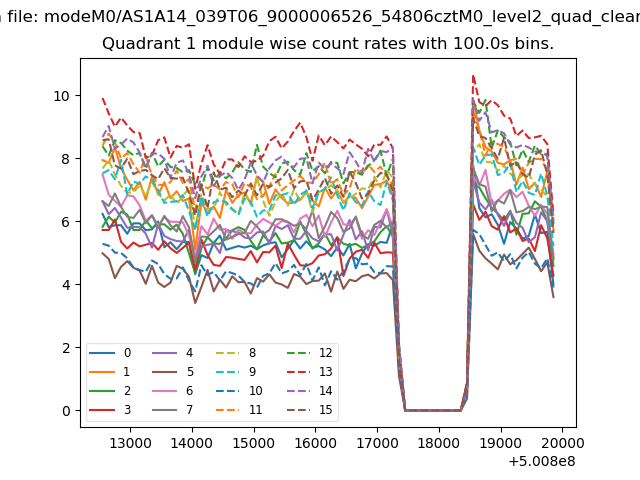
| Module-wise count rates for Quadrant A Data is divided into 100 sec bins |
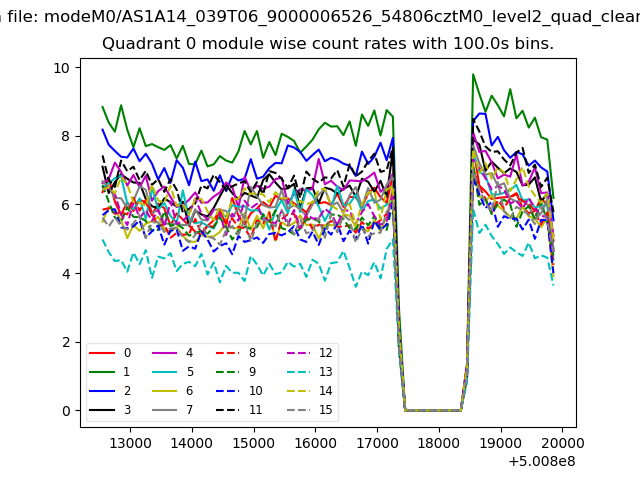 |
 |
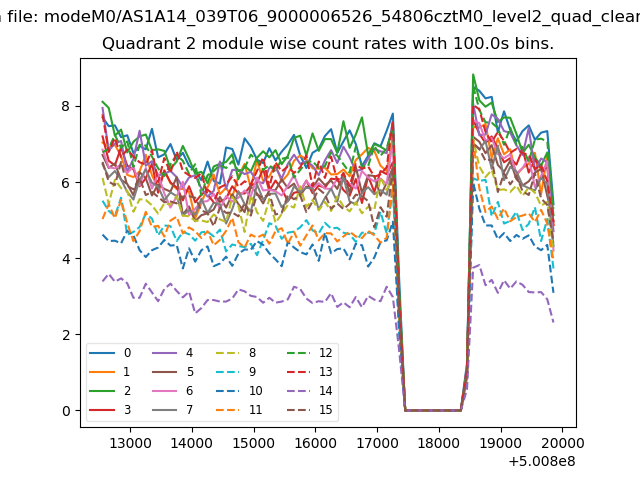
| Module-wise count rates for Quadrant B Data is divided into 100 sec bins |
 |
 |
| Module-wise count rates for Quadrant C Data is divided into 100 sec bins |
 |
 |
| Module-wise count rates for Quadrant D Data is divided into 100 sec bins |
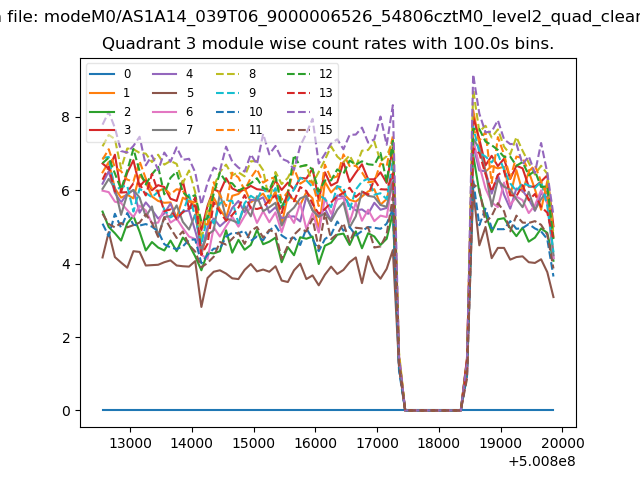 |
 |
| Parameter | Plot |
|---|---|
| CZT HV Monitor | 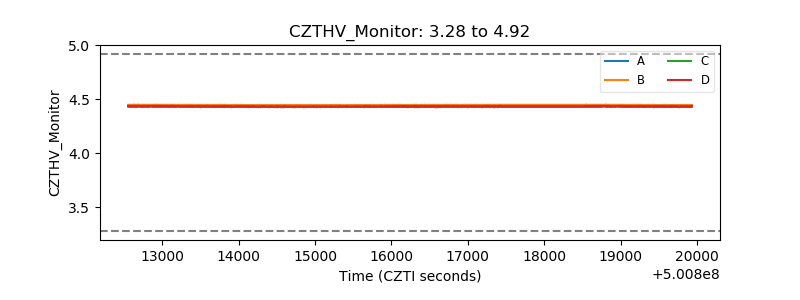 |
| D_VDD | 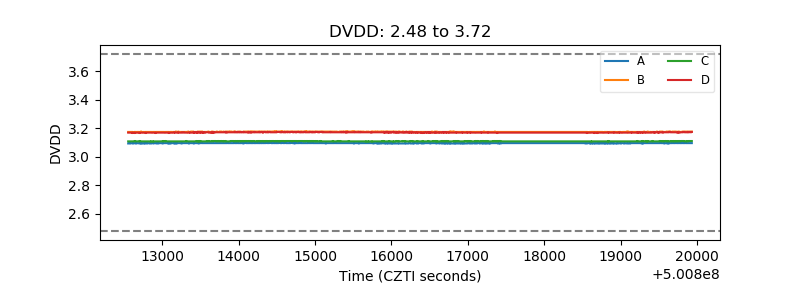 |
| Temperature 1 | 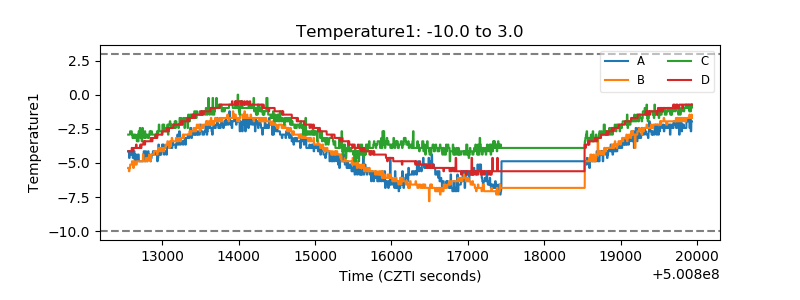 |
| Veto HV Monitor | 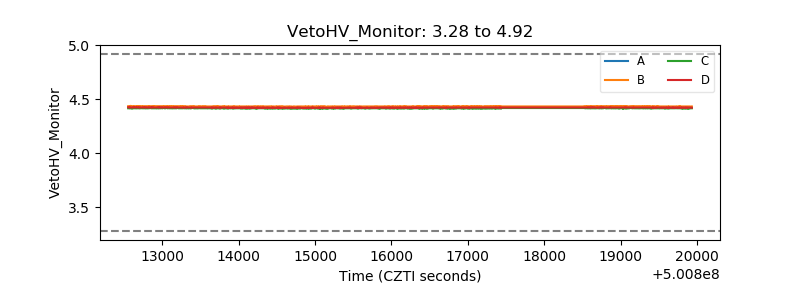 |
| Veto LLD | 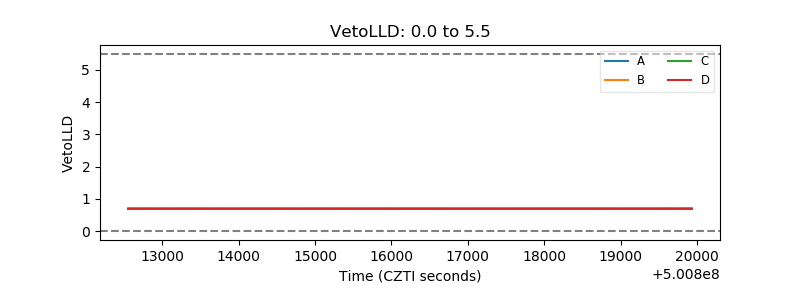 |
| Alpha Counter | 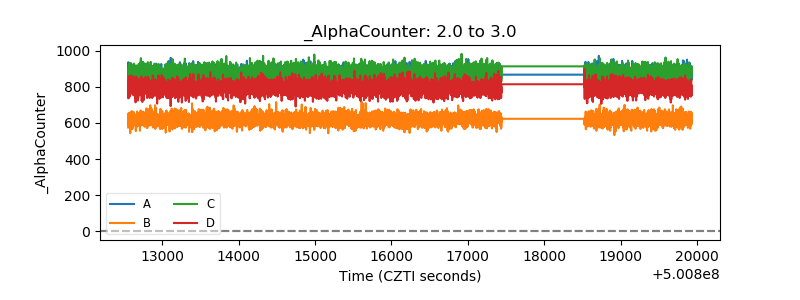 |
| _CPM_Rate | 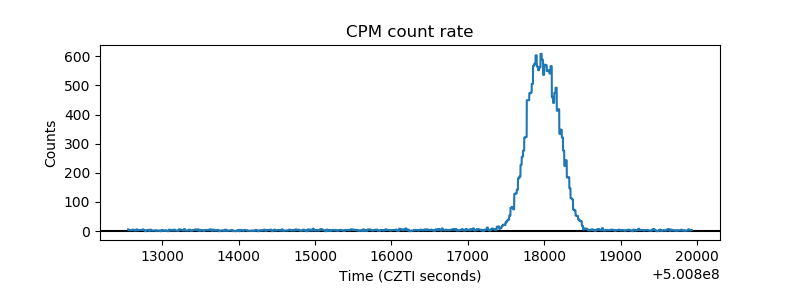 |
| CZT Counter | 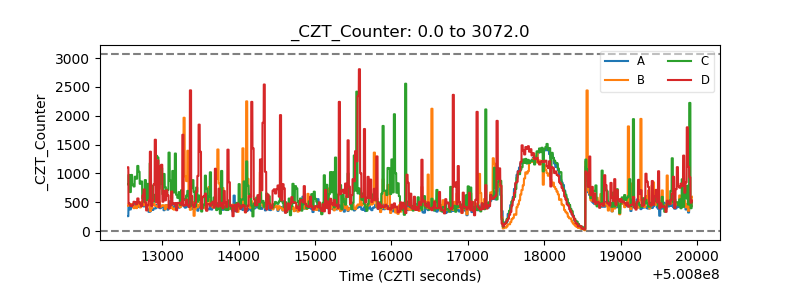 |
| +2.5 Volts monitor |  |
| +5 Volts monitor |  |
| _ROLL_ROT | 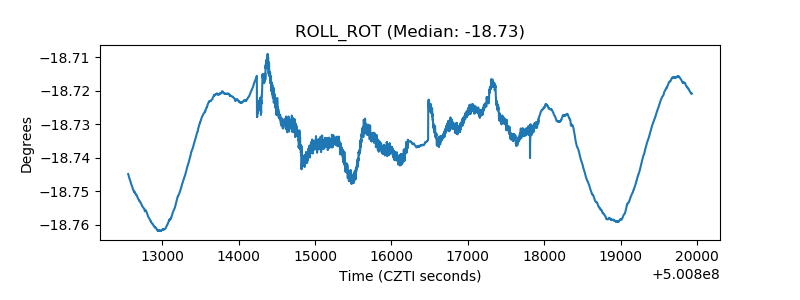 |
| _Roll_DEC | 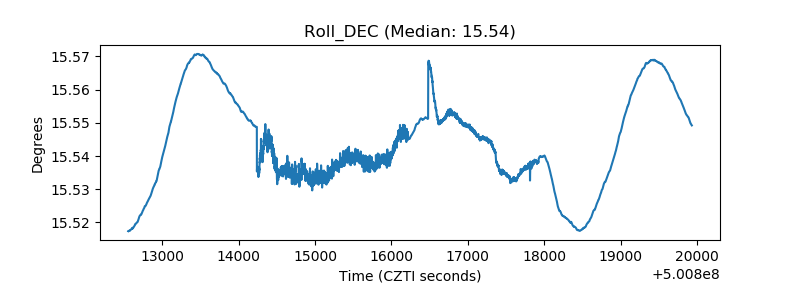 |
| _Roll_RA | 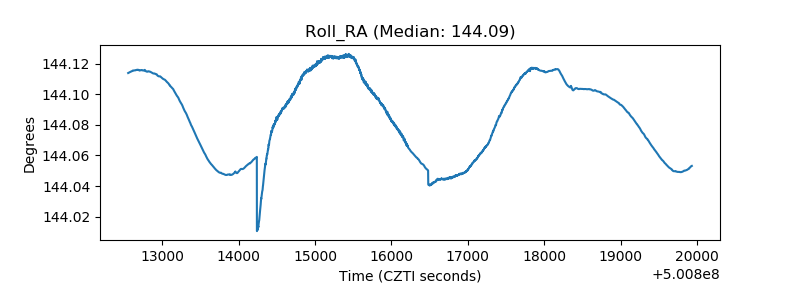 |
| Veto Counter | 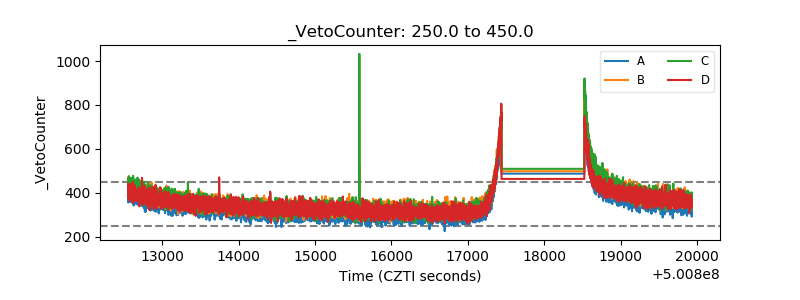 |