| Param | Original file | Final file |
|---|---|---|
| Filename | modeM0/AS1A14_039T06_9000006526_54807cztM0_level2.fits | modeM0/AS1A14_039T06_9000006526_54807cztM0_level2_quad_clean.evt |
| Size (bytes) | 442,730,880 | 99,299,520 |
| Size | 422.2 MB | 94.7 MB |
| Events in quadrant A | 3,004,065 | 663,336 |
| Events in quadrant B | 3,519,860 | 702,019 |
| Events in quadrant C | 5,083,743 | 588,300 |
| Events in quadrant D | 4,257,303 | 584,444 |
| Mode M9 | |||
|---|---|---|---|
| Quadrant | BADHDUFLAG | Total packets | Discarded packets |
| A | 0 | 15 | 0 |
| B | 0 | 15 | 0 |
| C | 0 | 16 | 0 |
| D | 0 | 16 | 0 |
| Mode M0 | |||
|---|---|---|---|
| Quadrant | BADHDUFLAG | Total packets | Discarded packets |
| A | 0 | 14028 | 2 |
| B | 0 | 15364 | 2 |
| C | 0 | 19827 | 2 |
| D | 0 | 17392 | 2 |
| Mode SS | |||
|---|---|---|---|
| Quadrant | BADHDUFLAG | Total packets | Discarded packets |
| A | 0 | 136 | 0 |
| B | 0 | 136 | 0 |
| C | 0 | 136 | 0 |
| D | 0 | 136 | 0 |
| Quadrant | Total seconds | Saturated seconds | Saturation percentage |
|---|---|---|---|
| A | 6728 | 106 | 1.575505% |
| B | 6728 | 192 | 2.853746% |
| C | 6728 | 640 | 9.512485% |
| D | 6728 | 229 | 3.403686% |
Noise dominated data is calculated using 1-second bins in cleaned event files. If a bin has >2000 counts, and if more than 50% of those come from <1% of pixels, then it is considered to be noise-dominated and hence unusable.
| Quadrant | # 1 sec bins | Bins with >0 counts | Bins with >2000 counts | High rate bins dominated by noise | Noise dominated (total time) | Noise dominated (detector-on time) | Marked lightcurve |
|---|---|---|---|---|---|---|---|
| A | 7833 | 6728 | 10 | 10 | 0.13% | 0.15% | 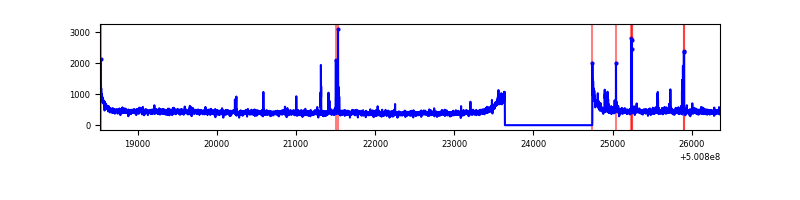 |
| B | 7833 | 6728 | 66 | 66 | 0.84% | 0.98% | 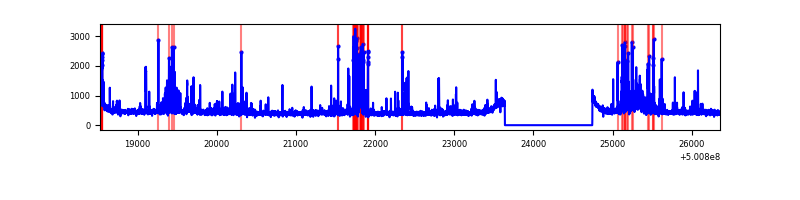 |
| C | 7833 | 6728 | 510 | 510 | 6.51% | 7.58% | 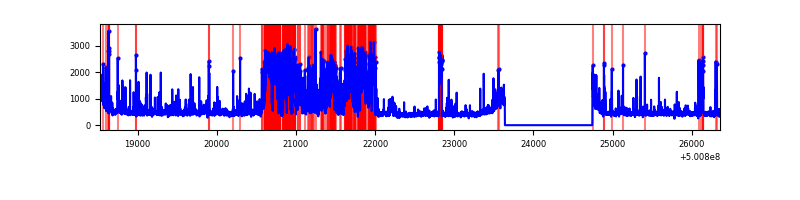 |
| D | 7833 | 6728 | 158 | 158 | 2.02% | 2.35% | 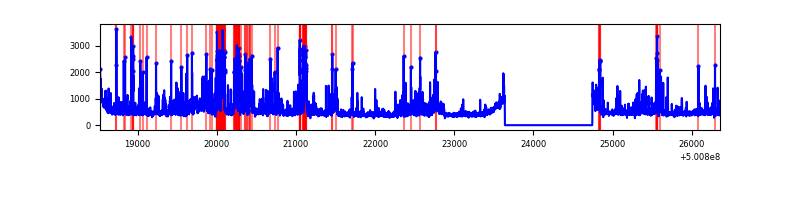 |
Top three noisy pixels from each quadrant. If the there are fewer than three noisy pixels in the level2.evt file, extra rows are filled as -1
| Pixel properties | Quadrant properties | ||||||
|---|---|---|---|---|---|---|---|
| Quadrant | DetID | PixID | Counts | Sigma | Mean | Median | Sigma |
| A | 8 | 6 | 38721 | 206.6 | 746 | 727 | 183.9 |
| A | 3 | 94 | 31850 | 169.24 | 746 | 727 | 183.9 |
| A | 5 | 240 | 13104 | 67.3 | 746 | 727 | 183.9 |
| B | 5 | 185 | 475366 | 3035.07 | 727 | 702 | 156.4 |
| B | 6 | 255 | 64718 | 409.33 | 727 | 702 | 156.4 |
| B | 10 | 247 | 50132 | 316.06 | 727 | 702 | 156.4 |
| C | 9 | 38 | 1769668 | 9161.89 | 704 | 698 | 193.1 |
| C | 12 | 252 | 234573 | 1211.29 | 704 | 698 | 193.1 |
| C | 6 | 223 | 118492 | 610.08 | 704 | 698 | 193.1 |
| D | 8 | 160 | 749808 | 3654.83 | 722 | 690 | 205.0 |
| D | 15 | 109 | 130000 | 630.88 | 722 | 690 | 205.0 |
| D | 10 | 181 | 116129 | 563.21 | 722 | 690 | 205.0 |
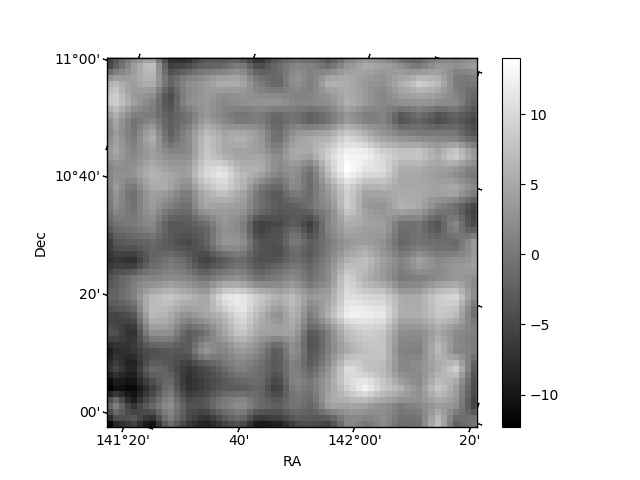
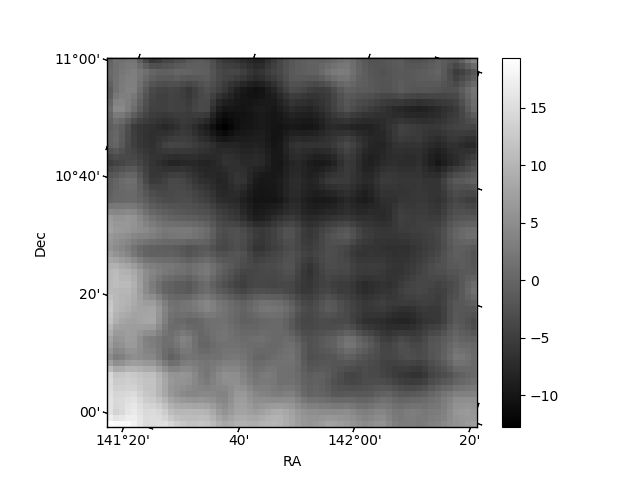
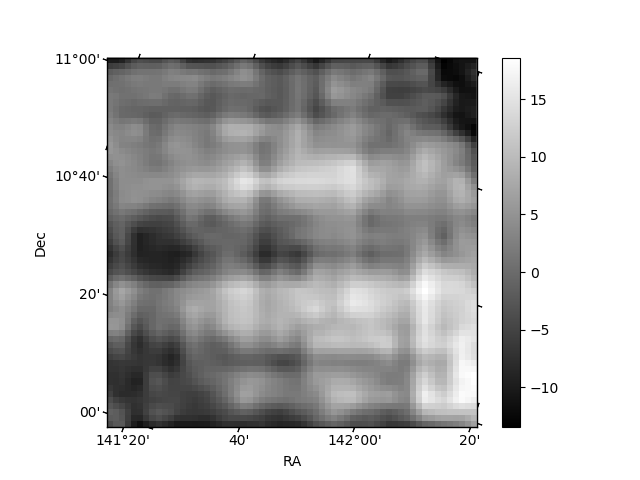
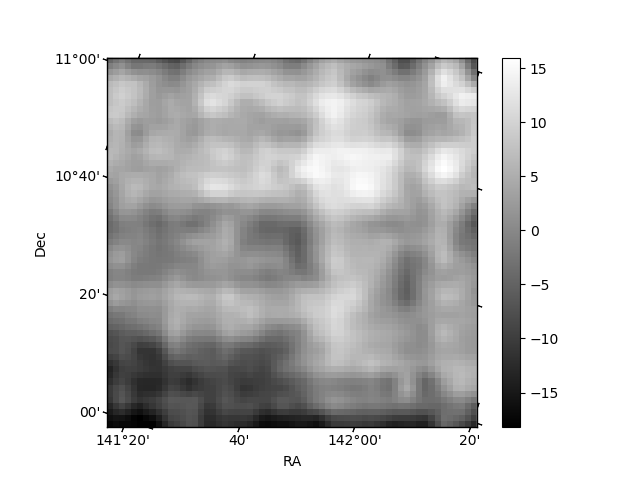
Histogram calculated using DETX and DETY for each event in the final _common_clean file
| Quadrant A | 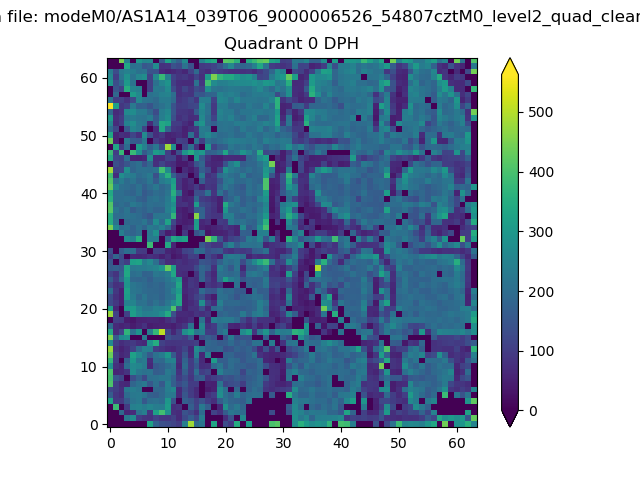 |
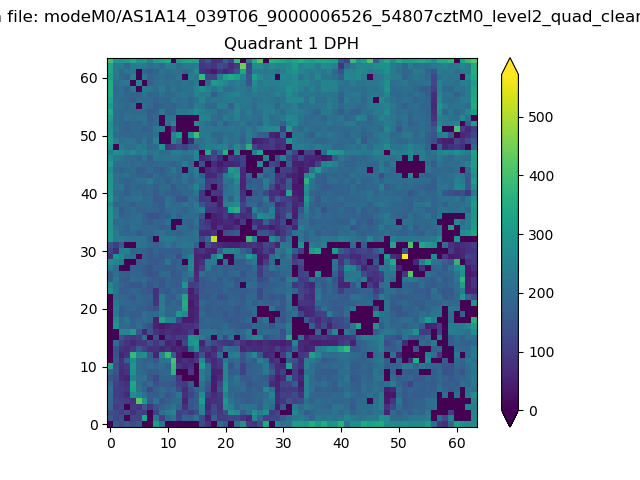 |
Quadrant B |
|---|---|---|---|
| Quadrant D | 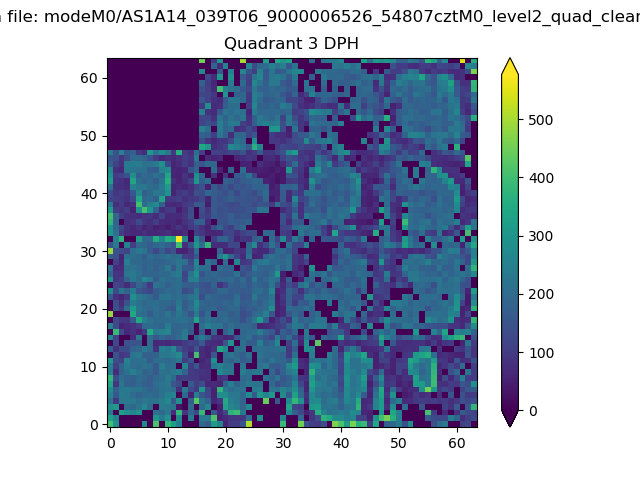 |
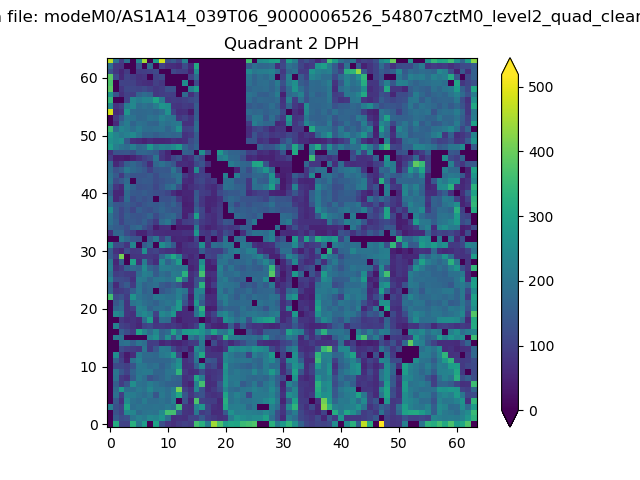 |
Quadrant C |
| Plot type | Count rate plots | Images |
|---|---|---|
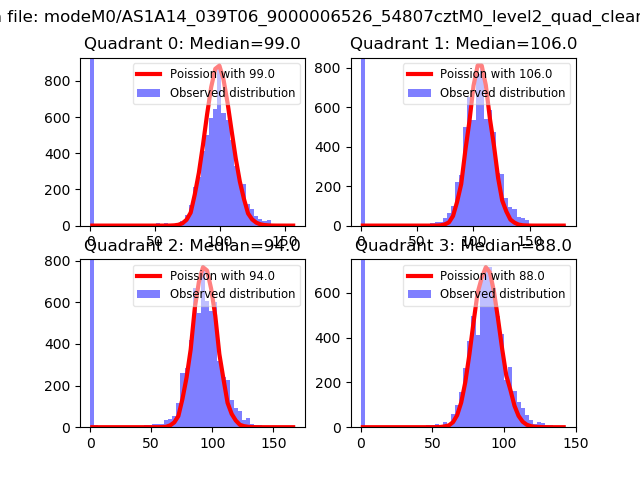
| Comparison with Poisson distribution Blue bars denote a histogram of data divided into 1 sec bins. Red curve is a Poisson curve with rate = median count rate of data. |
 |
 |
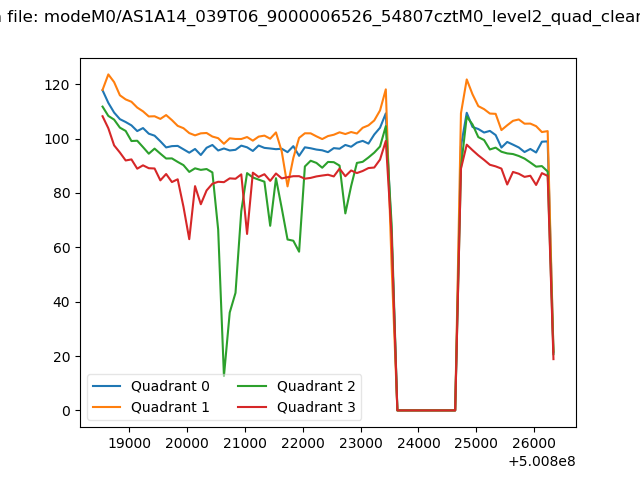
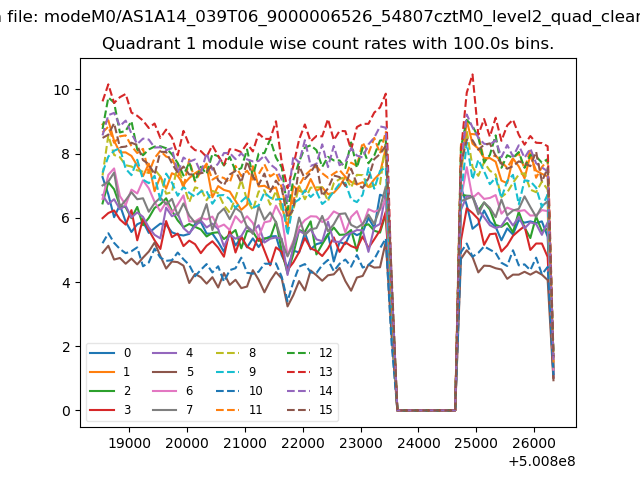
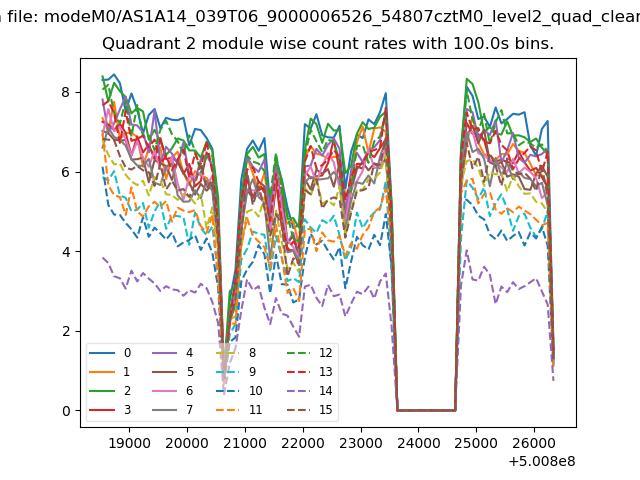
| Quadrant-wise count rates Data is divided into 100 sec bins |
 |
|
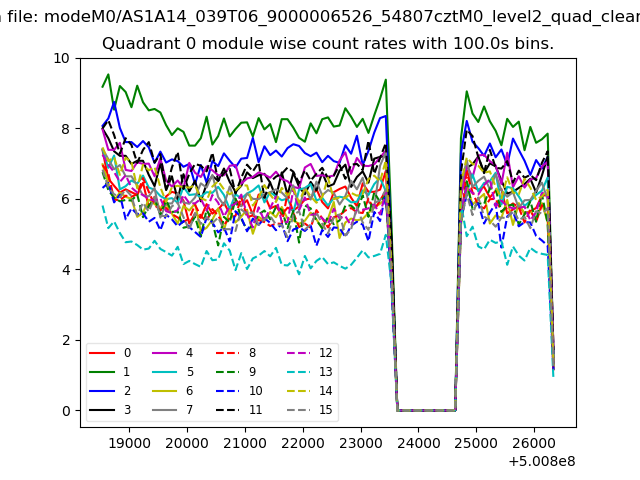
| Module-wise count rates for Quadrant A Data is divided into 100 sec bins |
 |
 |
| Module-wise count rates for Quadrant B Data is divided into 100 sec bins |
 |
 |
| Module-wise count rates for Quadrant C Data is divided into 100 sec bins |
 |
 |
| Module-wise count rates for Quadrant D Data is divided into 100 sec bins |
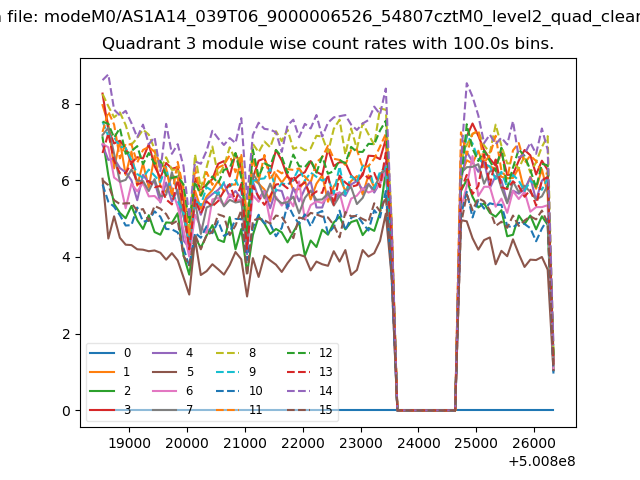 |
 |
| Parameter | Plot |
|---|---|
| CZT HV Monitor | 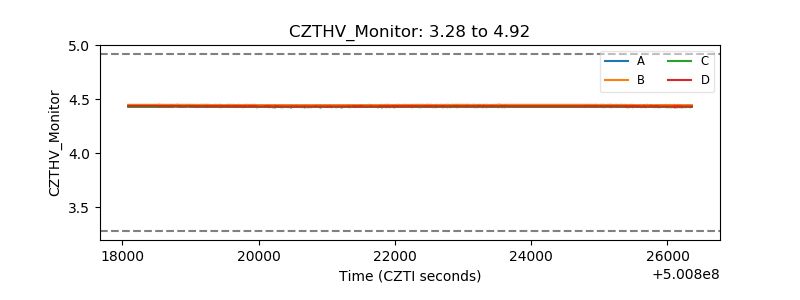 |
| D_VDD | 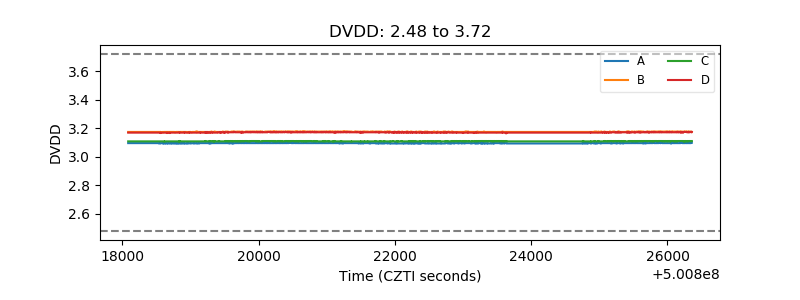 |
| Temperature 1 | 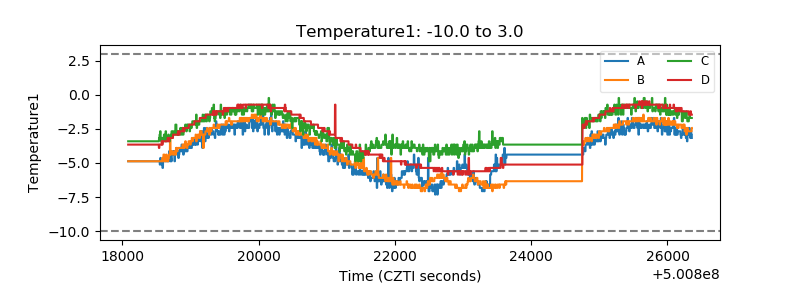 |
| Veto HV Monitor | 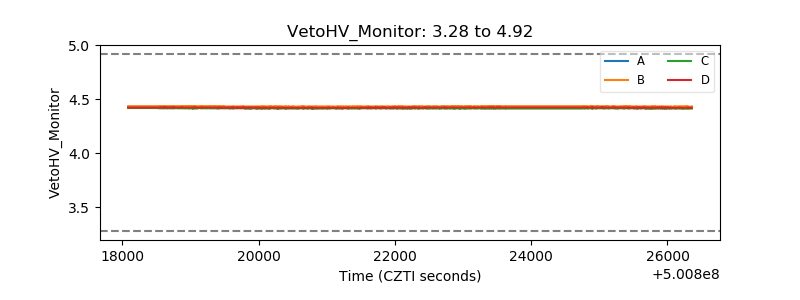 |
| Veto LLD | 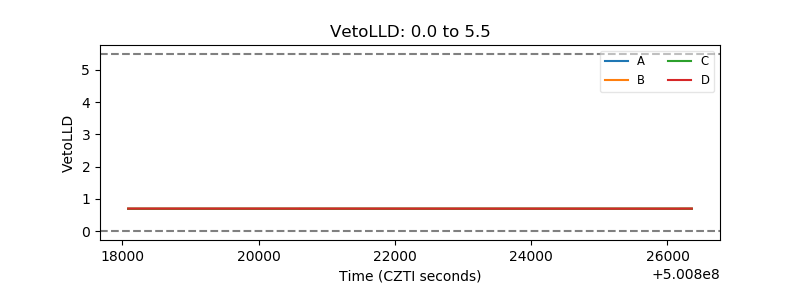 |
| Alpha Counter | 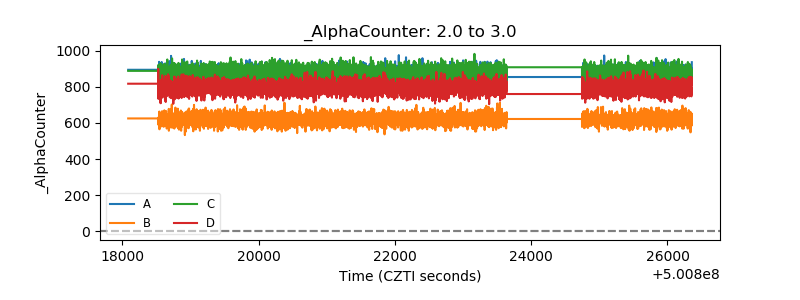 |
| _CPM_Rate | 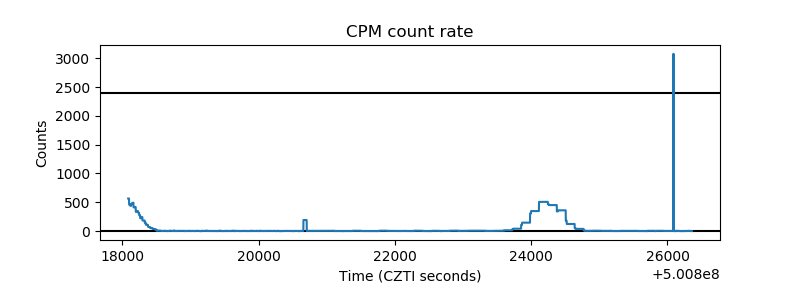 |
| CZT Counter | 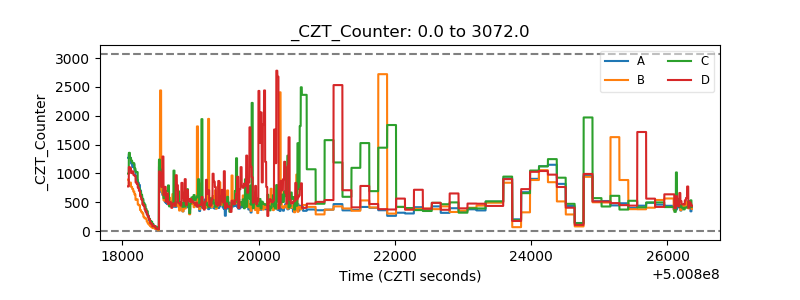 |
| +2.5 Volts monitor | 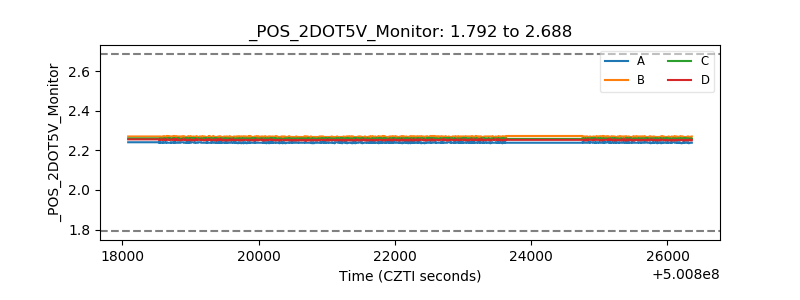 |
| +5 Volts monitor | 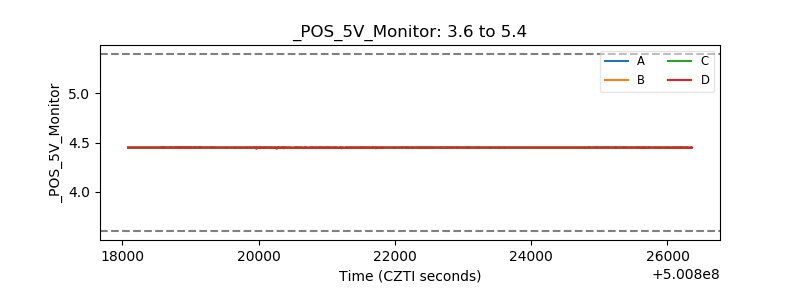 |
| _ROLL_ROT | 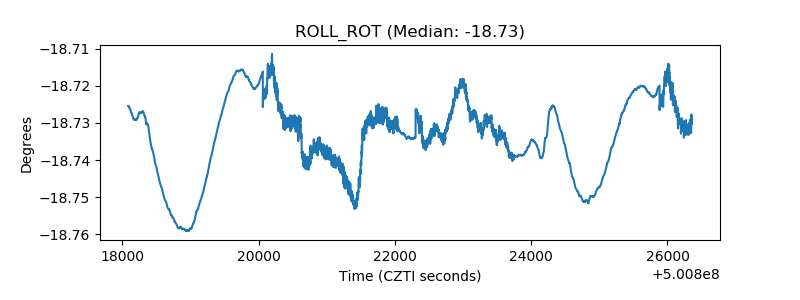 |
| _Roll_DEC | 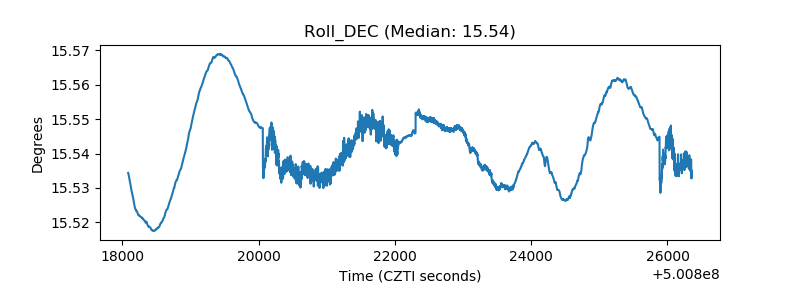 |
| _Roll_RA | 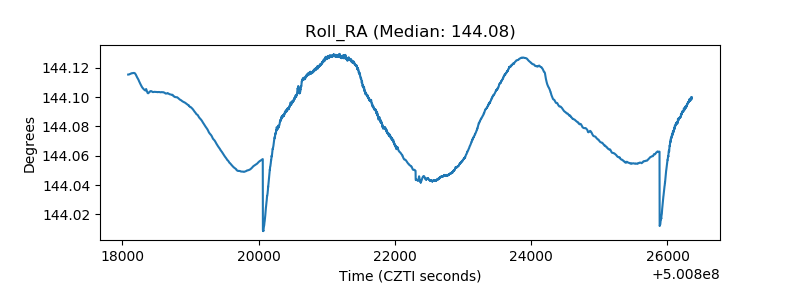 |
| Veto Counter | 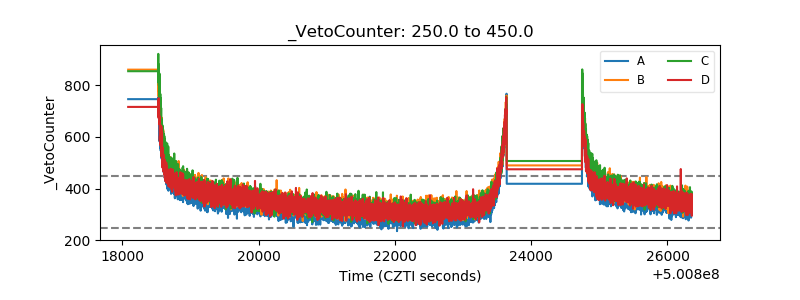 |