| Param | Original file | Final file |
|---|---|---|
| Filename | modeM0/AS1A14_039T06_9000006526_54808cztM0_level2.fits | modeM0/AS1A14_039T06_9000006526_54808cztM0_level2_quad_clean.evt |
| Size (bytes) | 401,823,360 | 99,872,640 |
| Size | 383.2 MB | 95.2 MB |
| Events in quadrant A | 2,988,829 | 658,772 |
| Events in quadrant B | 3,832,877 | 693,016 |
| Events in quadrant C | 3,492,593 | 616,522 |
| Events in quadrant D | 4,032,459 | 583,742 |
| Mode M9 | |||
|---|---|---|---|
| Quadrant | BADHDUFLAG | Total packets | Discarded packets |
| A | 0 | 12 | 0 |
| B | 0 | 13 | 0 |
| C | 0 | 13 | 0 |
| D | 0 | 13 | 0 |
| Mode M0 | |||
|---|---|---|---|
| Quadrant | BADHDUFLAG | Total packets | Discarded packets |
| A | 0 | 14083 | 2 |
| B | 0 | 16372 | 2 |
| C | 0 | 15463 | 2 |
| D | 0 | 16863 | 5 |
| Mode SS | |||
|---|---|---|---|
| Quadrant | BADHDUFLAG | Total packets | Discarded packets |
| A | 0 | 138 | 0 |
| B | 0 | 138 | 0 |
| C | 0 | 138 | 0 |
| D | 0 | 138 | 0 |
| Quadrant | Total seconds | Saturated seconds | Saturation percentage |
|---|---|---|---|
| A | 6773 | 74 | 1.092573% |
| B | 6773 | 227 | 3.351543% |
| C | 6773 | 158 | 2.332792% |
| D | 6772 | 180 | 2.658004% |
Noise dominated data is calculated using 1-second bins in cleaned event files. If a bin has >2000 counts, and if more than 50% of those come from <1% of pixels, then it is considered to be noise-dominated and hence unusable.
| Quadrant | # 1 sec bins | Bins with >0 counts | Bins with >2000 counts | High rate bins dominated by noise | Noise dominated (total time) | Noise dominated (detector-on time) | Marked lightcurve |
|---|---|---|---|---|---|---|---|
| A | 7873 | 6773 | 14 | 14 | 0.18% | 0.21% | 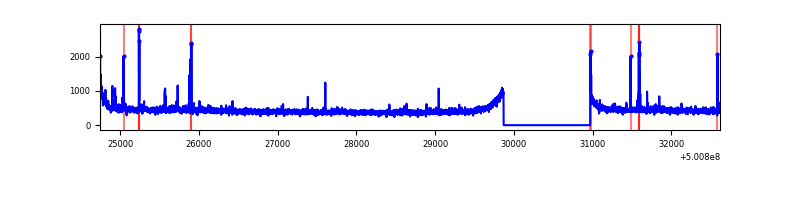 |
| B | 7873 | 6773 | 126 | 126 | 1.60% | 1.86% | 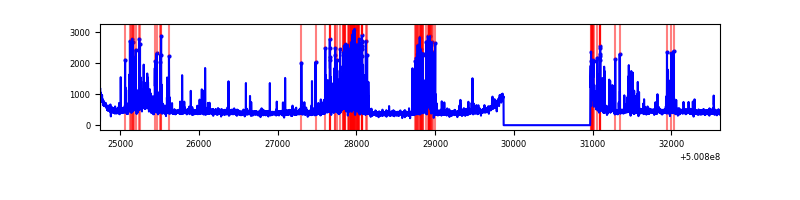 |
| C | 7873 | 6773 | 73 | 73 | 0.93% | 1.08% | 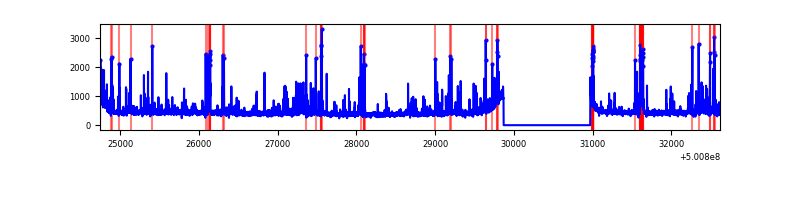 |
| D | 7872 | 6772 | 161 | 161 | 2.05% | 2.38% | 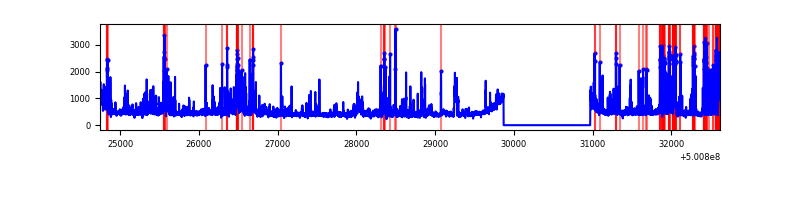 |
Top three noisy pixels from each quadrant. If the there are fewer than three noisy pixels in the level2.evt file, extra rows are filled as -1
| Pixel properties | Quadrant properties | ||||||
|---|---|---|---|---|---|---|---|
| Quadrant | DetID | PixID | Counts | Sigma | Mean | Median | Sigma |
| A | 8 | 6 | 33232 | 177.23 | 740 | 721 | 183.4 |
| A | 5 | 240 | 27787 | 147.55 | 740 | 721 | 183.4 |
| A | 3 | 14 | 18034 | 94.38 | 740 | 721 | 183.4 |
| B | 5 | 185 | 808376 | 5161.61 | 722 | 697 | 156.5 |
| B | 10 | 247 | 66330 | 419.44 | 722 | 697 | 156.5 |
| B | 6 | 255 | 62910 | 397.58 | 722 | 697 | 156.5 |
| C | 12 | 252 | 232082 | 1191.9 | 711 | 707 | 194.1 |
| C | 4 | 5 | 162760 | 834.79 | 711 | 707 | 194.1 |
| C | 14 | 254 | 152424 | 781.55 | 711 | 707 | 194.1 |
| D | 15 | 94 | 396105 | 1947.65 | 714 | 685 | 203.0 |
| D | 8 | 160 | 263912 | 1296.53 | 714 | 685 | 203.0 |
| D | 2 | 249 | 141937 | 695.74 | 714 | 685 | 203.0 |
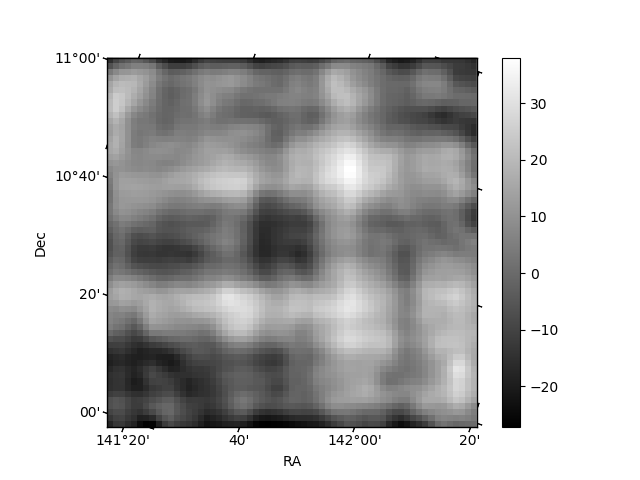
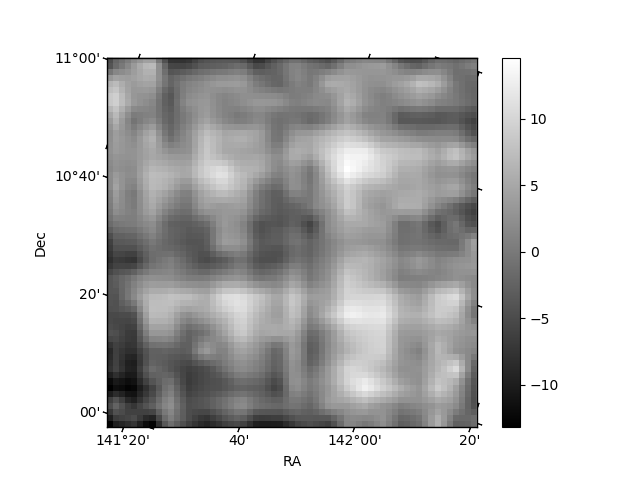
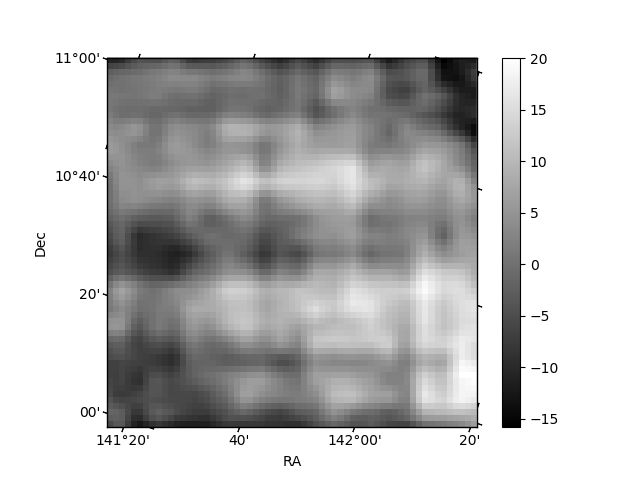
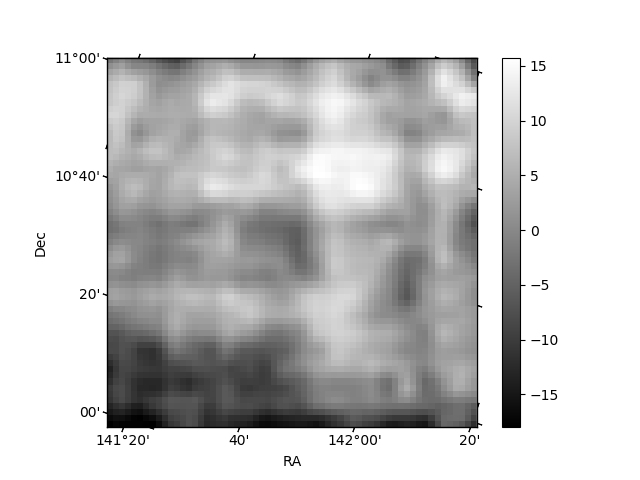
Histogram calculated using DETX and DETY for each event in the final _common_clean file
| Quadrant A | 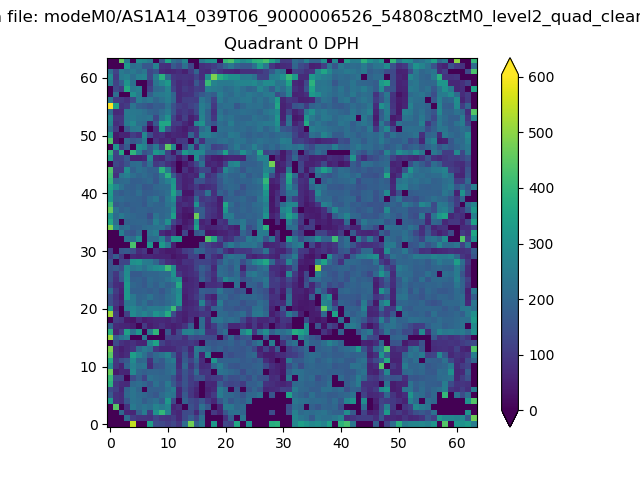 |
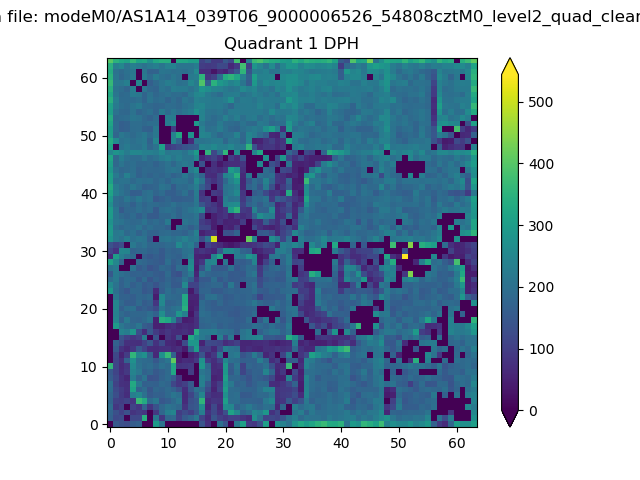 |
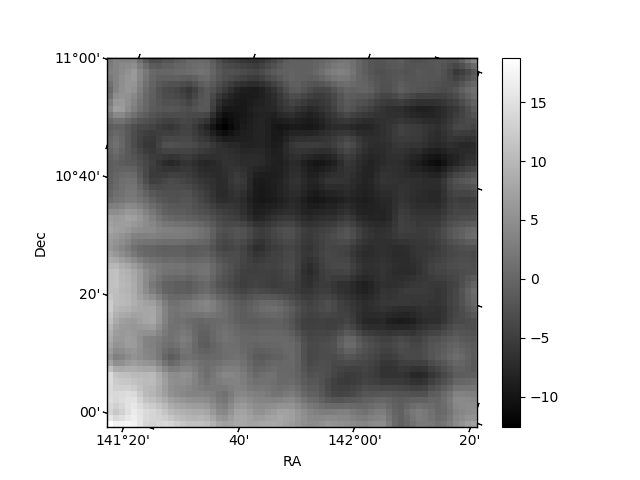
Quadrant B |
|---|---|---|---|
| Quadrant D | 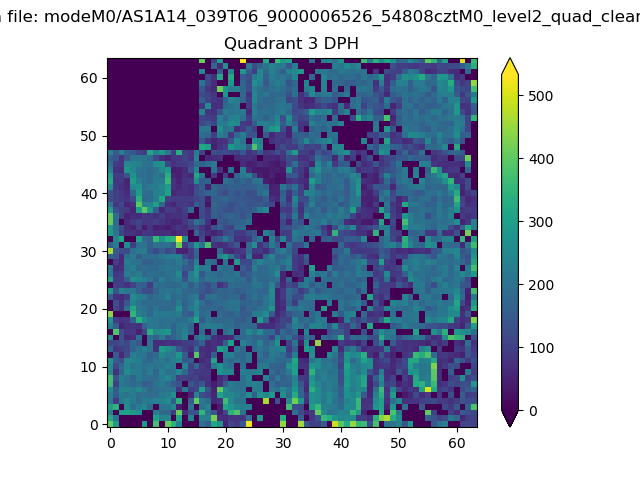 |
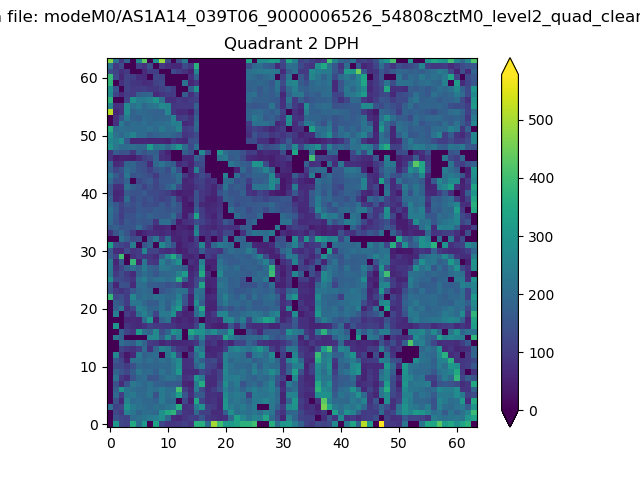 |
Quadrant C |
| Plot type | Count rate plots | Images |
|---|---|---|
| Comparison with Poisson distribution Blue bars denote a histogram of data divided into 1 sec bins. Red curve is a Poisson curve with rate = median count rate of data. |
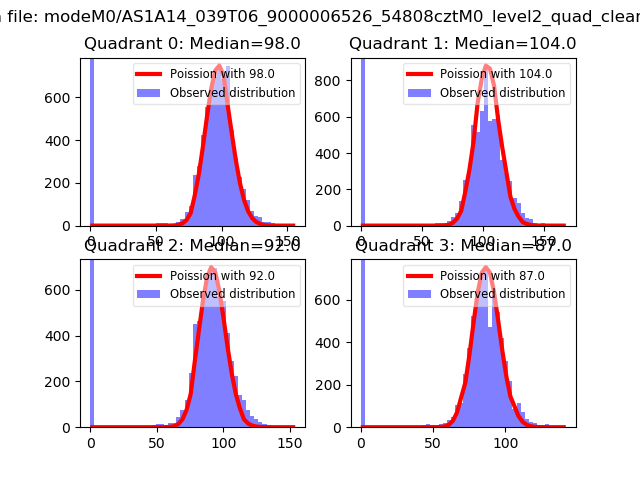 |
 |
| Quadrant-wise count rates Data is divided into 100 sec bins |
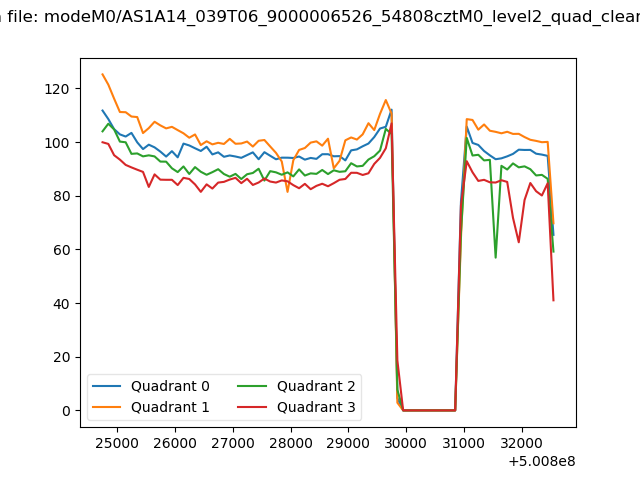 |
|
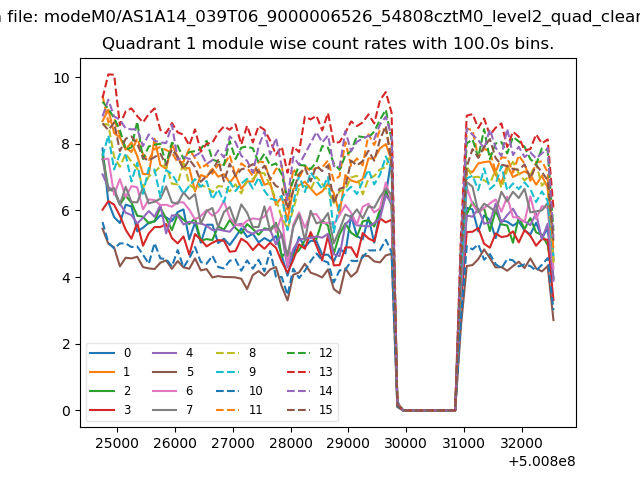
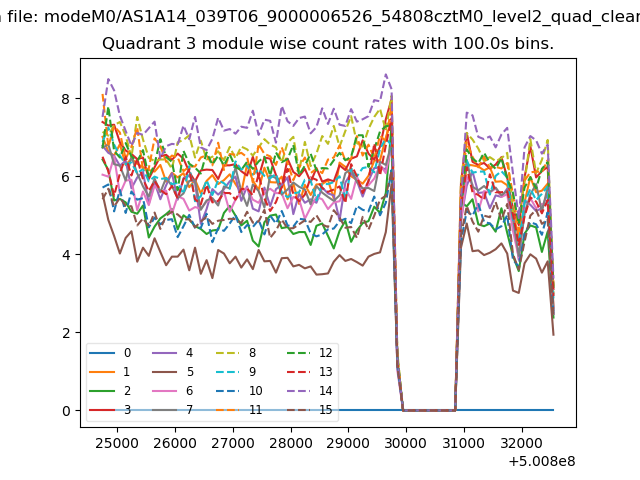
| Module-wise count rates for Quadrant A Data is divided into 100 sec bins |
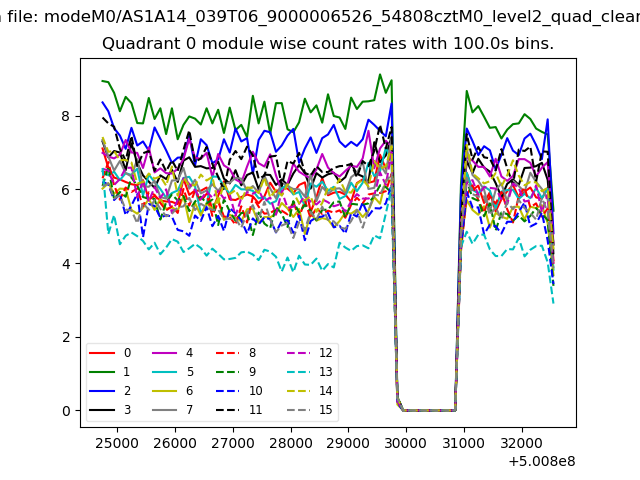 |
 |
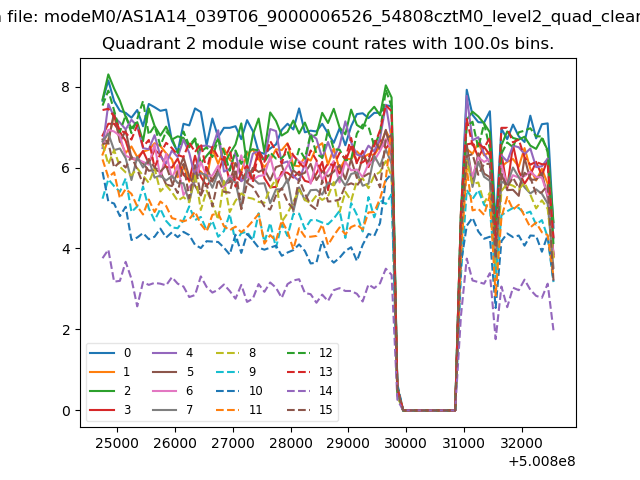
| Module-wise count rates for Quadrant B Data is divided into 100 sec bins |
 |
 |
| Module-wise count rates for Quadrant C Data is divided into 100 sec bins |
 |
 |
| Module-wise count rates for Quadrant D Data is divided into 100 sec bins |
 |
 |
| Parameter | Plot |
|---|---|
| CZT HV Monitor | 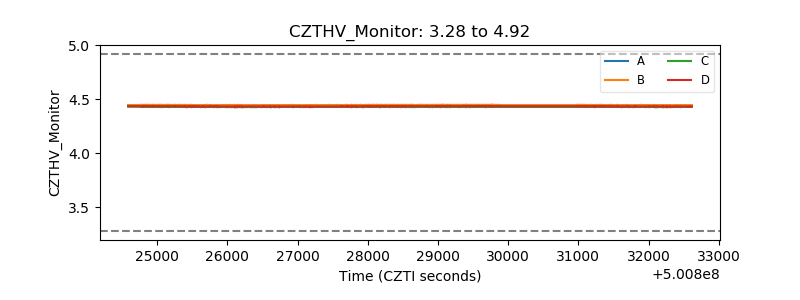 |
| D_VDD | 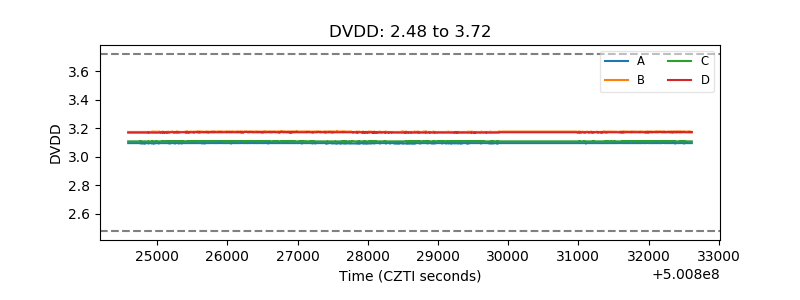 |
| Temperature 1 | 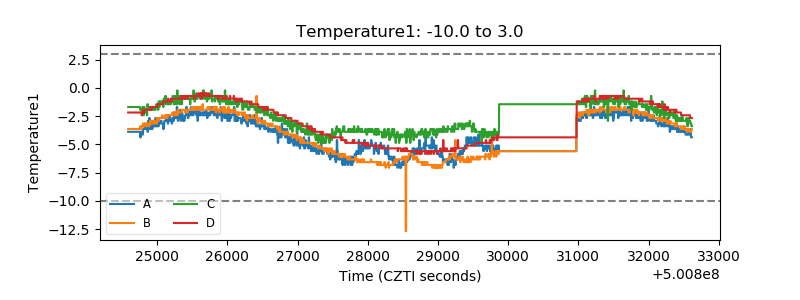 |
| Veto HV Monitor | 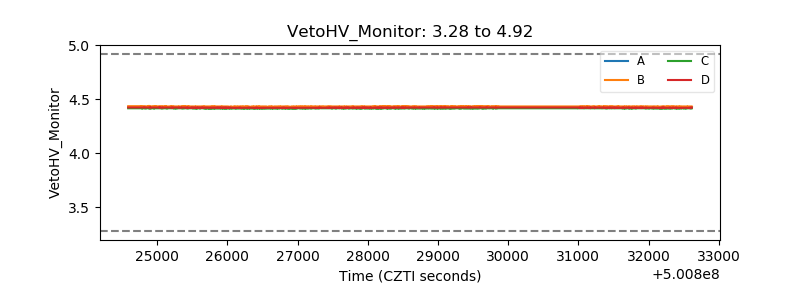 |
| Veto LLD | 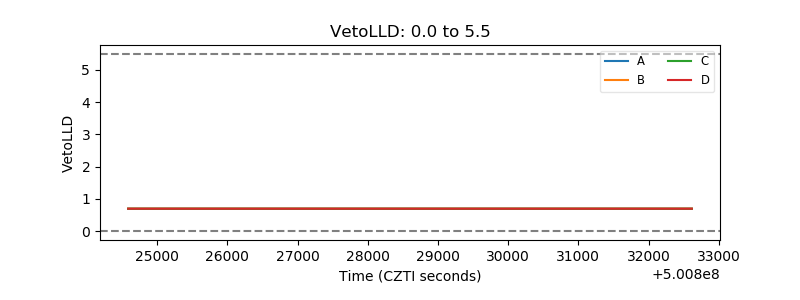 |
| Alpha Counter | 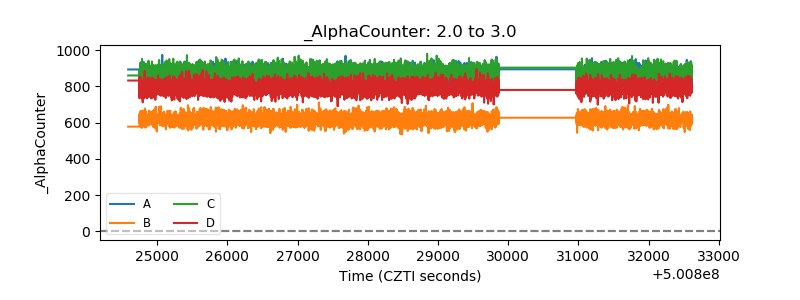 |
| _CPM_Rate | 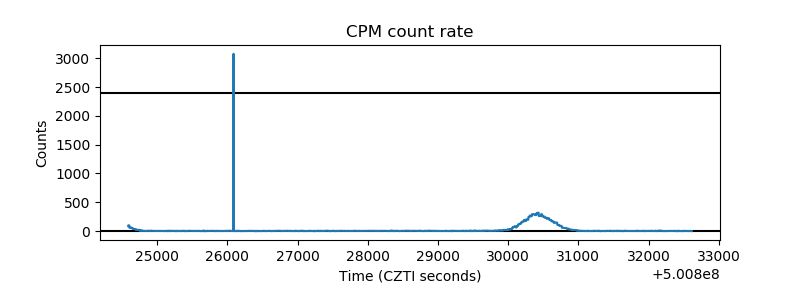 |
| CZT Counter | 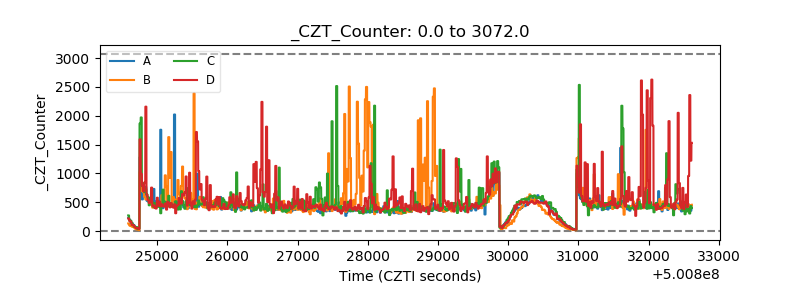 |
| +2.5 Volts monitor |  |
| +5 Volts monitor |  |
| _ROLL_ROT | 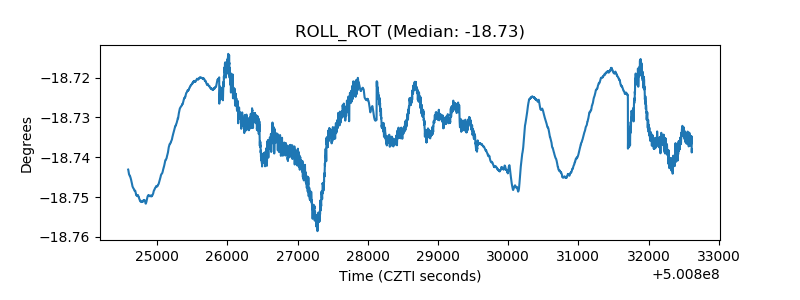 |
| _Roll_DEC | 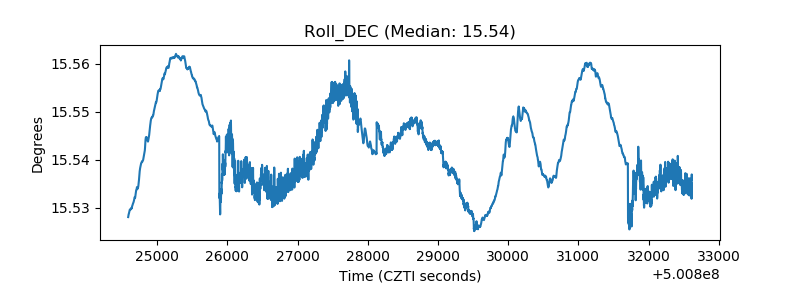 |
| _Roll_RA | 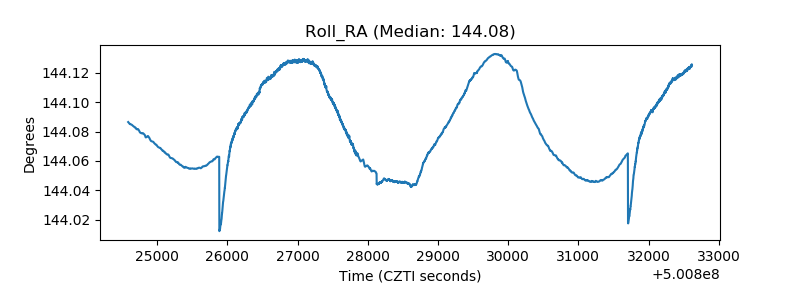 |
| Veto Counter | 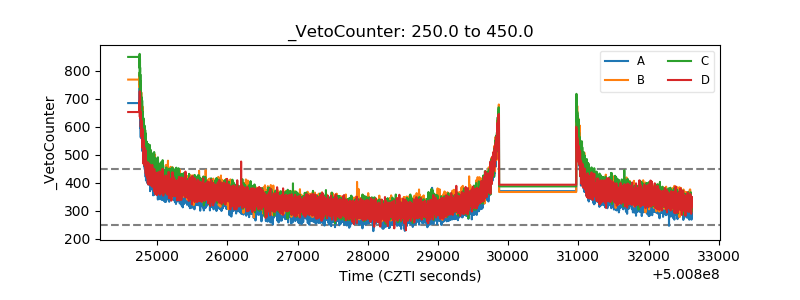 |