| Param | Original file | Final file |
|---|---|---|
| Filename | modeM0/AS1A14_039T06_9000006526_54809cztM0_level2.fits | modeM0/AS1A14_039T06_9000006526_54809cztM0_level2_quad_clean.evt |
| Size (bytes) | 450,584,640 | 96,592,320 |
| Size | 429.7 MB | 92.1 MB |
| Events in quadrant A | 3,011,002 | 650,868 |
| Events in quadrant B | 3,728,534 | 678,456 |
| Events in quadrant C | 3,757,559 | 608,385 |
| Events in quadrant D | 5,646,983 | 508,113 |
| Mode M9 | |||
|---|---|---|---|
| Quadrant | BADHDUFLAG | Total packets | Discarded packets |
| A | 0 | 17 | 0 |
| B | 0 | 17 | 0 |
| C | 0 | 18 | 0 |
| D | 0 | 18 | 0 |
| Mode M0 | |||
|---|---|---|---|
| Quadrant | BADHDUFLAG | Total packets | Discarded packets |
| A | 0 | 14380 | 2 |
| B | 0 | 16167 | 9 |
| C | 0 | 16274 | 2 |
| D | 0 | 21856 | 2 |
| Mode SS | |||
|---|---|---|---|
| Quadrant | BADHDUFLAG | Total packets | Discarded packets |
| A | 0 | 140 | 0 |
| B | 0 | 140 | 0 |
| C | 0 | 140 | 0 |
| D | 0 | 140 | 0 |
| Quadrant | Total seconds | Saturated seconds | Saturation percentage |
|---|---|---|---|
| A | 6872 | 85 | 1.236903% |
| B | 6871 | 265 | 3.856789% |
| C | 6872 | 172 | 2.502910% |
| D | 6872 | 1037 | 15.090221% |
Noise dominated data is calculated using 1-second bins in cleaned event files. If a bin has >2000 counts, and if more than 50% of those come from <1% of pixels, then it is considered to be noise-dominated and hence unusable.
| Quadrant | # 1 sec bins | Bins with >0 counts | Bins with >2000 counts | High rate bins dominated by noise | Noise dominated (total time) | Noise dominated (detector-on time) | Marked lightcurve |
|---|---|---|---|---|---|---|---|
| A | 7742 | 6873 | 11 | 11 | 0.14% | 0.16% | 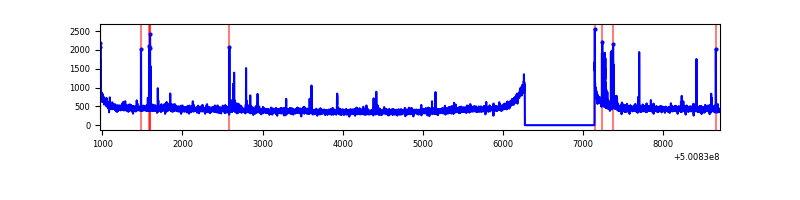 |
| B | 7742 | 6871 | 128 | 128 | 1.65% | 1.86% | 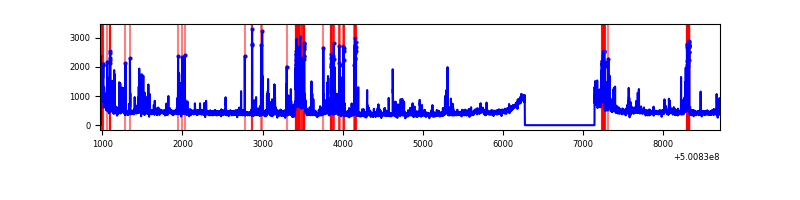 |
| C | 7742 | 6872 | 75 | 75 | 0.97% | 1.09% | 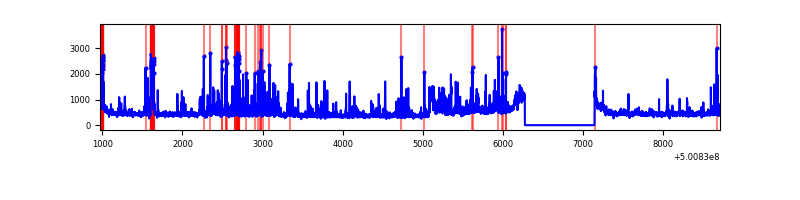 |
| D | 7742 | 6872 | 912 | 912 | 11.78% | 13.27% | 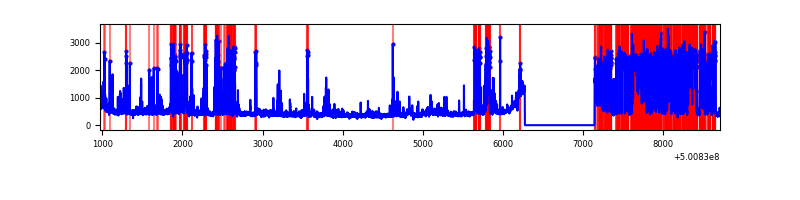 |
Top three noisy pixels from each quadrant. If the there are fewer than three noisy pixels in the level2.evt file, extra rows are filled as -1
| Pixel properties | Quadrant properties | ||||||
|---|---|---|---|---|---|---|---|
| Quadrant | DetID | PixID | Counts | Sigma | Mean | Median | Sigma |
| A | 5 | 240 | 52368 | 279.15 | 743 | 722 | 185.0 |
| A | 3 | 94 | 22407 | 117.21 | 743 | 722 | 185.0 |
| A | 3 | 14 | 16416 | 84.83 | 743 | 722 | 185.0 |
| B | 5 | 185 | 520948 | 3327.79 | 722 | 696 | 156.3 |
| B | 2 | 249 | 146822 | 934.69 | 722 | 696 | 156.3 |
| B | 10 | 247 | 53025 | 334.72 | 722 | 696 | 156.3 |
| C | 9 | 38 | 265211 | 1351.83 | 713 | 708 | 195.7 |
| C | 4 | 5 | 178915 | 910.79 | 713 | 708 | 195.7 |
| C | 12 | 252 | 154028 | 783.59 | 713 | 708 | 195.7 |
| D | 15 | 94 | 2169476 | 11367.46 | 662 | 631 | 190.8 |
| D | 1 | 31 | 317053 | 1658.44 | 662 | 631 | 190.8 |
| D | 12 | 6 | 94724 | 493.16 | 662 | 631 | 190.8 |
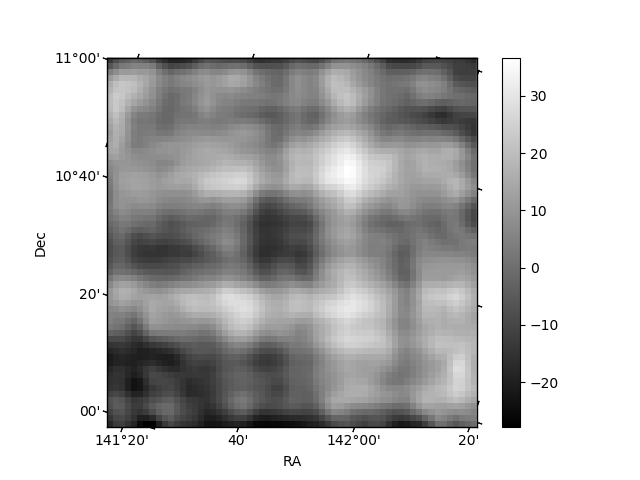
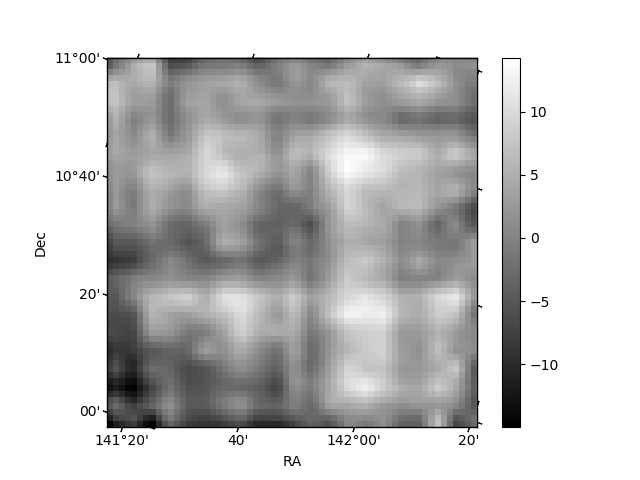
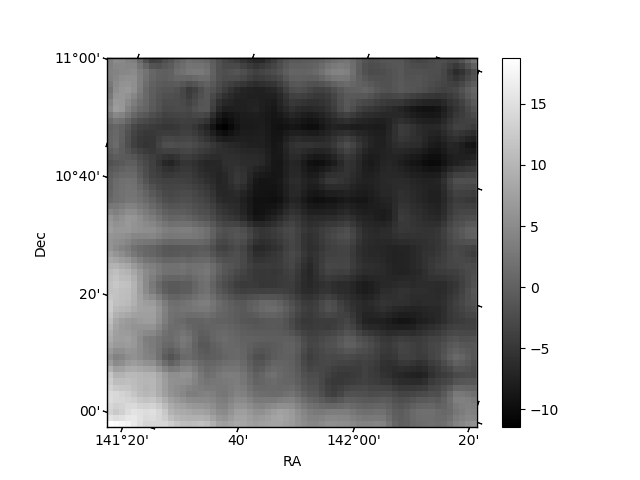
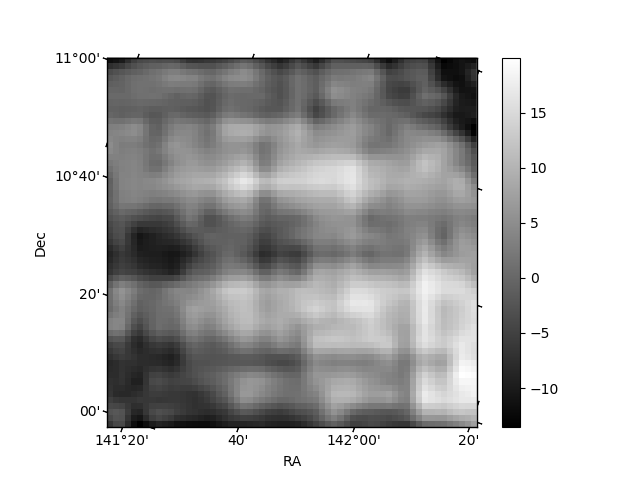
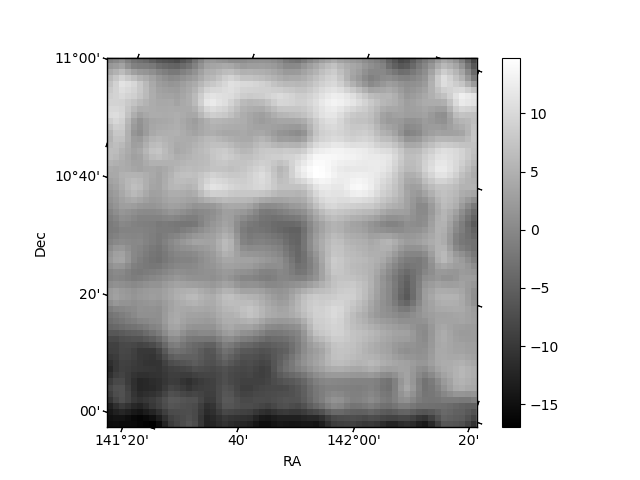
Histogram calculated using DETX and DETY for each event in the final _common_clean file
| Quadrant A | 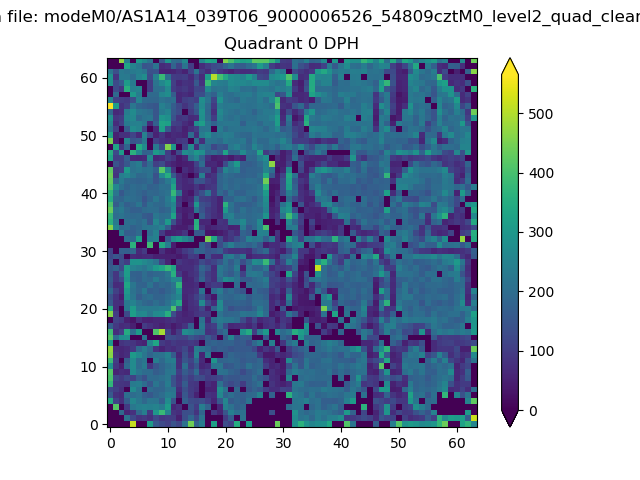 |
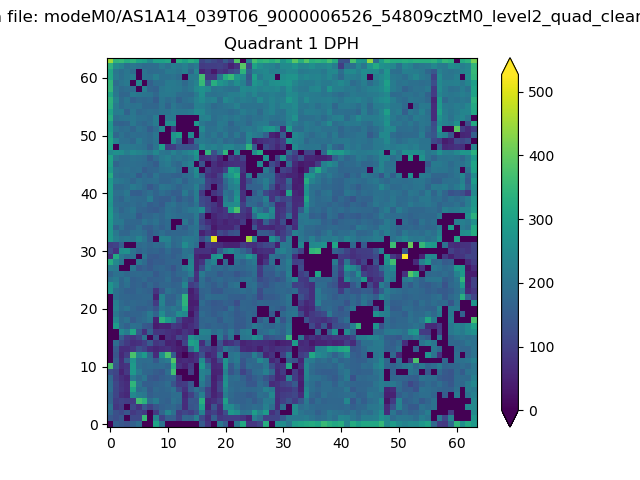 |
Quadrant B |
|---|---|---|---|
| Quadrant D | 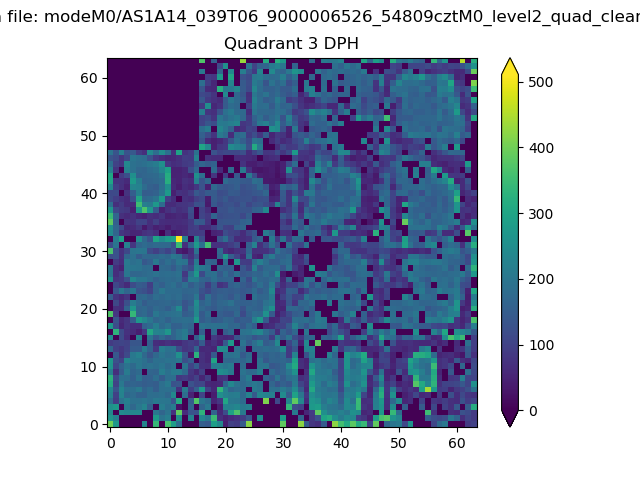 |
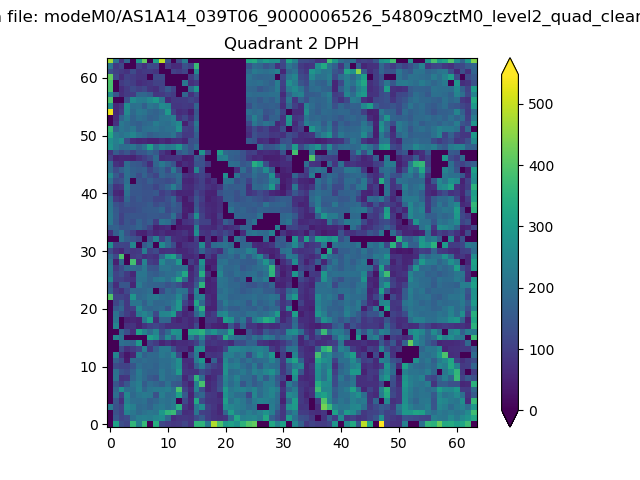 |
Quadrant C |
| Plot type | Count rate plots | Images |
|---|---|---|
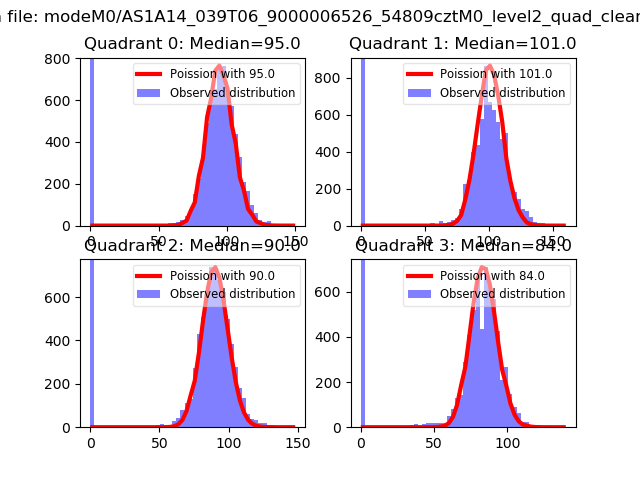
| Comparison with Poisson distribution Blue bars denote a histogram of data divided into 1 sec bins. Red curve is a Poisson curve with rate = median count rate of data. |
 |
 |
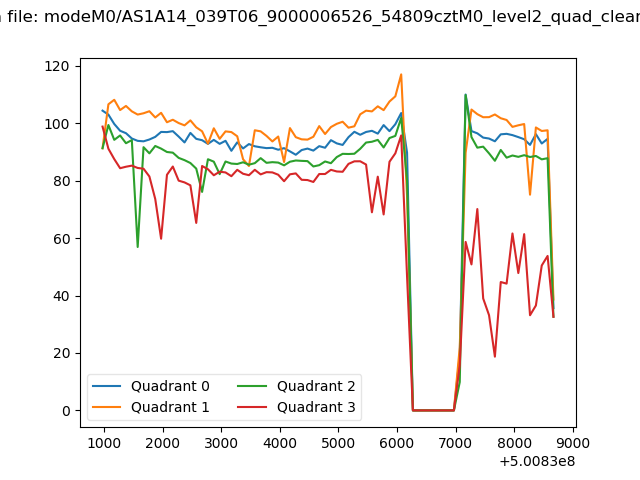
| Quadrant-wise count rates Data is divided into 100 sec bins |
 |
|
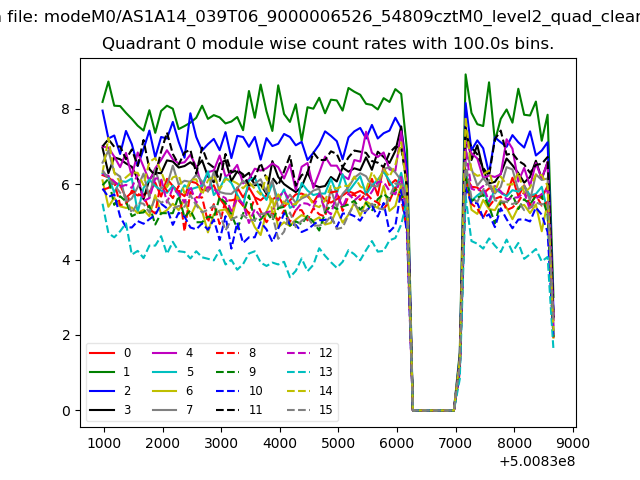
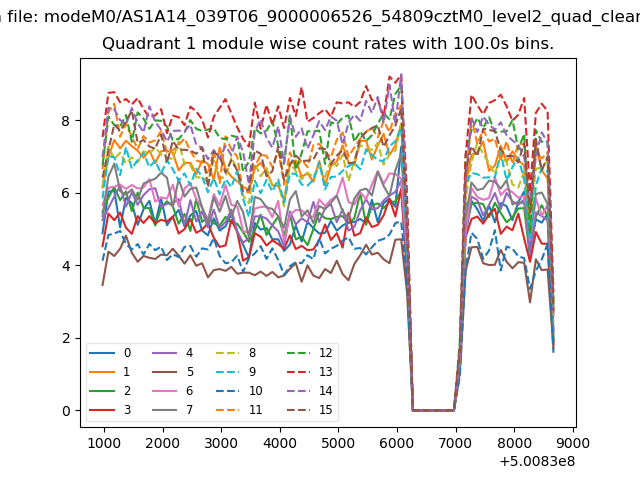
| Module-wise count rates for Quadrant A Data is divided into 100 sec bins |
 |
 |
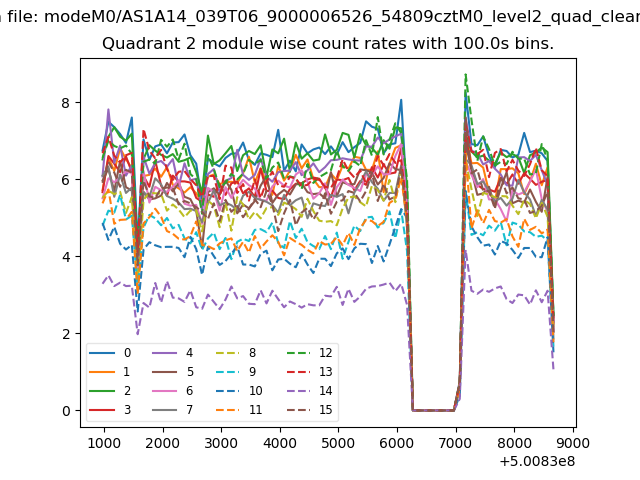
| Module-wise count rates for Quadrant B Data is divided into 100 sec bins |
 |
 |
| Module-wise count rates for Quadrant C Data is divided into 100 sec bins |
 |
 |
| Module-wise count rates for Quadrant D Data is divided into 100 sec bins |
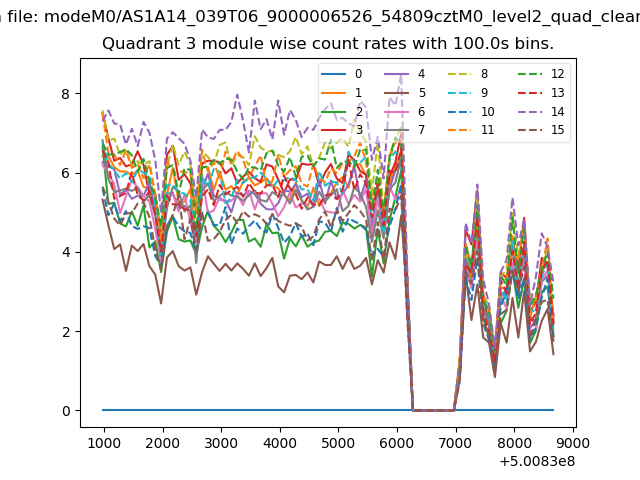 |
 |
| Parameter | Plot |
|---|---|
| CZT HV Monitor | 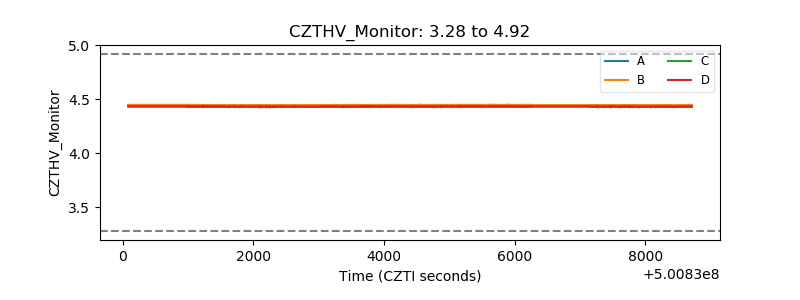 |
| D_VDD | 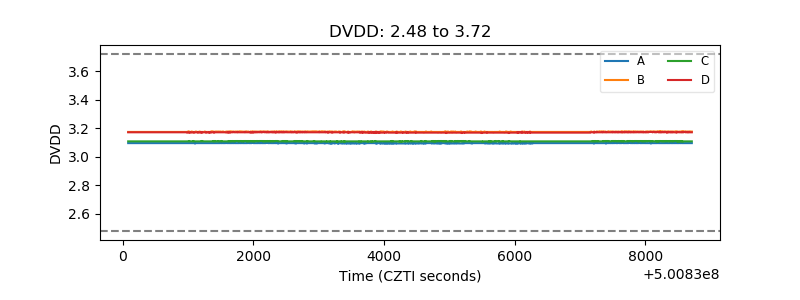 |
| Temperature 1 | 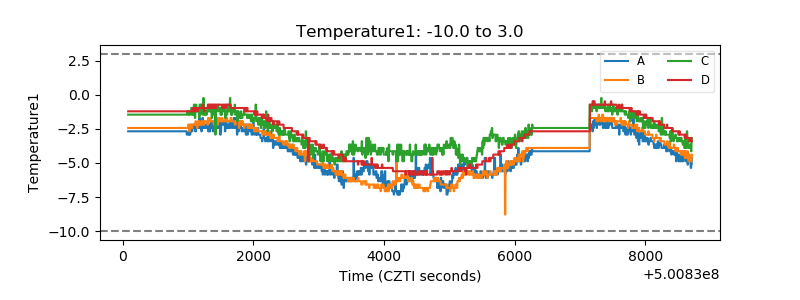 |
| Veto HV Monitor | 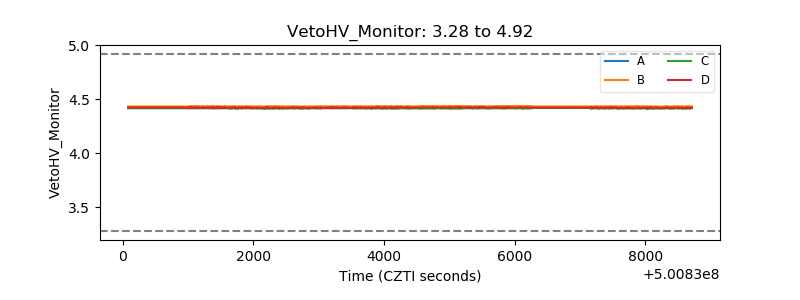 |
| Veto LLD | 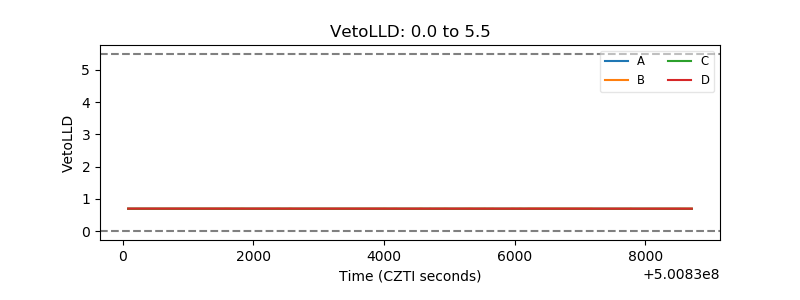 |
| Alpha Counter | 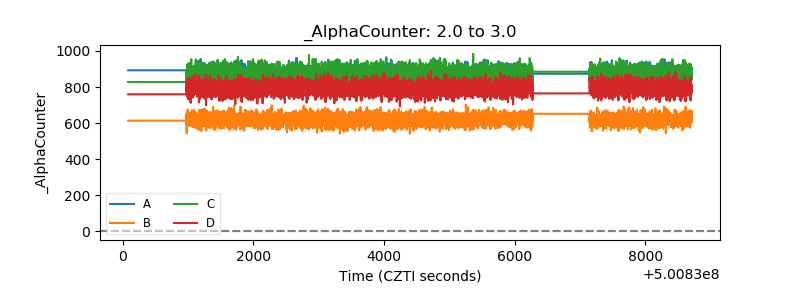 |
| _CPM_Rate | 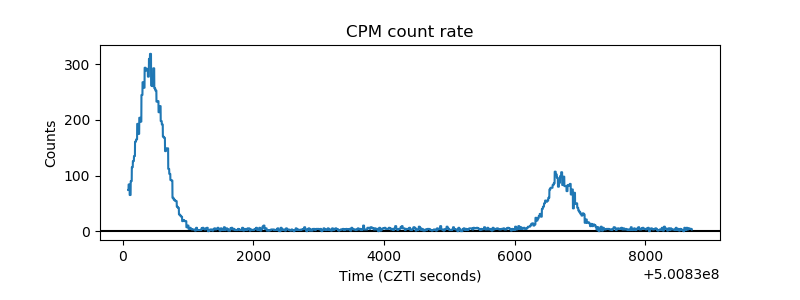 |
| CZT Counter | 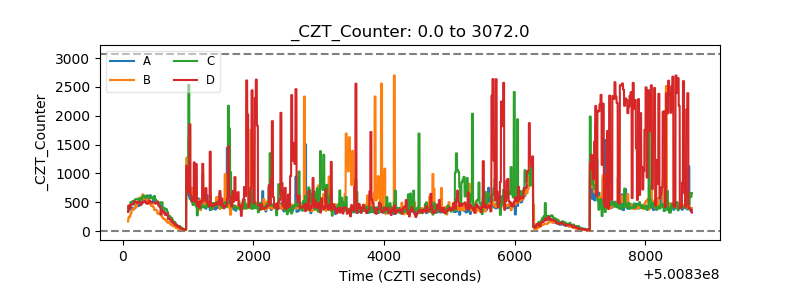 |
| +2.5 Volts monitor | 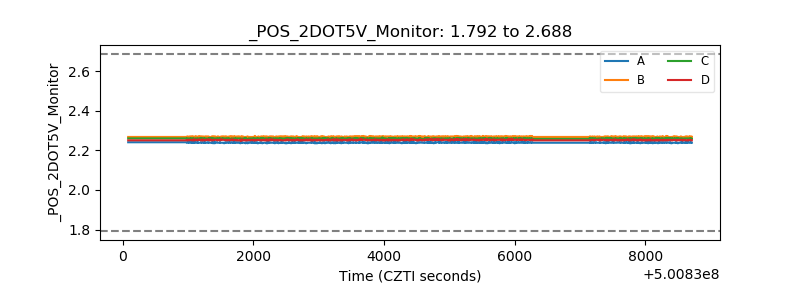 |
| +5 Volts monitor |  |
| _ROLL_ROT | 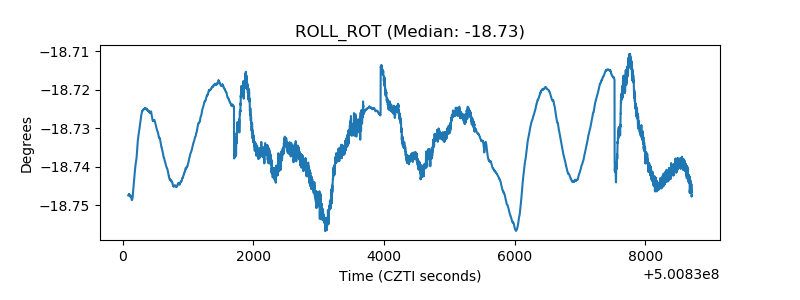 |
| _Roll_DEC | 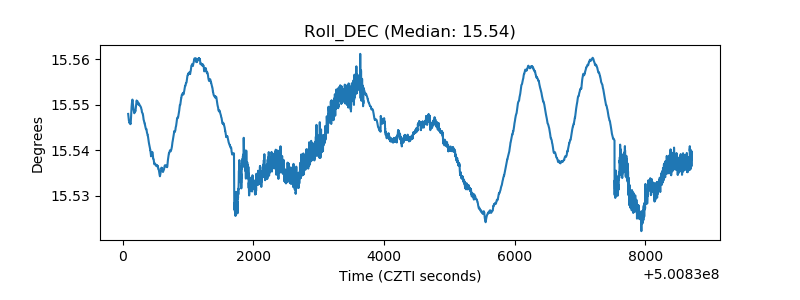 |
| _Roll_RA | 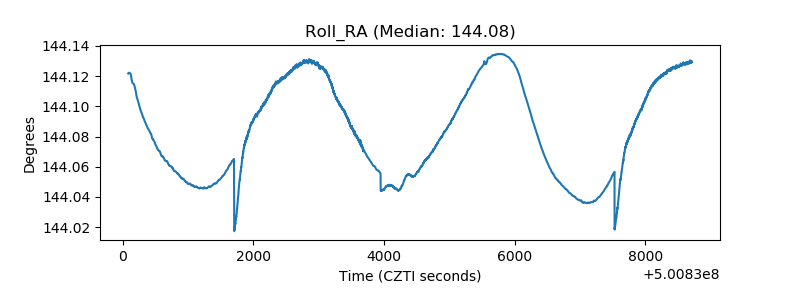 |
| Veto Counter | 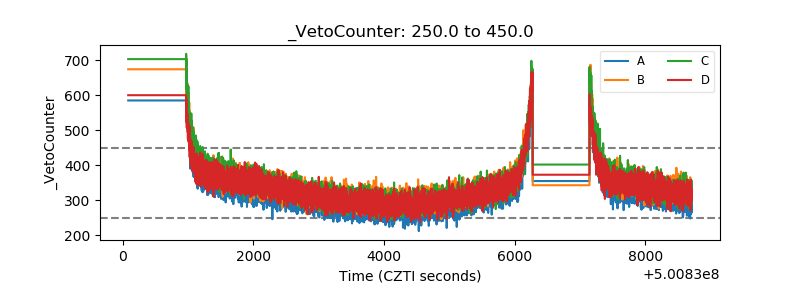 |