| Param | Original file | Final file |
|---|---|---|
| Filename | modeM0/AS1A14_039T06_9000006526_54811cztM0_level2.fits | modeM0/AS1A14_039T06_9000006526_54811cztM0_level2_quad_clean.evt |
| Size (bytes) | 679,844,160 | 103,677,120 |
| Size | 648.3 MB | 98.9 MB |
| Events in quadrant A | 3,520,969 | 735,304 |
| Events in quadrant B | 4,548,160 | 758,583 |
| Events in quadrant C | 5,385,590 | 676,945 |
| Events in quadrant D | 11,100,968 | 422,254 |
| Mode M9 | |||
|---|---|---|---|
| Quadrant | BADHDUFLAG | Total packets | Discarded packets |
| A | 0 | 1 | 0 |
| B | 0 | 1 | 0 |
| C | 0 | 1 | 0 |
| D | 0 | 1 | 0 |
| Mode M0 | |||
|---|---|---|---|
| Quadrant | BADHDUFLAG | Total packets | Discarded packets |
| A | 0 | 16567 | 1 |
| B | 0 | 19103 | 1 |
| C | 0 | 21755 | 1 |
| D | 0 | 38557 | 1 |
| Mode SS | |||
|---|---|---|---|
| Quadrant | BADHDUFLAG | Total packets | Discarded packets |
| A | 0 | 158 | 0 |
| B | 0 | 158 | 0 |
| C | 0 | 158 | 0 |
| D | 0 | 158 | 0 |
| Quadrant | Total seconds | Saturated seconds | Saturation percentage |
|---|---|---|---|
| A | 7856 | 73 | 0.929226% |
| B | 7856 | 324 | 4.124236% |
| C | 7855 | 341 | 4.341184% |
| D | 7855 | 3050 | 38.828771% |
Noise dominated data is calculated using 1-second bins in cleaned event files. If a bin has >2000 counts, and if more than 50% of those come from <1% of pixels, then it is considered to be noise-dominated and hence unusable.
| Quadrant | # 1 sec bins | Bins with >0 counts | Bins with >2000 counts | High rate bins dominated by noise | Noise dominated (total time) | Noise dominated (detector-on time) | Marked lightcurve |
|---|---|---|---|---|---|---|---|
| A | 7911 | 7858 | 18 | 18 | 0.23% | 0.23% | 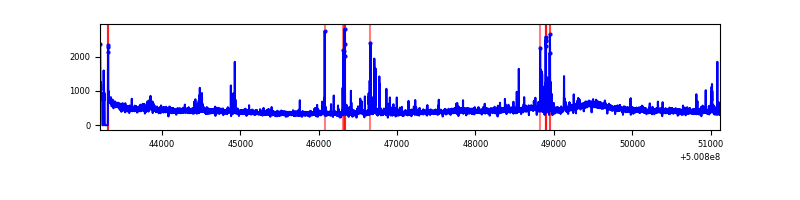 |
| B | 7911 | 7856 | 158 | 158 | 2.00% | 2.01% | 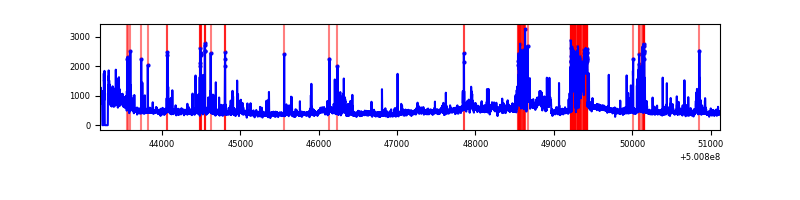 |
| C | 7910 | 7856 | 207 | 207 | 2.62% | 2.63% | 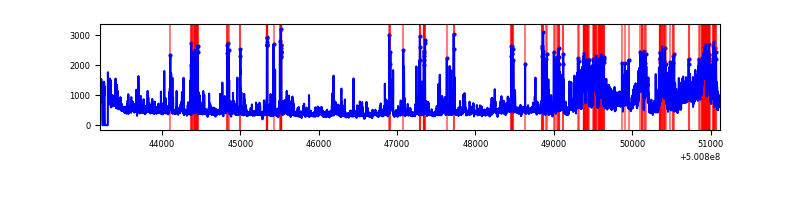 |
| D | 7910 | 7855 | 2926 | 2926 | 36.99% | 37.25% | 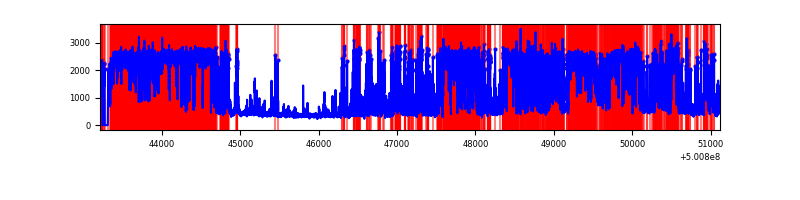 |
Top three noisy pixels from each quadrant. If the there are fewer than three noisy pixels in the level2.evt file, extra rows are filled as -1
| Pixel properties | Quadrant properties | ||||||
|---|---|---|---|---|---|---|---|
| Quadrant | DetID | PixID | Counts | Sigma | Mean | Median | Sigma |
| A | 6 | 161 | 76163 | 366.48 | 834 | 813 | 205.6 |
| A | 3 | 94 | 61951 | 297.36 | 834 | 813 | 205.6 |
| A | 5 | 240 | 49088 | 234.8 | 834 | 813 | 205.6 |
| B | 1 | 207 | 461643 | 2651.41 | 811 | 782 | 173.8 |
| B | 7 | 0 | 303157 | 1739.62 | 811 | 782 | 173.8 |
| B | 5 | 185 | 293764 | 1685.58 | 811 | 782 | 173.8 |
| C | 9 | 38 | 1127684 | 5095.28 | 801 | 795 | 221.2 |
| C | 4 | 5 | 407667 | 1839.69 | 801 | 795 | 221.2 |
| C | 9 | 237 | 219687 | 989.73 | 801 | 795 | 221.2 |
| D | 15 | 94 | 7510899 | 41171.78 | 632 | 603 | 182.4 |
| D | 1 | 31 | 342049 | 1871.82 | 632 | 603 | 182.4 |
| D | 12 | 6 | 211333 | 1155.23 | 632 | 603 | 182.4 |
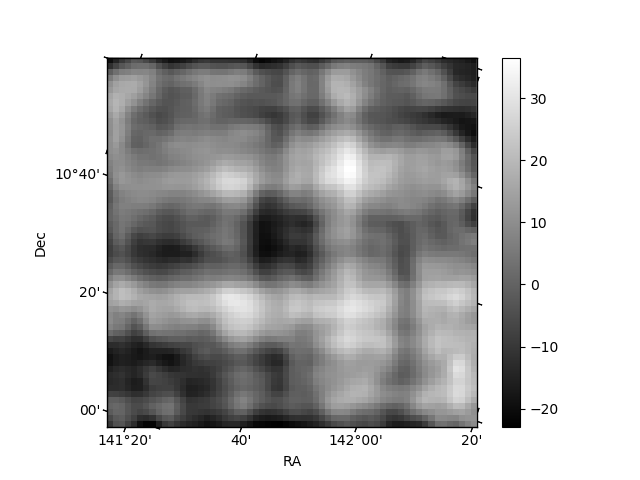
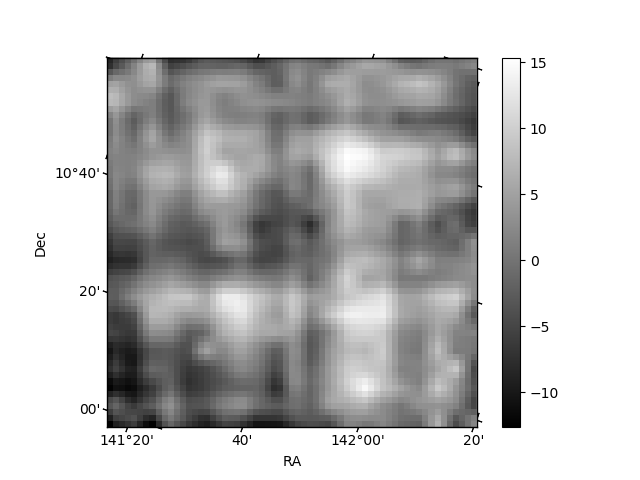
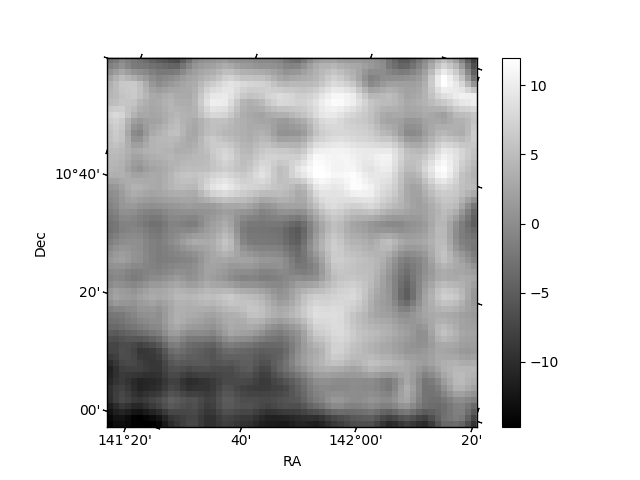
Histogram calculated using DETX and DETY for each event in the final _common_clean file
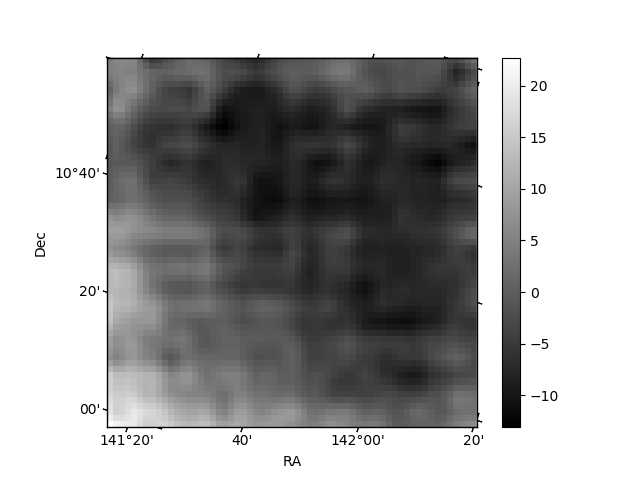
| Quadrant A | 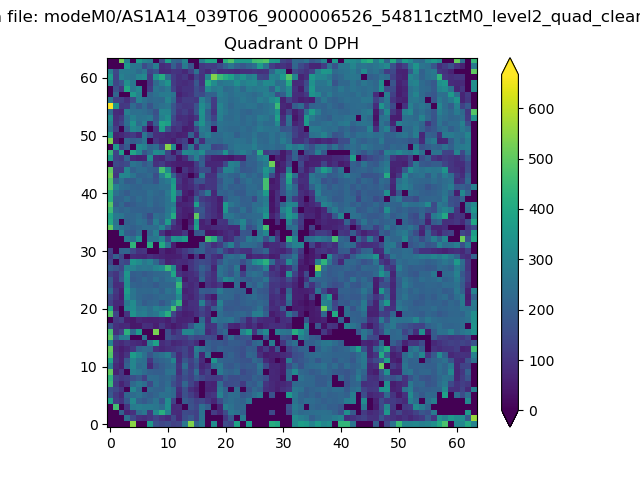 |
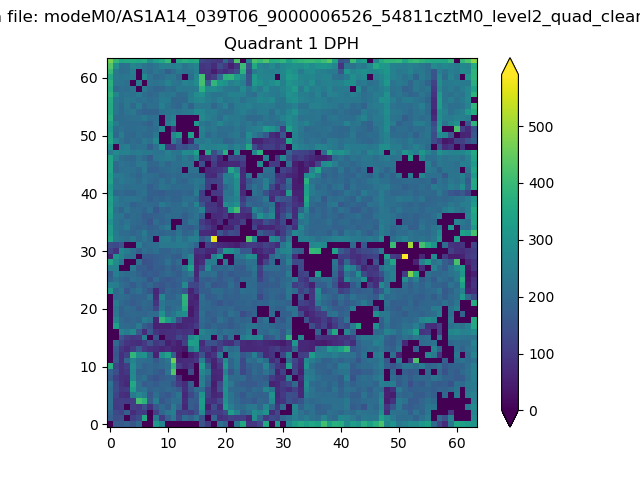 |
Quadrant B |
|---|---|---|---|
| Quadrant D | 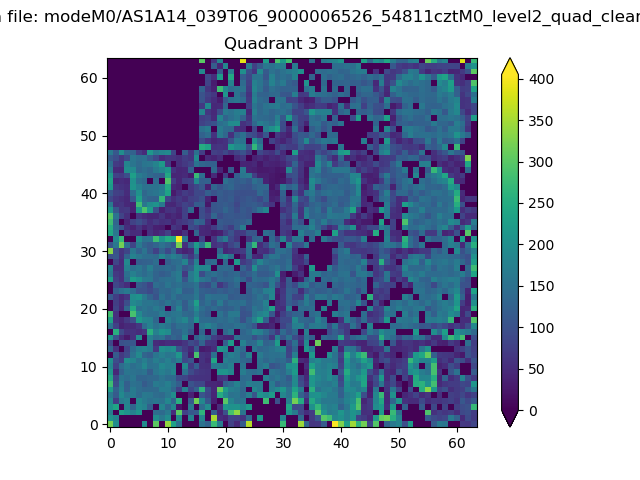 |
 |
Quadrant C |
| Plot type | Count rate plots | Images |
|---|---|---|
| Comparison with Poisson distribution Blue bars denote a histogram of data divided into 1 sec bins. Red curve is a Poisson curve with rate = median count rate of data. |
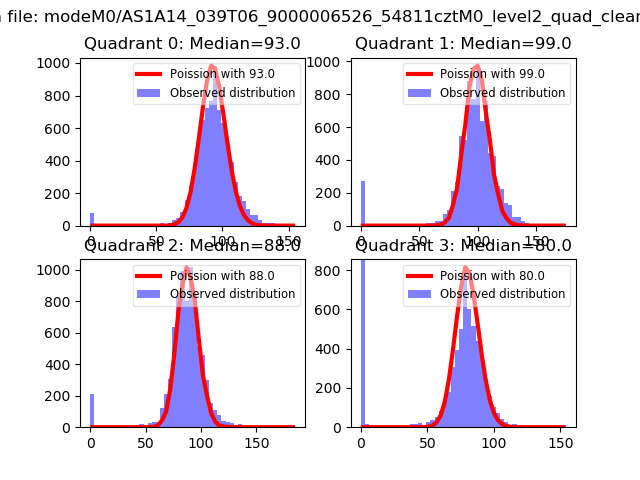 |
 |
| Quadrant-wise count rates Data is divided into 100 sec bins |
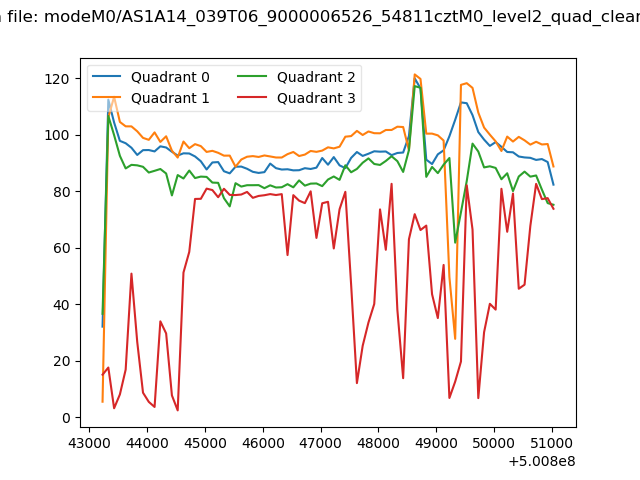 |
|
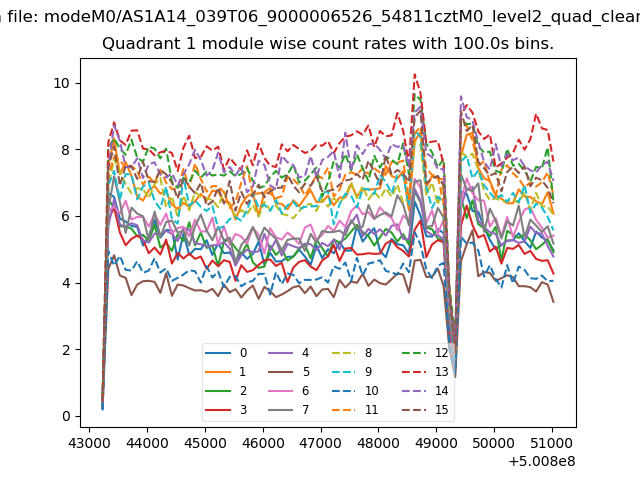
| Module-wise count rates for Quadrant A Data is divided into 100 sec bins |
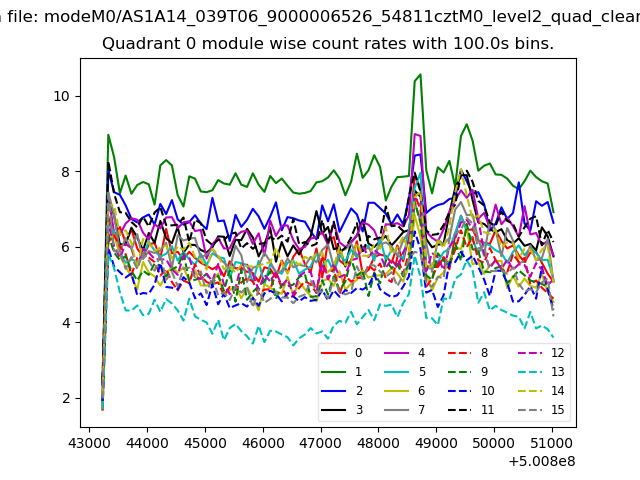 |
 |
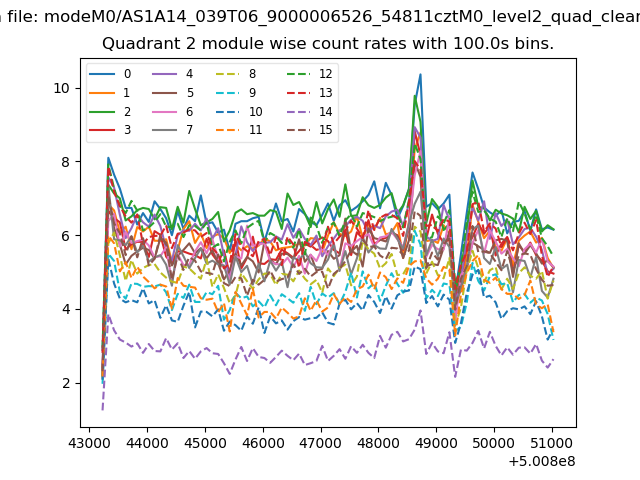
| Module-wise count rates for Quadrant B Data is divided into 100 sec bins |
 |
 |
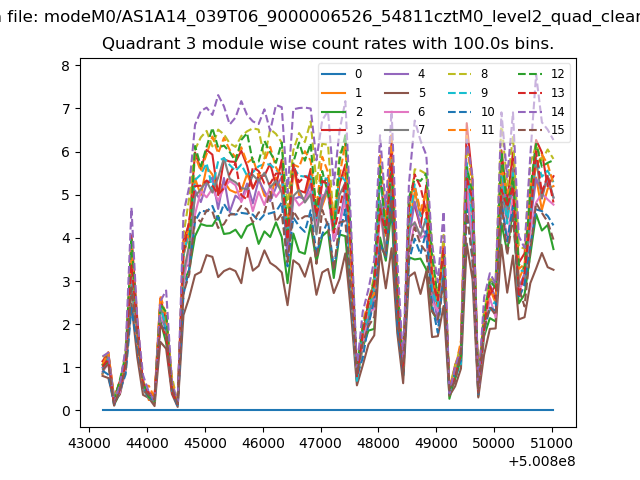
| Module-wise count rates for Quadrant C Data is divided into 100 sec bins |
 |
 |
| Module-wise count rates for Quadrant D Data is divided into 100 sec bins |
 |
 |
| Parameter | Plot |
|---|---|
| CZT HV Monitor | 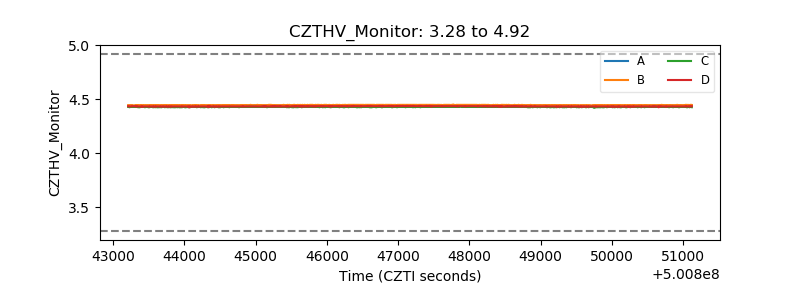 |
| D_VDD | 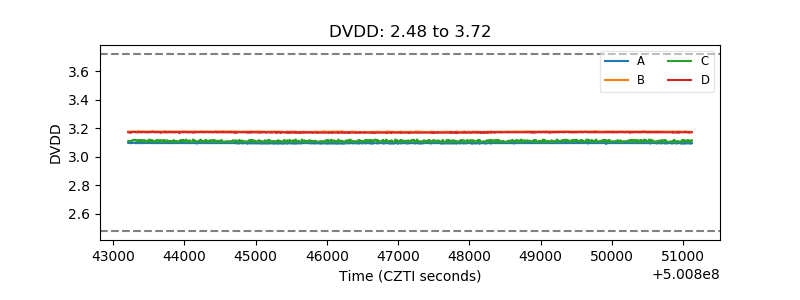 |
| Temperature 1 | 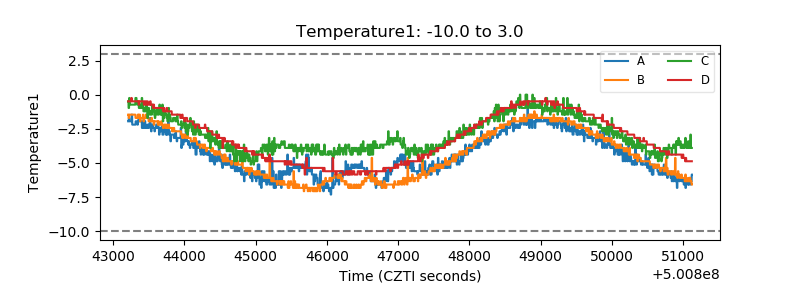 |
| Veto HV Monitor | 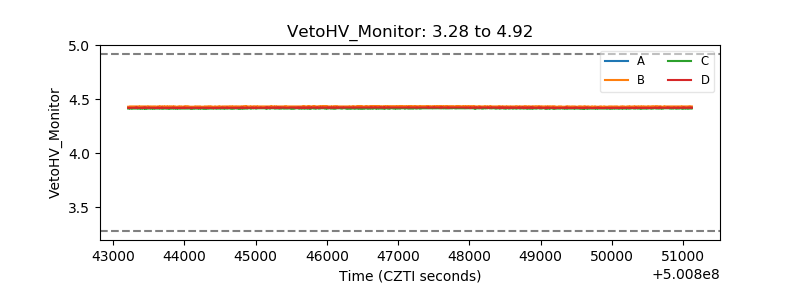 |
| Veto LLD | 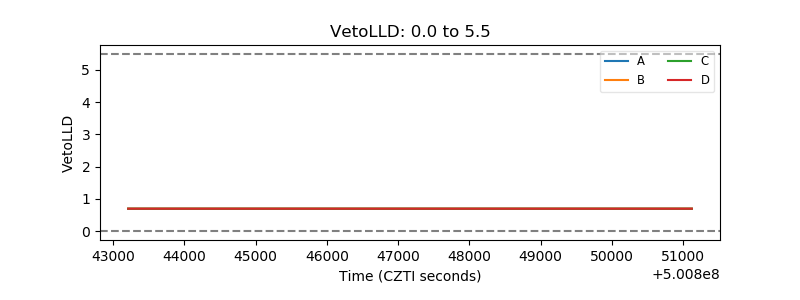 |
| Alpha Counter | 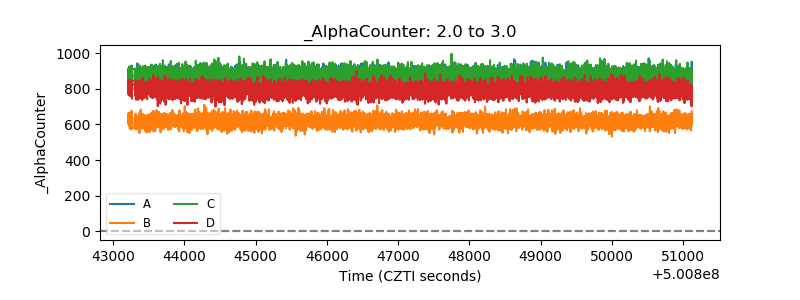 |
| _CPM_Rate | 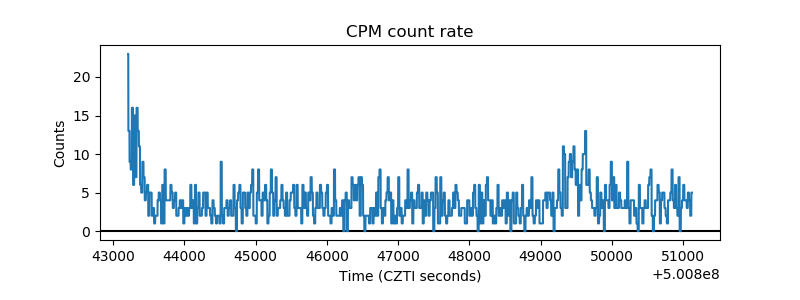 |
| CZT Counter | 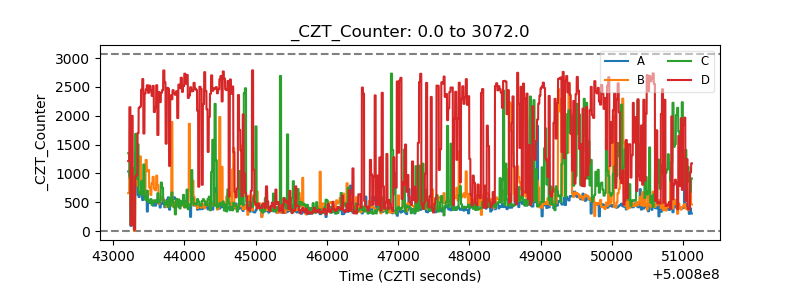 |
| +2.5 Volts monitor |  |
| +5 Volts monitor |  |
| _ROLL_ROT | 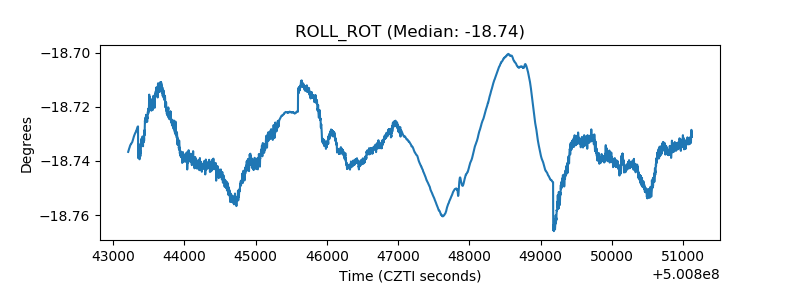 |
| _Roll_DEC | 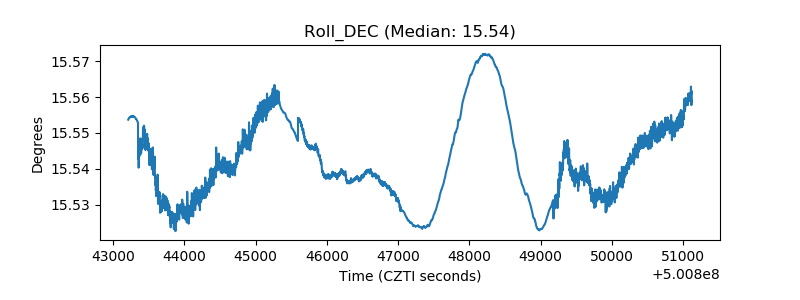 |
| _Roll_RA | 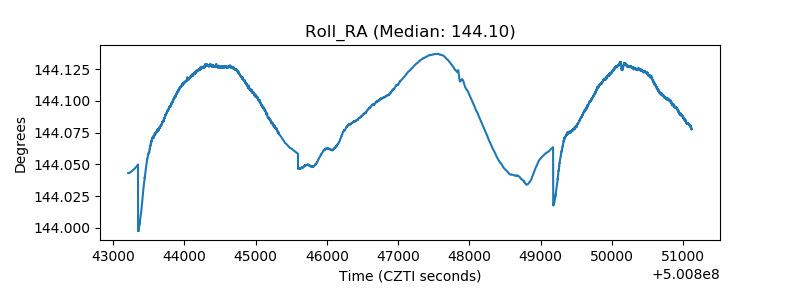 |
| Veto Counter | 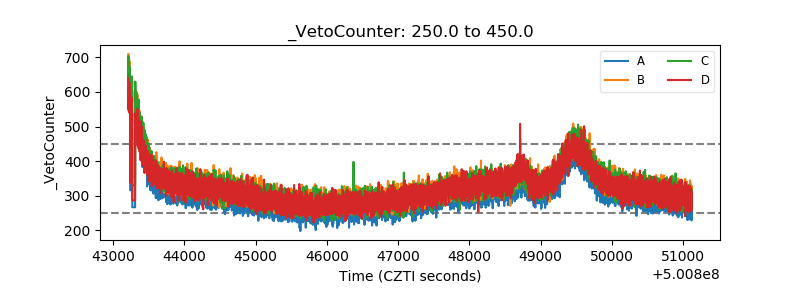 |