| Param | Original file | Final file |
|---|---|---|
| Filename | modeM0/AS1A14_039T06_9000006526_54812cztM0_level2.fits | modeM0/AS1A14_039T06_9000006526_54812cztM0_level2_quad_clean.evt |
| Size (bytes) | 727,704,000 | 113,644,800 |
| Size | 694.0 MB | 108.4 MB |
| Events in quadrant A | 3,610,369 | 791,957 |
| Events in quadrant B | 5,871,884 | 790,300 |
| Events in quadrant C | 7,042,163 | 714,378 |
| Events in quadrant D | 9,759,122 | 557,843 |
| Mode M0 | |||
|---|---|---|---|
| Quadrant | BADHDUFLAG | Total packets | Discarded packets |
| A | 0 | 17388 | 0 |
| B | 0 | 23699 | 0 |
| C | 0 | 26930 | 1 |
| D | 0 | 35048 | 0 |
| Mode SS | |||
|---|---|---|---|
| Quadrant | BADHDUFLAG | Total packets | Discarded packets |
| A | 0 | 170 | 0 |
| B | 0 | 170 | 0 |
| C | 0 | 170 | 0 |
| D | 0 | 170 | 0 |
| Quadrant | Total seconds | Saturated seconds | Saturation percentage |
|---|---|---|---|
| A | 8436 | 15 | 0.177809% |
| B | 8436 | 637 | 7.550972% |
| C | 8435 | 489 | 5.797273% |
| D | 8435 | 2026 | 24.018969% |
Noise dominated data is calculated using 1-second bins in cleaned event files. If a bin has >2000 counts, and if more than 50% of those come from <1% of pixels, then it is considered to be noise-dominated and hence unusable.
| Quadrant | # 1 sec bins | Bins with >0 counts | Bins with >2000 counts | High rate bins dominated by noise | Noise dominated (total time) | Noise dominated (detector-on time) | Marked lightcurve |
|---|---|---|---|---|---|---|---|
| A | 8436 | 8436 | 2 | 2 | 0.02% | 0.02% | 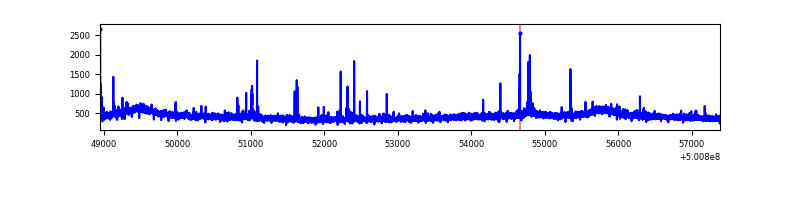 |
| B | 8436 | 8436 | 520 | 520 | 6.16% | 6.16% | 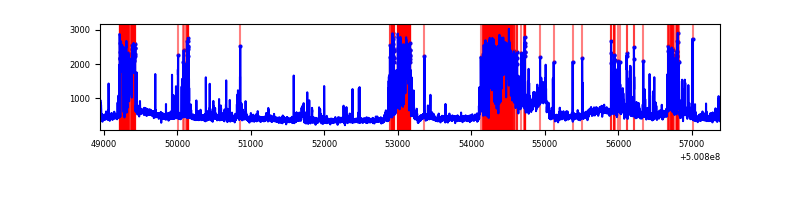 |
| C | 8435 | 8435 | 449 | 449 | 5.32% | 5.32% | 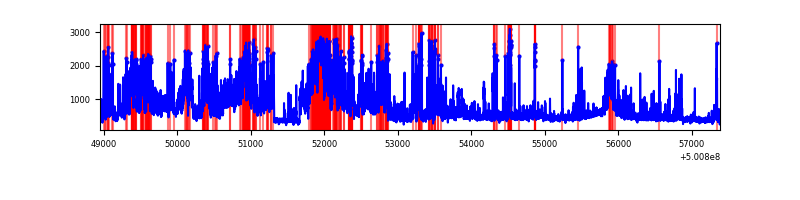 |
| D | 8435 | 8435 | 1984 | 1984 | 23.52% | 23.52% | 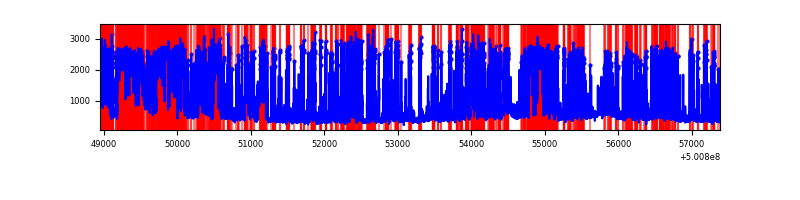 |
Top three noisy pixels from each quadrant. If the there are fewer than three noisy pixels in the level2.evt file, extra rows are filled as -1
| Pixel properties | Quadrant properties | ||||||
|---|---|---|---|---|---|---|---|
| Quadrant | DetID | PixID | Counts | Sigma | Mean | Median | Sigma |
| A | 5 | 240 | 36689 | 159.47 | 896 | 872 | 224.6 |
| A | 3 | 14 | 28976 | 125.13 | 896 | 872 | 224.6 |
| A | 6 | 161 | 18895 | 80.25 | 896 | 872 | 224.6 |
| B | 5 | 185 | 1307579 | 6986.58 | 862 | 831 | 187.0 |
| B | 1 | 207 | 475653 | 2538.66 | 862 | 831 | 187.0 |
| B | 7 | 0 | 293317 | 1563.79 | 862 | 831 | 187.0 |
| C | 9 | 38 | 2354277 | 9941.8 | 854 | 845 | 236.7 |
| C | 4 | 5 | 389340 | 1641.15 | 854 | 845 | 236.7 |
| C | 9 | 237 | 225678 | 949.78 | 854 | 845 | 236.7 |
| D | 15 | 94 | 5285437 | 24243.33 | 762 | 730 | 218.0 |
| D | 1 | 31 | 871288 | 3993.64 | 762 | 730 | 218.0 |
| D | 12 | 6 | 121311 | 553.16 | 762 | 730 | 218.0 |
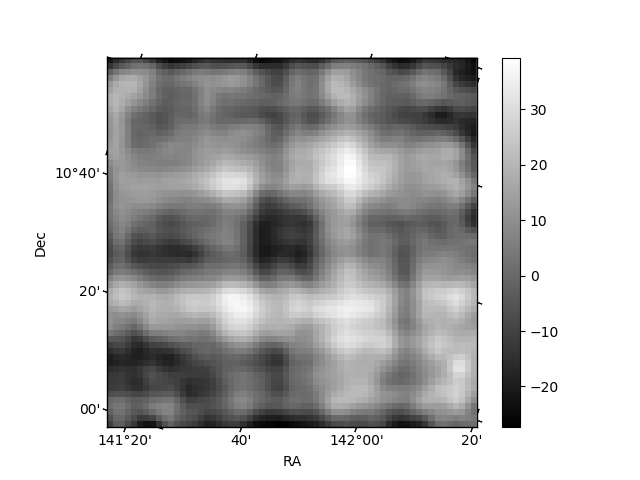
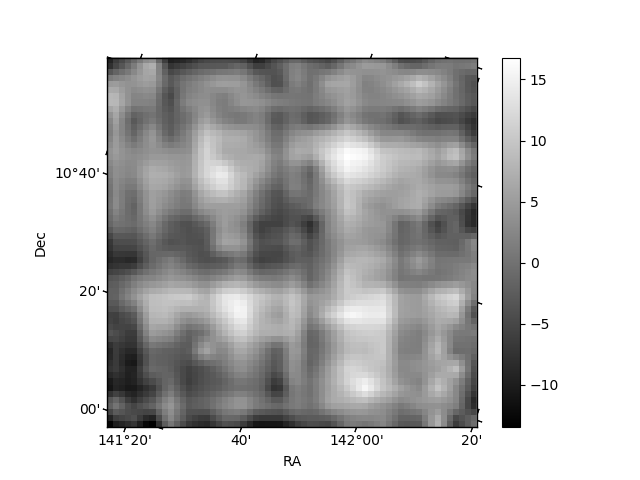
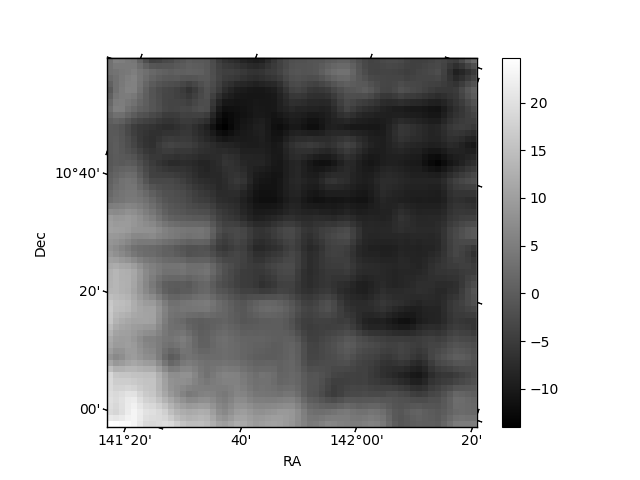
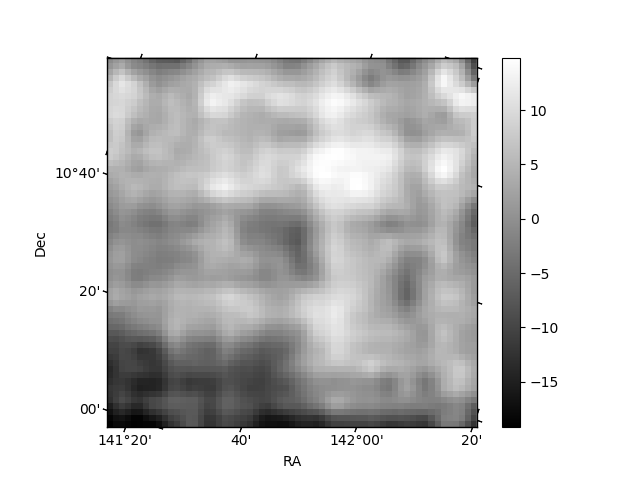
Histogram calculated using DETX and DETY for each event in the final _common_clean file
| Quadrant A | 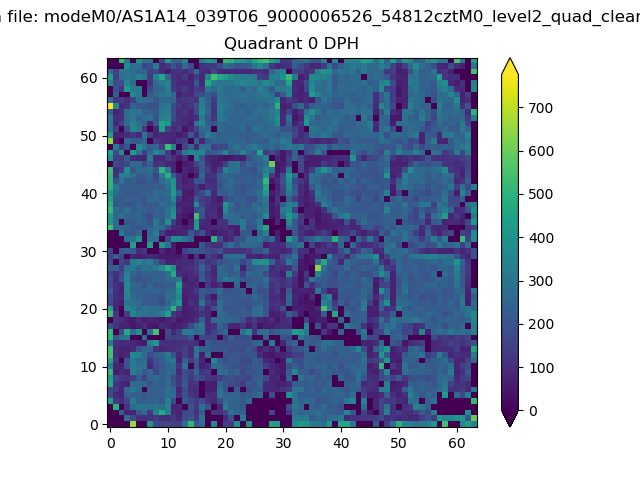 |
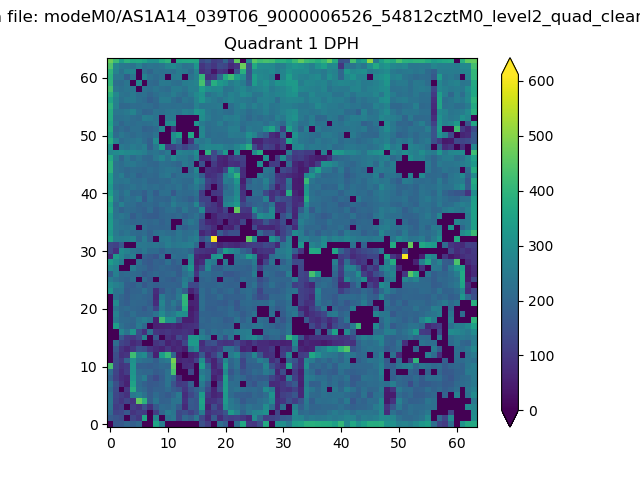 |
Quadrant B |
|---|---|---|---|
| Quadrant D | 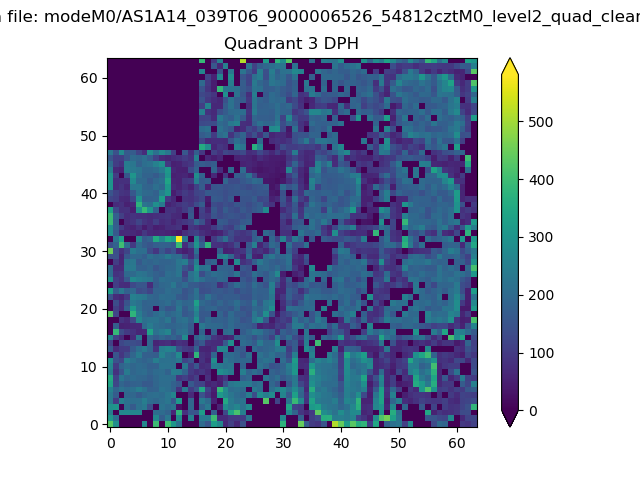 |
 |
Quadrant C |
| Plot type | Count rate plots | Images |
|---|---|---|
| Comparison with Poisson distribution Blue bars denote a histogram of data divided into 1 sec bins. Red curve is a Poisson curve with rate = median count rate of data. |
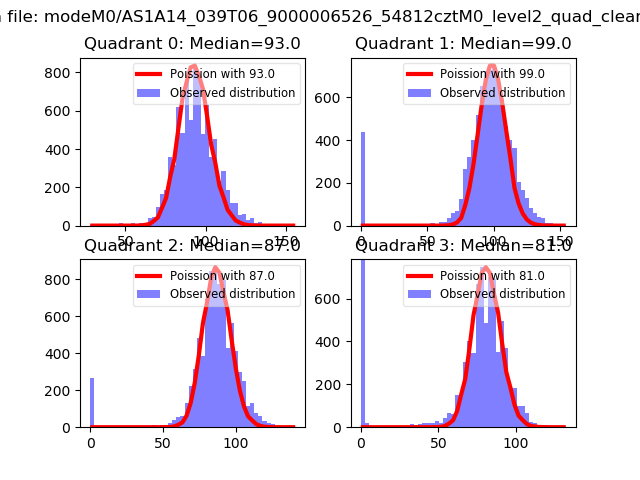 |
 |
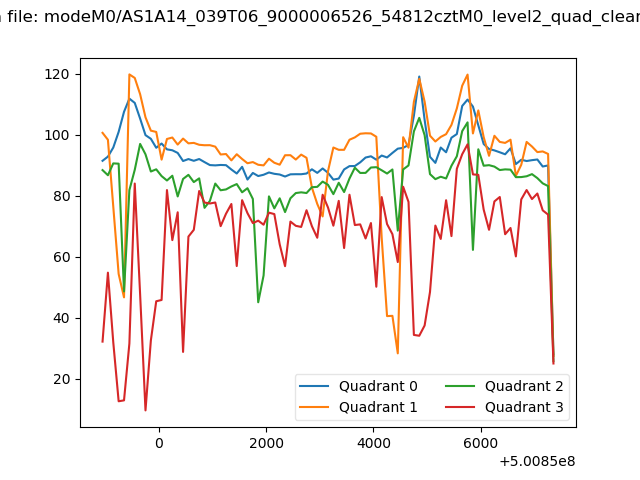
| Quadrant-wise count rates Data is divided into 100 sec bins |
 |
|
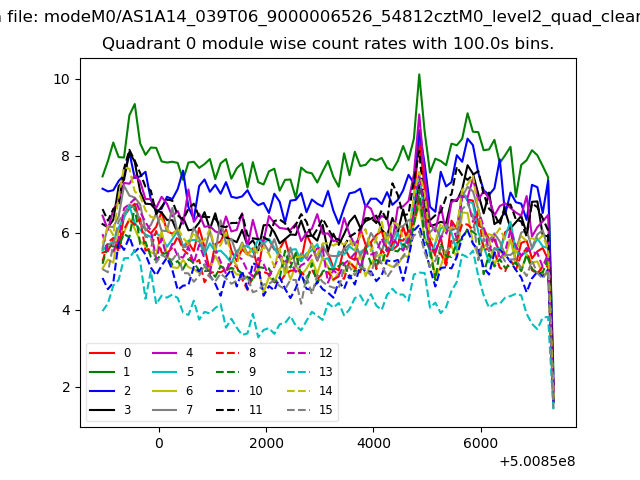
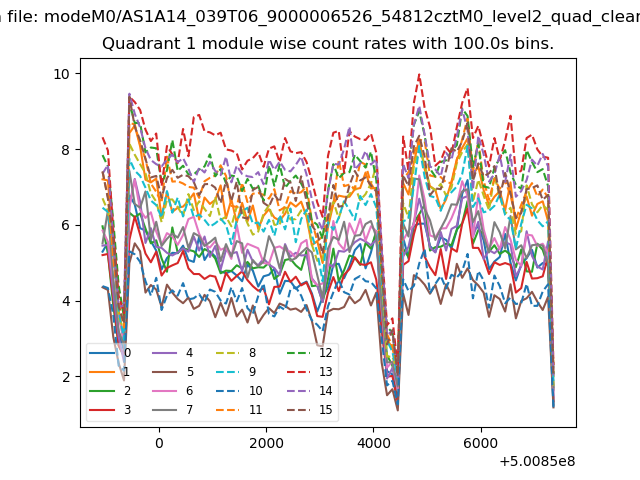
| Module-wise count rates for Quadrant A Data is divided into 100 sec bins |
 |
 |
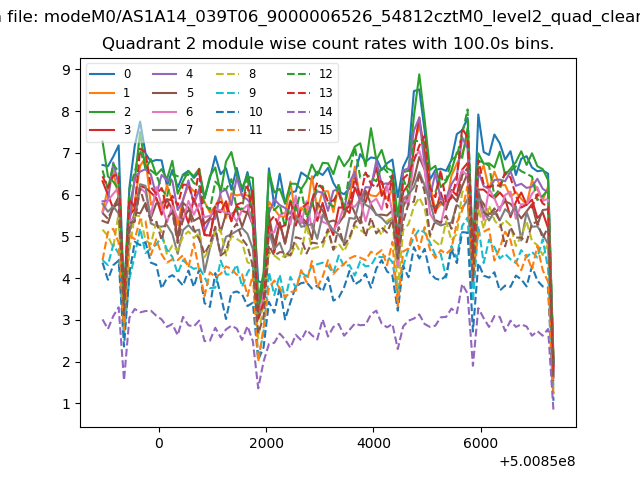
| Module-wise count rates for Quadrant B Data is divided into 100 sec bins |
 |
 |
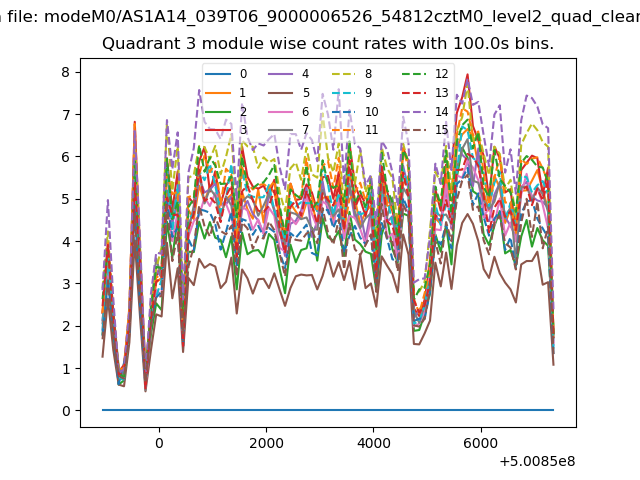
| Module-wise count rates for Quadrant C Data is divided into 100 sec bins |
 |
 |
| Module-wise count rates for Quadrant D Data is divided into 100 sec bins |
 |
 |
| Parameter | Plot |
|---|---|
| CZT HV Monitor | 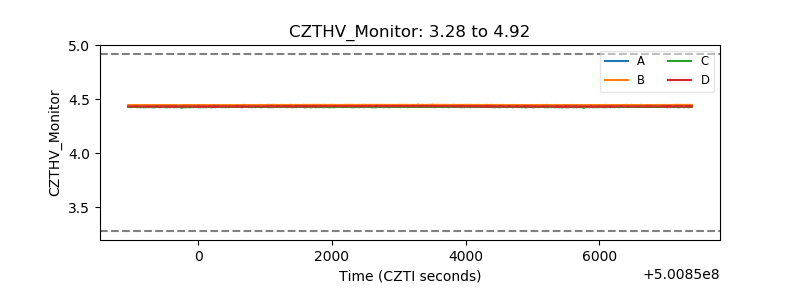 |
| D_VDD | 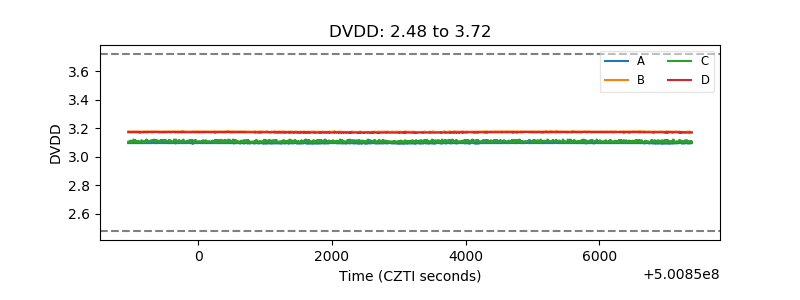 |
| Temperature 1 | 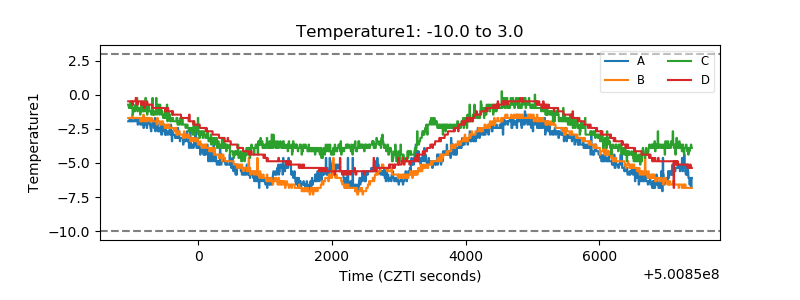 |
| Veto HV Monitor | 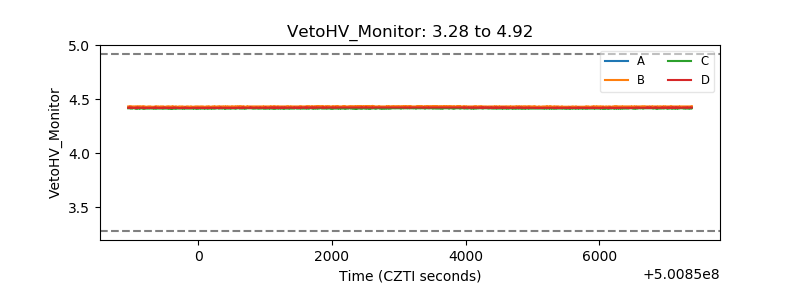 |
| Veto LLD | 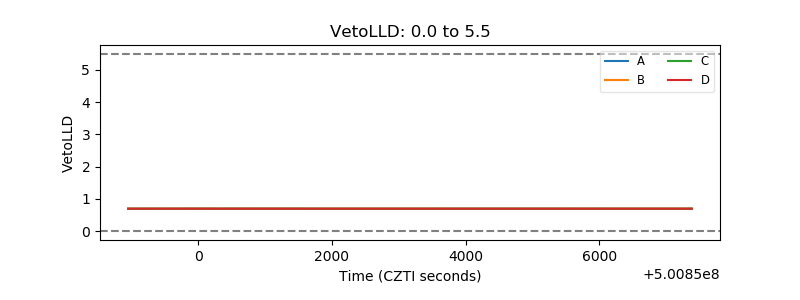 |
| Alpha Counter | 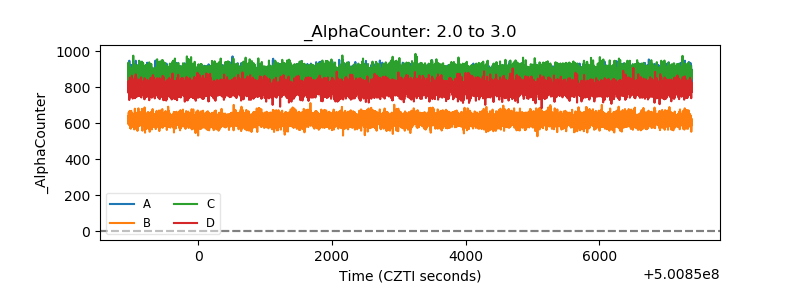 |
| _CPM_Rate | 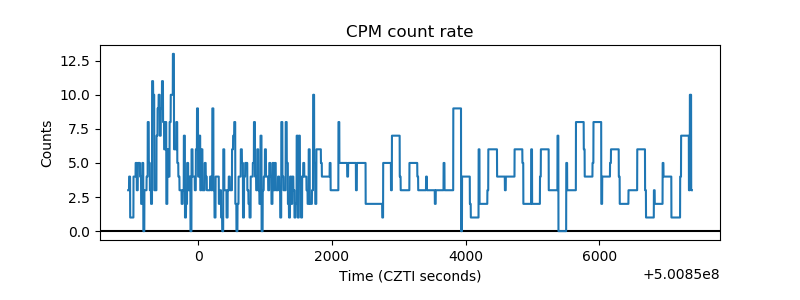 |
| CZT Counter | 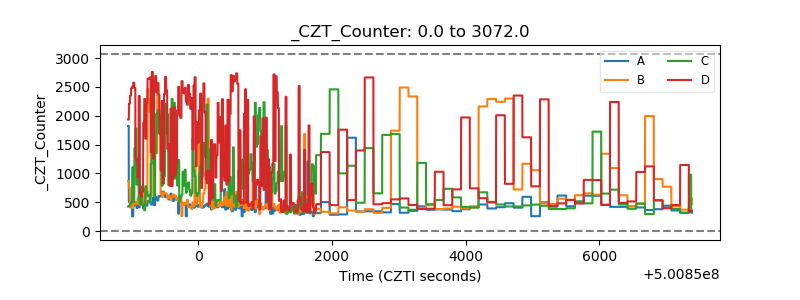 |
| +2.5 Volts monitor |  |
| +5 Volts monitor |  |
| _ROLL_ROT | 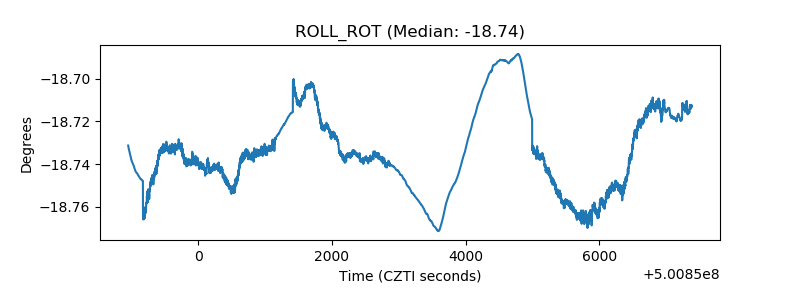 |
| _Roll_DEC | 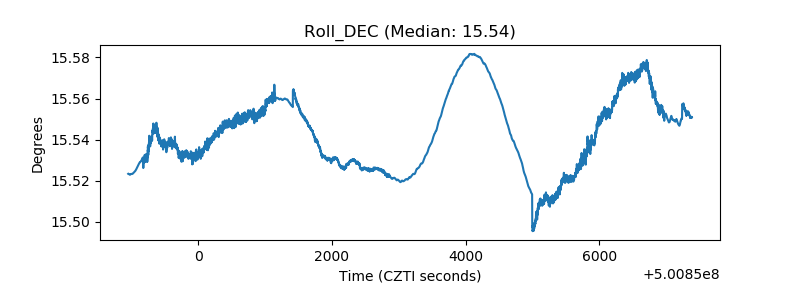 |
| _Roll_RA | 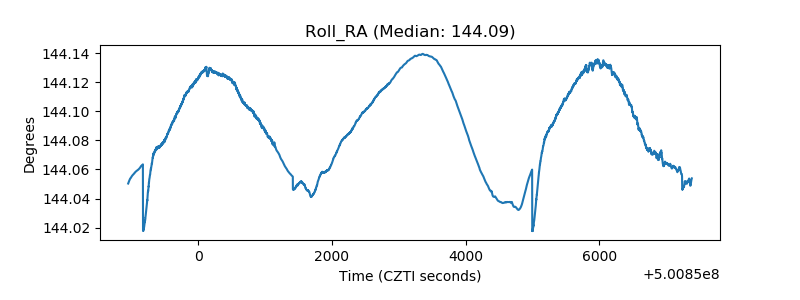 |
| Veto Counter | 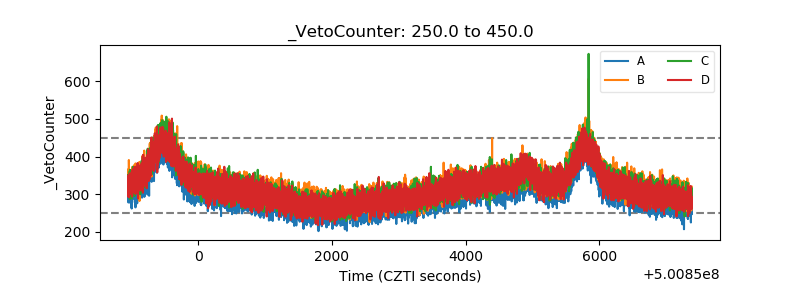 |