| Param | Original file | Final file |
|---|---|---|
| Filename | modeM0/AS1A14_039T06_9000006526_54816cztM0_level2.fits | modeM0/AS1A14_039T06_9000006526_54816cztM0_level2_quad_clean.evt |
| Size (bytes) | 763,496,640 | 118,730,880 |
| Size | 728.1 MB | 113.2 MB |
| Events in quadrant A | 3,817,725 | 837,898 |
| Events in quadrant B | 5,108,317 | 851,335 |
| Events in quadrant C | 5,905,032 | 785,659 |
| Events in quadrant D | 12,724,755 | 488,431 |
| Mode M9 | |||
|---|---|---|---|
| Quadrant | BADHDUFLAG | Total packets | Discarded packets |
| A | 0 | 12 | 0 |
| B | 0 | 12 | 0 |
| C | 0 | 12 | 0 |
| D | 0 | 12 | 0 |
| Mode M0 | |||
|---|---|---|---|
| Quadrant | BADHDUFLAG | Total packets | Discarded packets |
| A | 0 | 18729 | 3 |
| B | 0 | 22278 | 5 |
| C | 0 | 24070 | 2 |
| D | 0 | 44290 | 5 |
| Mode SS | |||
|---|---|---|---|
| Quadrant | BADHDUFLAG | Total packets | Discarded packets |
| A | 0 | 186 | 0 |
| B | 0 | 186 | 0 |
| C | 0 | 186 | 0 |
| D | 0 | 186 | 0 |
| Quadrant | Total seconds | Saturated seconds | Saturation percentage |
|---|---|---|---|
| A | 9099 | 71 | 0.780306% |
| B | 9098 | 537 | 5.902396% |
| C | 9101 | 183 | 2.010768% |
| D | 9100 | 3464 | 38.065934% |
Noise dominated data is calculated using 1-second bins in cleaned event files. If a bin has >2000 counts, and if more than 50% of those come from <1% of pixels, then it is considered to be noise-dominated and hence unusable.
| Quadrant | # 1 sec bins | Bins with >0 counts | Bins with >2000 counts | High rate bins dominated by noise | Noise dominated (total time) | Noise dominated (detector-on time) | Marked lightcurve |
|---|---|---|---|---|---|---|---|
| A | 10334 | 9099 | 7 | 7 | 0.07% | 0.08% | 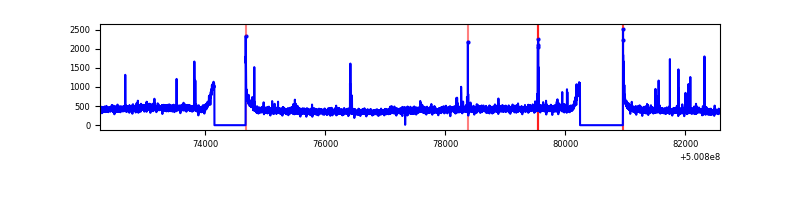 |
| B | 10334 | 9098 | 317 | 317 | 3.07% | 3.48% | 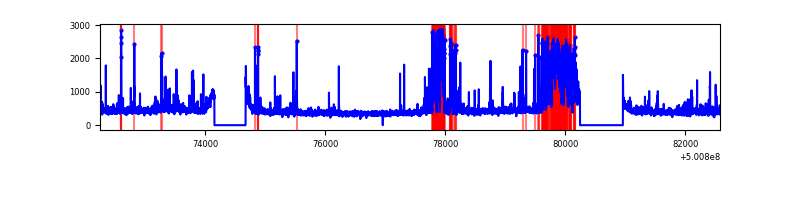 |
| C | 10335 | 9100 | 135 | 135 | 1.31% | 1.48% | 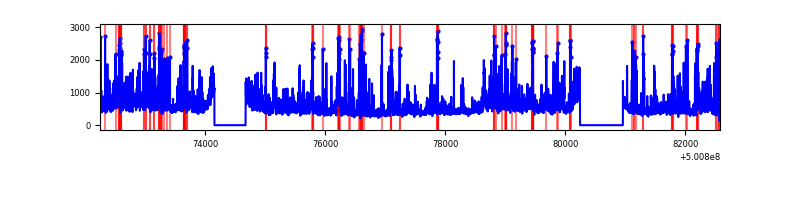 |
| D | 10335 | 9099 | 3391 | 3391 | 32.81% | 37.27% | 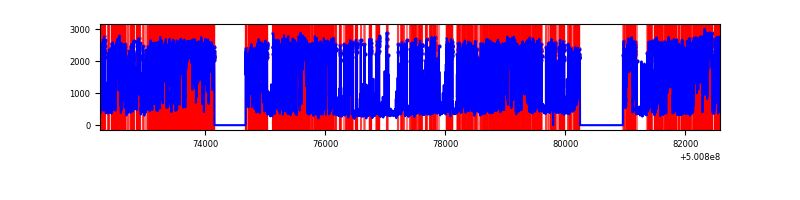 |
Top three noisy pixels from each quadrant. If the there are fewer than three noisy pixels in the level2.evt file, extra rows are filled as -1
| Pixel properties | Quadrant properties | ||||||
|---|---|---|---|---|---|---|---|
| Quadrant | DetID | PixID | Counts | Sigma | Mean | Median | Sigma |
| A | 13 | 254 | 18599 | 75.02 | 954 | 929 | 235.5 |
| A | 8 | 9 | 18527 | 74.72 | 954 | 929 | 235.5 |
| A | 12 | 15 | 14748 | 58.67 | 954 | 929 | 235.5 |
| B | 5 | 185 | 1246599 | 6180.42 | 926 | 894 | 201.6 |
| B | 10 | 247 | 78213 | 383.61 | 926 | 894 | 201.6 |
| B | 2 | 249 | 76983 | 377.51 | 926 | 894 | 201.6 |
| C | 4 | 5 | 1040313 | 4104.16 | 918 | 907 | 253.3 |
| C | 9 | 38 | 580865 | 2290.0 | 918 | 907 | 253.3 |
| C | 12 | 252 | 286932 | 1129.39 | 918 | 907 | 253.3 |
| D | 15 | 94 | 8832358 | 42105.49 | 725 | 692 | 209.8 |
| D | 11 | 176 | 326148 | 1551.63 | 725 | 692 | 209.8 |
| D | 3 | 12 | 278254 | 1323.29 | 725 | 692 | 209.8 |
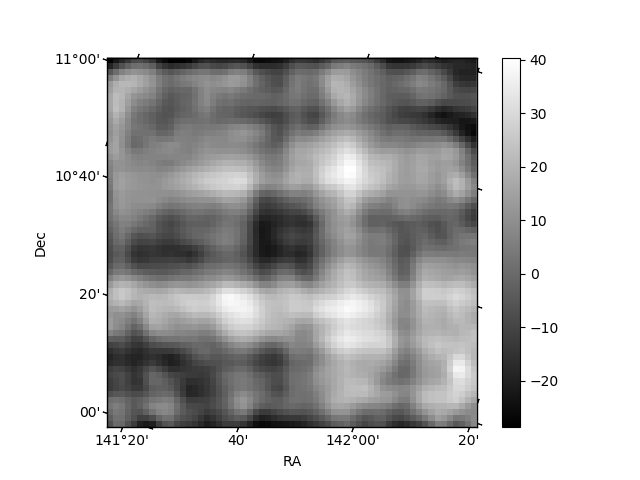
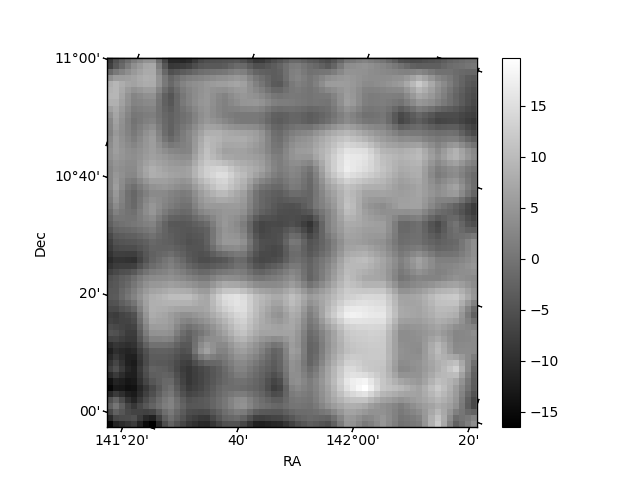
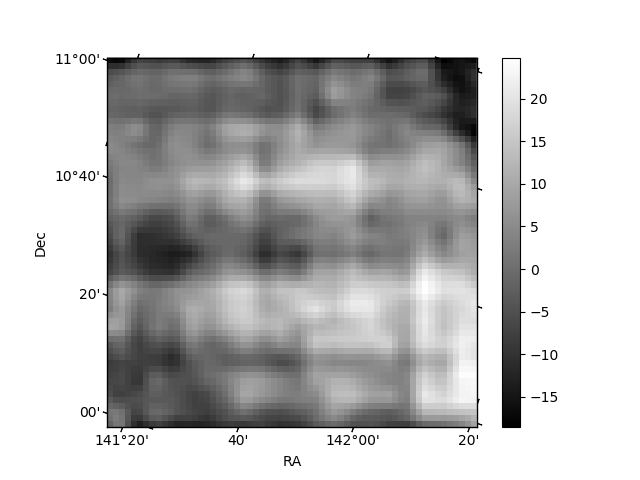
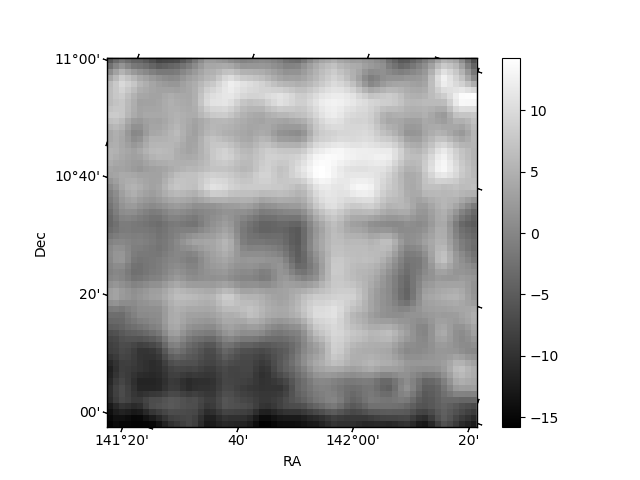
Histogram calculated using DETX and DETY for each event in the final _common_clean file
| Quadrant A | 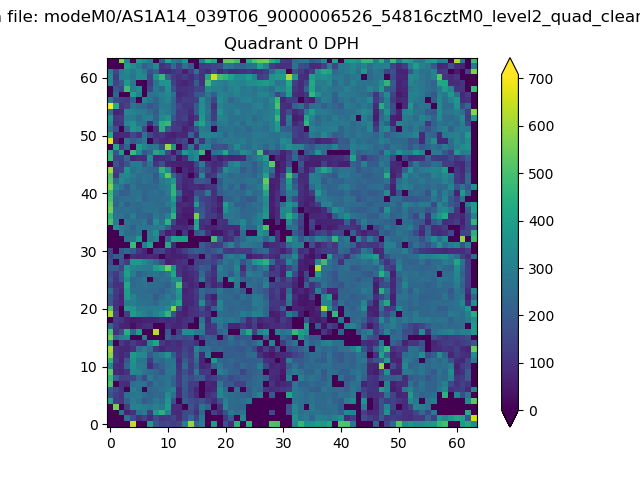 |
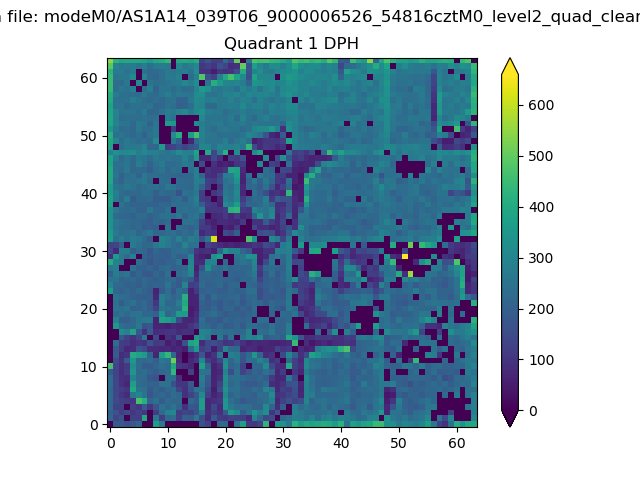 |
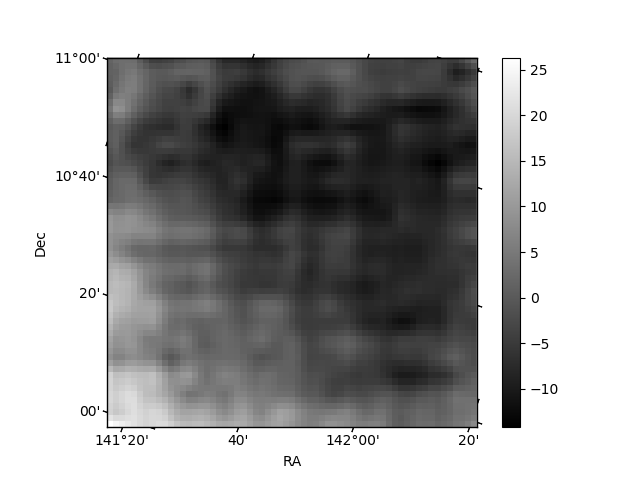
Quadrant B |
|---|---|---|---|
| Quadrant D | 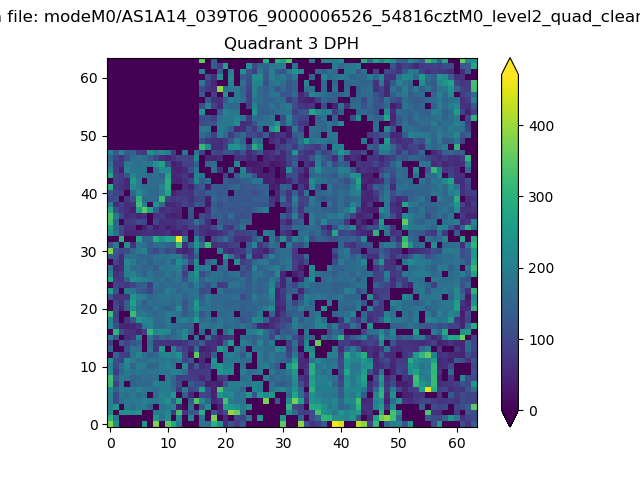 |
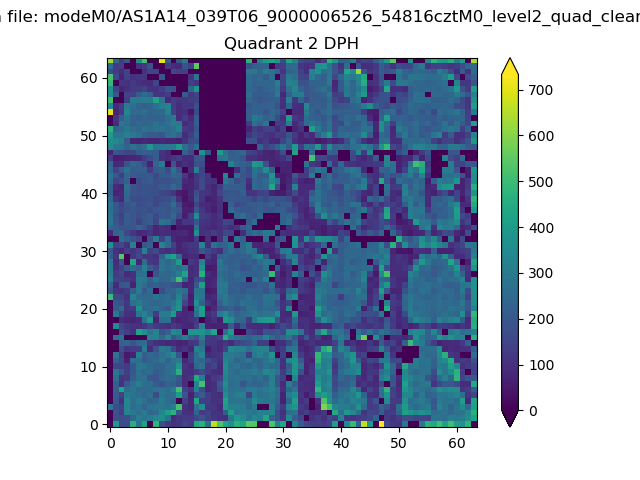 |
Quadrant C |
| Plot type | Count rate plots | Images |
|---|---|---|
| Comparison with Poisson distribution Blue bars denote a histogram of data divided into 1 sec bins. Red curve is a Poisson curve with rate = median count rate of data. |
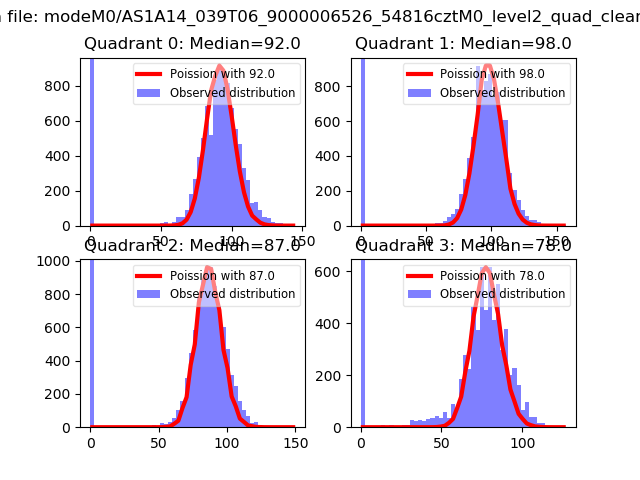 |
 |
| Quadrant-wise count rates Data is divided into 100 sec bins |
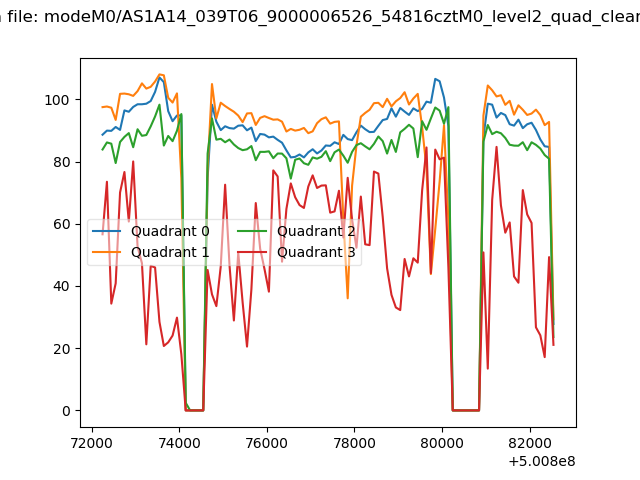 |
|
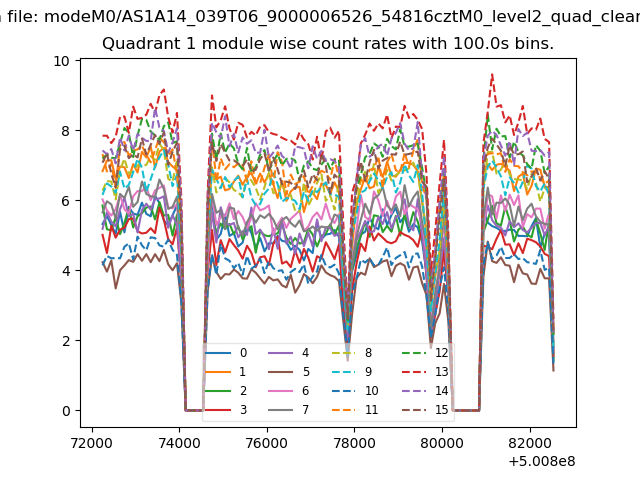
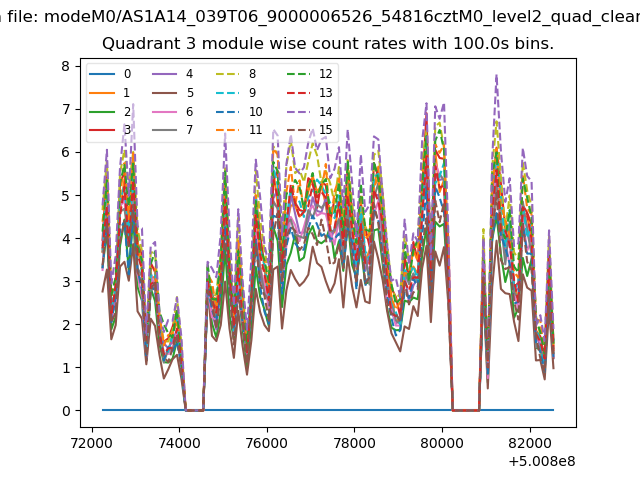
| Module-wise count rates for Quadrant A Data is divided into 100 sec bins |
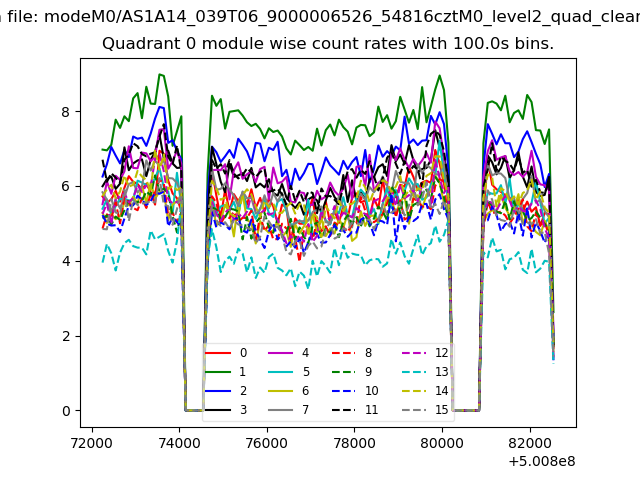 |
 |
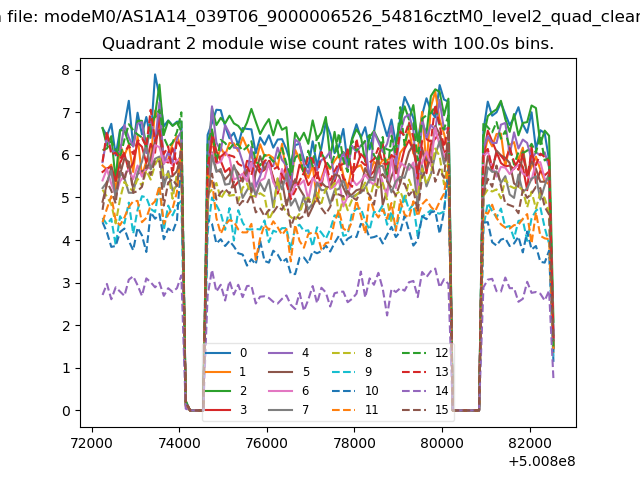
| Module-wise count rates for Quadrant B Data is divided into 100 sec bins |
 |
 |
| Module-wise count rates for Quadrant C Data is divided into 100 sec bins |
 |
 |
| Module-wise count rates for Quadrant D Data is divided into 100 sec bins |
 |
 |
| Parameter | Plot |
|---|---|
| CZT HV Monitor | 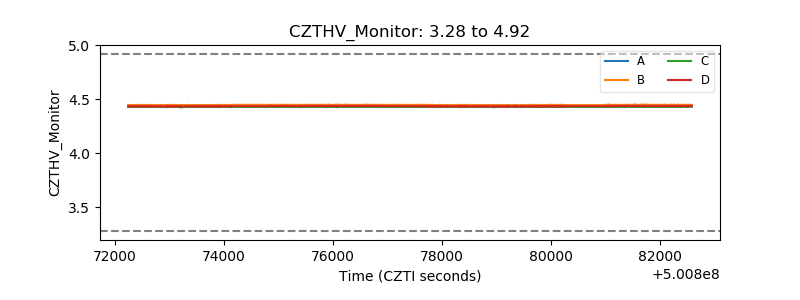 |
| D_VDD | 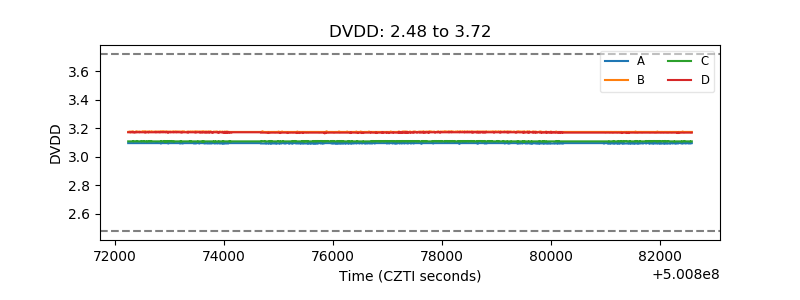 |
| Temperature 1 | 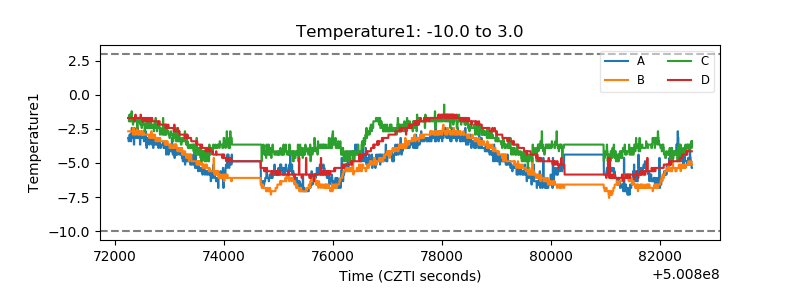 |
| Veto HV Monitor | 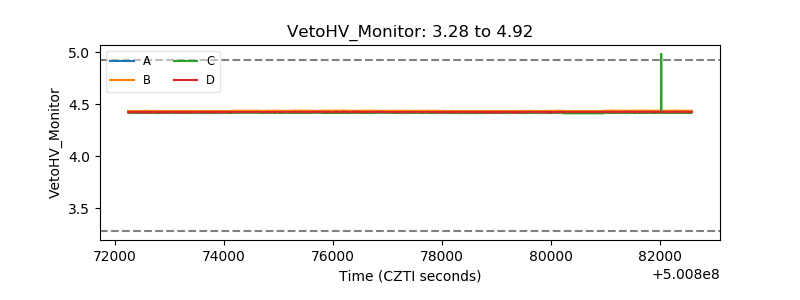 |
| Veto LLD | 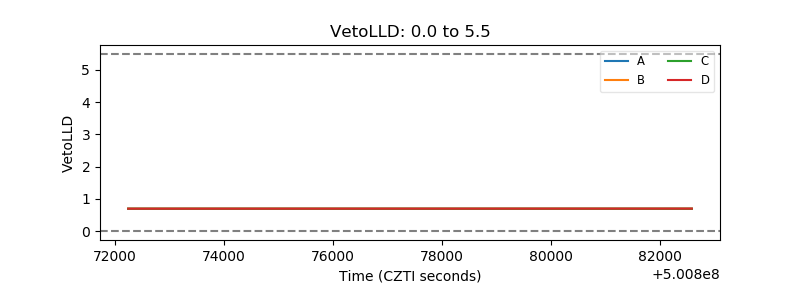 |
| Alpha Counter | 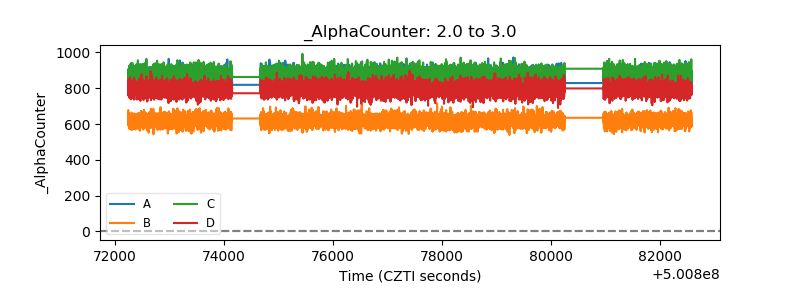 |
| _CPM_Rate | 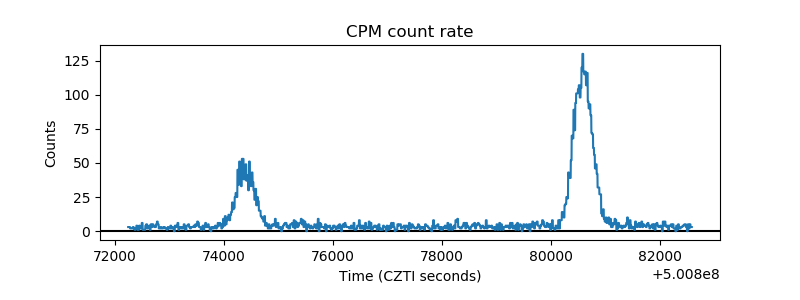 |
| CZT Counter | 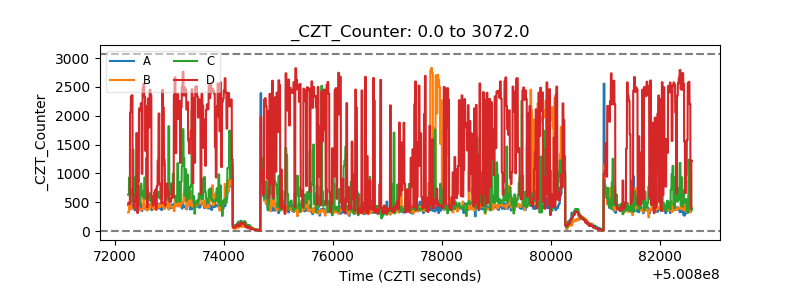 |
| +2.5 Volts monitor |  |
| +5 Volts monitor | 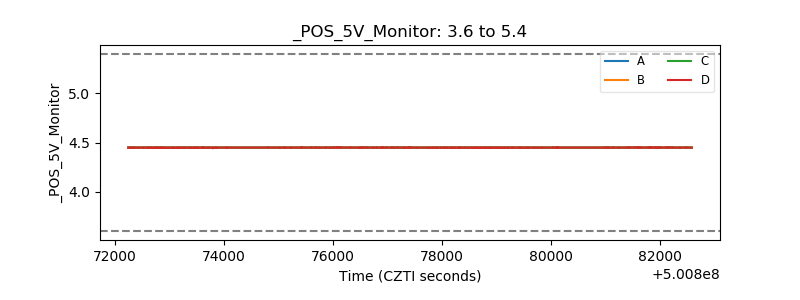 |
| _ROLL_ROT | 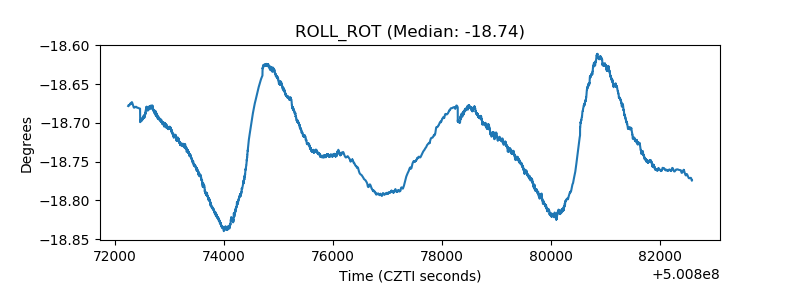 |
| _Roll_DEC | 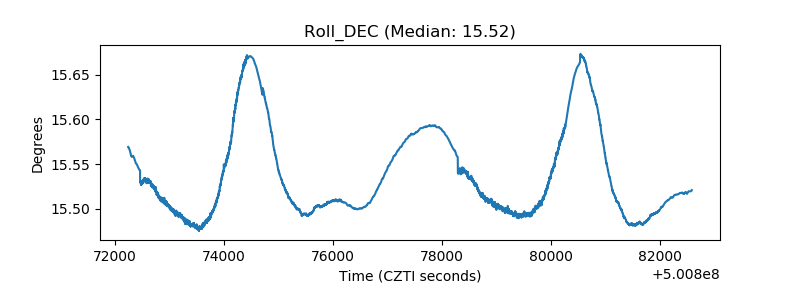 |
| _Roll_RA | 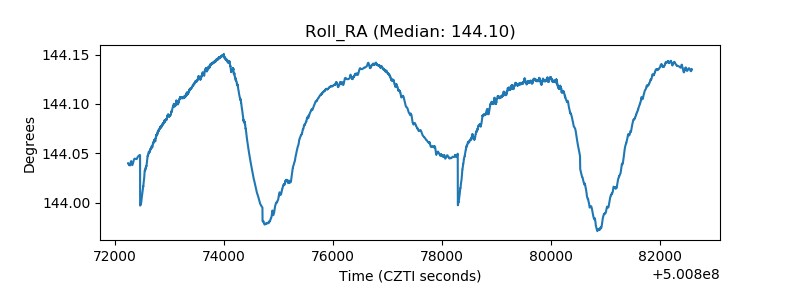 |
| Veto Counter | 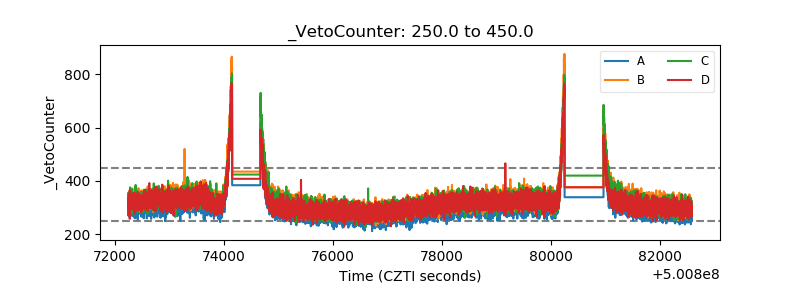 |