| Param | Original file | Final file |
|---|---|---|
| Filename | modeM0/AS1A14_039T06_9000006526_54817cztM0_level2.fits | modeM0/AS1A14_039T06_9000006526_54817cztM0_level2_quad_clean.evt |
| Size (bytes) | 37,552,320 | 4,127,040 |
| Size | 35.8 MB | 3.9 MB |
| Events in quadrant A | 131,088 | 29,341 |
| Events in quadrant B | 159,548 | 32,327 |
| Events in quadrant C | 305,543 | 27,574 |
| Events in quadrant D | 763,147 | 3,285 |
| Mode M0 | |||
|---|---|---|---|
| Quadrant | BADHDUFLAG | Total packets | Discarded packets |
| A | 0 | 697 | 0 |
| B | 0 | 740 | 0 |
| C | 0 | 1144 | 0 |
| D | 0 | 2510 | 0 |
| Mode SS | |||
|---|---|---|---|
| Quadrant | BADHDUFLAG | Total packets | Discarded packets |
| A | 0 | 8 | 0 |
| B | 0 | 8 | 0 |
| C | 0 | 8 | 0 |
| D | 0 | 8 | 0 |
| Quadrant | Total seconds | Saturated seconds | Saturation percentage |
|---|---|---|---|
| A | 349 | 0 | 0.000000% |
| B | 350 | 0 | 0.000000% |
| C | 349 | 11 | 3.151862% |
| D | 349 | 268 | 76.790831% |
Noise dominated data is calculated using 1-second bins in cleaned event files. If a bin has >2000 counts, and if more than 50% of those come from <1% of pixels, then it is considered to be noise-dominated and hence unusable.
| Quadrant | # 1 sec bins | Bins with >0 counts | Bins with >2000 counts | High rate bins dominated by noise | Noise dominated (total time) | Noise dominated (detector-on time) | Marked lightcurve |
|---|---|---|---|---|---|---|---|
| A | 349 | 349 | 0 | 0 | 0.00% | 0.00% | 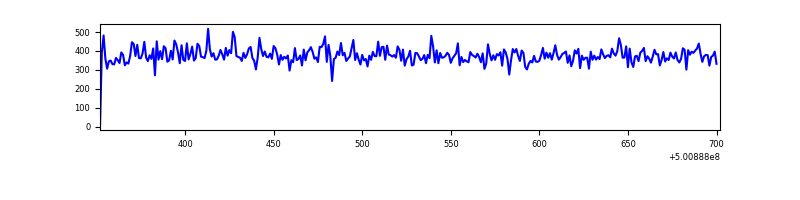 |
| B | 350 | 350 | 0 | 0 | 0.00% | 0.00% | 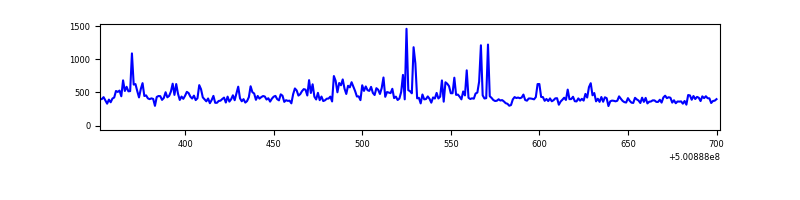 |
| C | 349 | 349 | 17 | 17 | 4.87% | 4.87% | 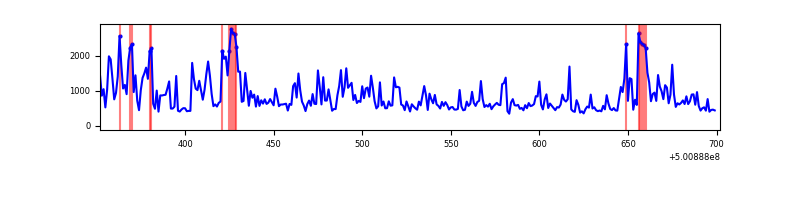 |
| D | 349 | 349 | 265 | 265 | 75.93% | 75.93% | 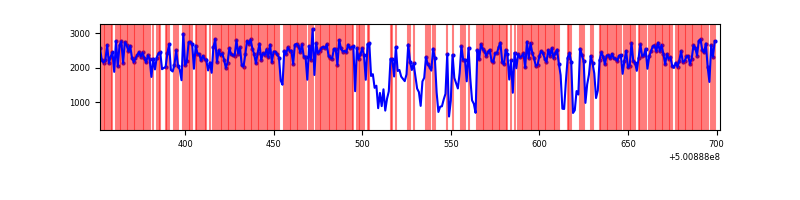 |
Top three noisy pixels from each quadrant. If the there are fewer than three noisy pixels in the level2.evt file, extra rows are filled as -1
| Pixel properties | Quadrant properties | ||||||
|---|---|---|---|---|---|---|---|
| Quadrant | DetID | PixID | Counts | Sigma | Mean | Median | Sigma |
| A | 13 | 254 | 688 | 64.01 | 33 | 32 | 10.2 |
| A | 3 | 137 | 351 | 31.13 | 33 | 32 | 10.2 |
| A | 0 | 226 | 256 | 21.86 | 33 | 32 | 10.2 |
| B | 2 | 249 | 23053 | 2526.47 | 33 | 32 | 9.1 |
| B | 10 | 245 | 4606 | 501.98 | 33 | 32 | 9.1 |
| B | 12 | 111 | 881 | 93.17 | 33 | 32 | 9.1 |
| C | 4 | 5 | 84995 | 8085.51 | 32 | 31 | 10.5 |
| C | 9 | 38 | 35615 | 3386.32 | 32 | 31 | 10.5 |
| C | 6 | 223 | 33046 | 3141.84 | 32 | 31 | 10.5 |
| D | 15 | 94 | 638426 | 102266.91 | 16 | 15 | 6.2 |
| D | 1 | 31 | 38663 | 6191.01 | 16 | 15 | 6.2 |
| D | 15 | 93 | 7115 | 1137.35 | 16 | 15 | 6.2 |
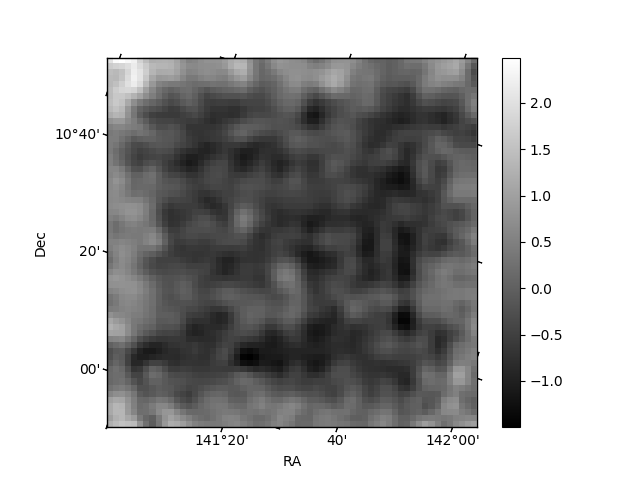
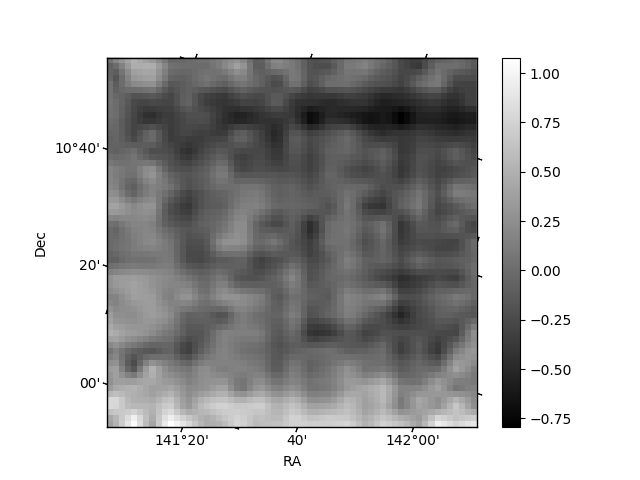
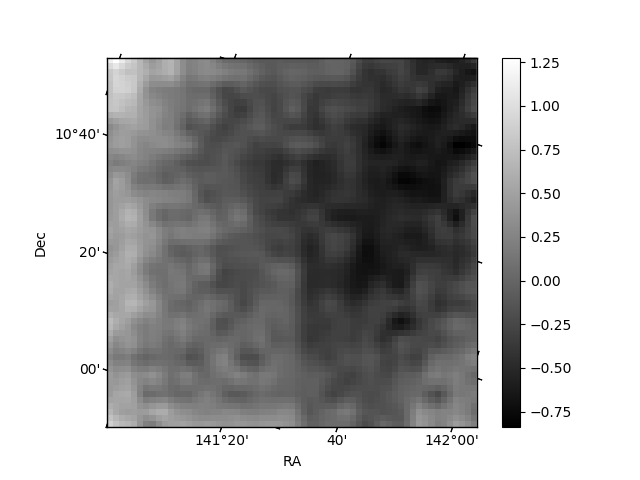
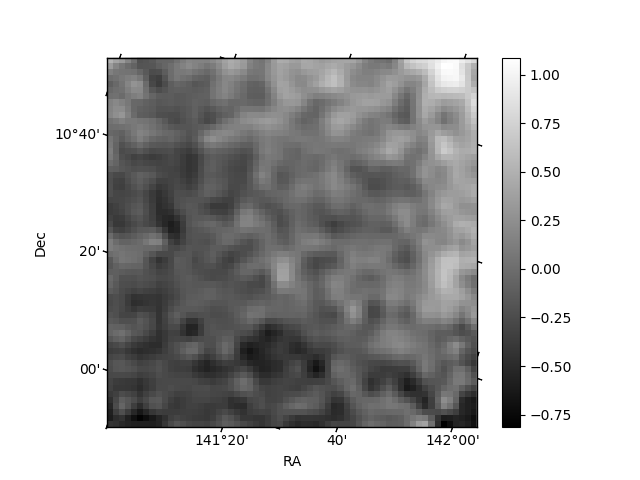
Histogram calculated using DETX and DETY for each event in the final _common_clean file
| Quadrant A | 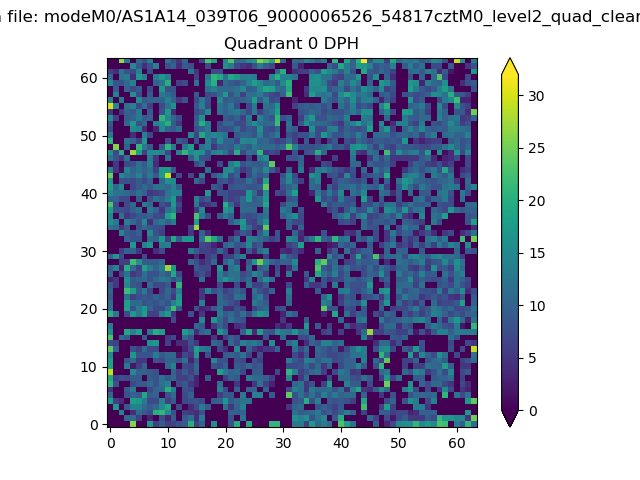 |
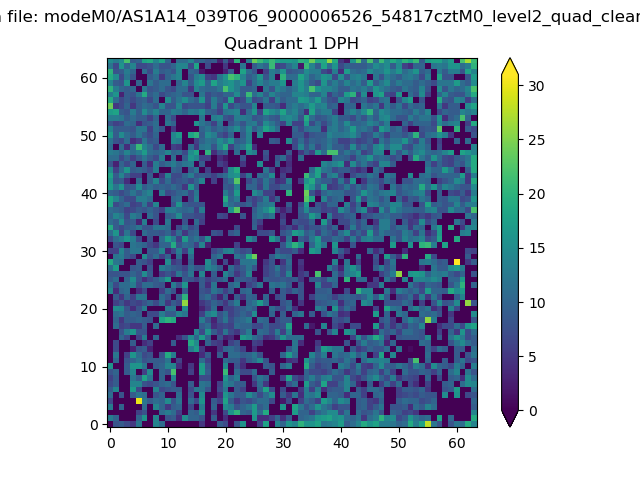 |
Quadrant B |
|---|---|---|---|
| Quadrant D | 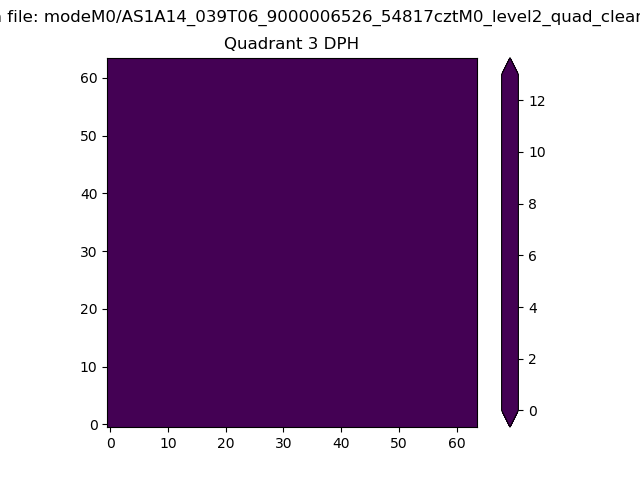 |
 |
Quadrant C |
| Plot type | Count rate plots | Images |
|---|---|---|
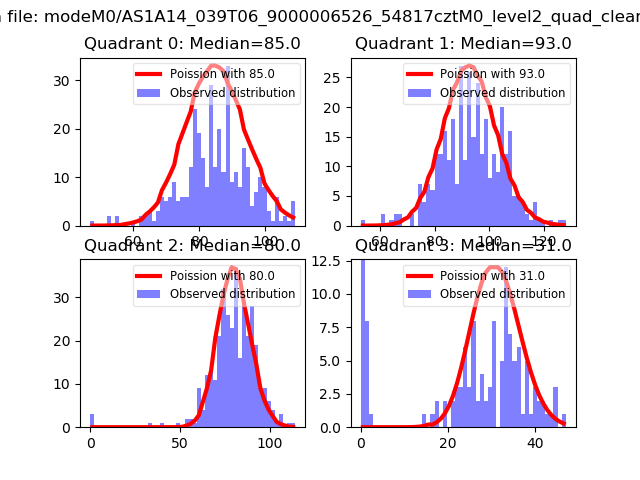
| Comparison with Poisson distribution Blue bars denote a histogram of data divided into 1 sec bins. Red curve is a Poisson curve with rate = median count rate of data. |
 |
 |
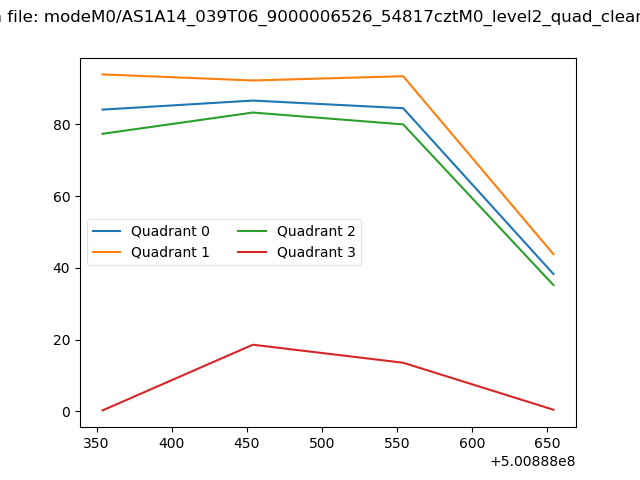
| Quadrant-wise count rates Data is divided into 100 sec bins |
 |
|
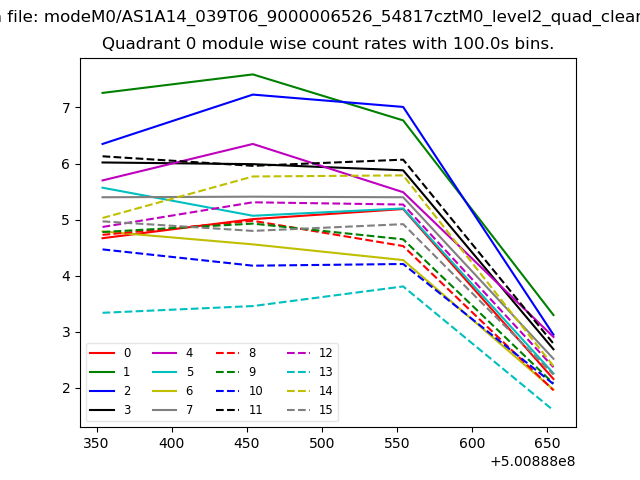
| Module-wise count rates for Quadrant A Data is divided into 100 sec bins |
 |
 |
| Module-wise count rates for Quadrant B Data is divided into 100 sec bins |
 |
 |
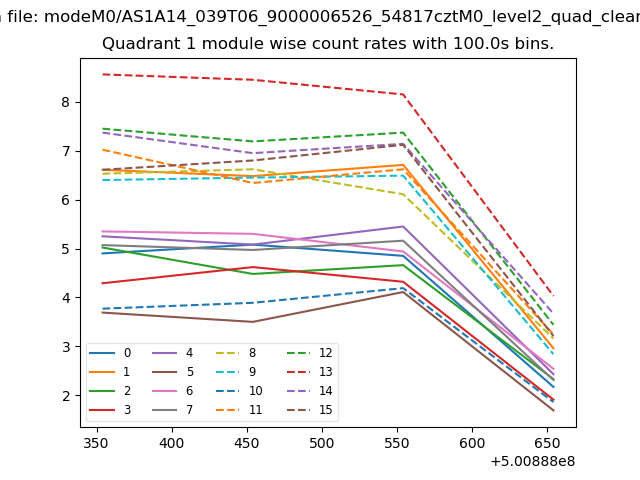
| Module-wise count rates for Quadrant C Data is divided into 100 sec bins |
 |
 |
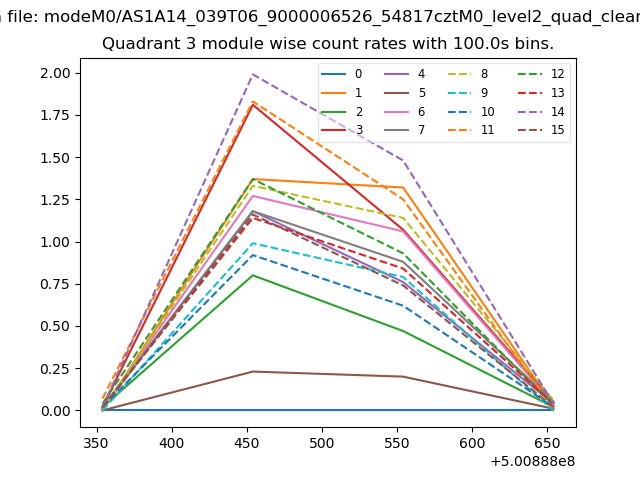
| Module-wise count rates for Quadrant D Data is divided into 100 sec bins |
 |
 |
| Parameter | Plot |
|---|---|
| CZT HV Monitor | 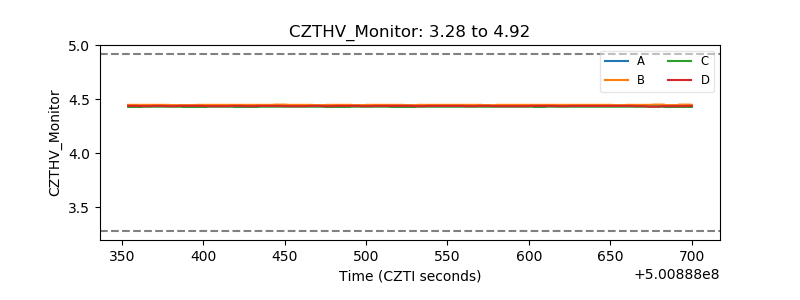 |
| D_VDD | 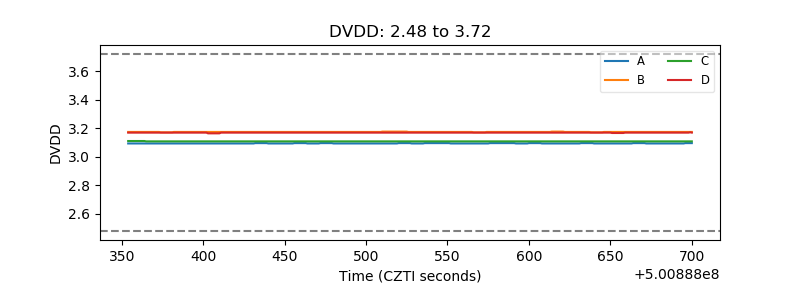 |
| Temperature 1 | 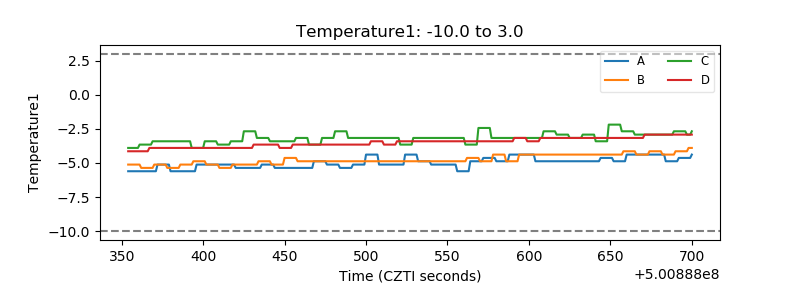 |
| Veto HV Monitor | 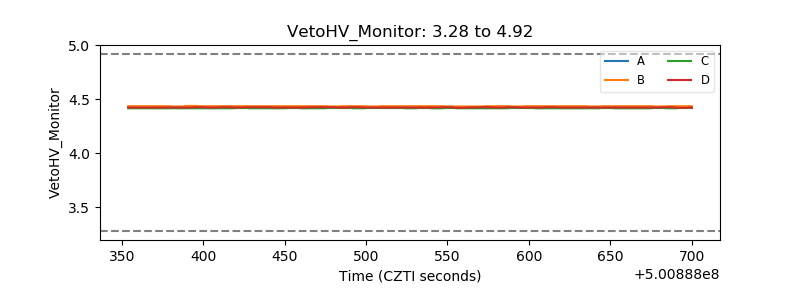 |
| Veto LLD | 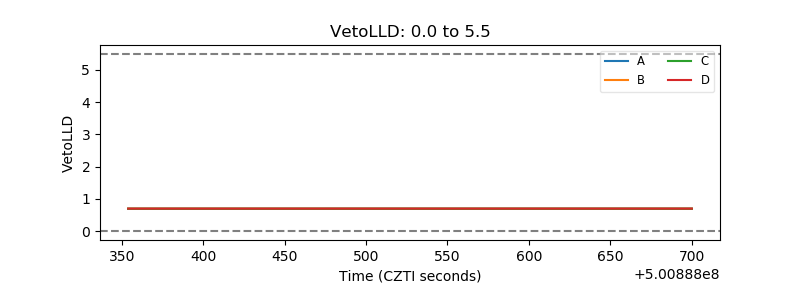 |
| Alpha Counter | 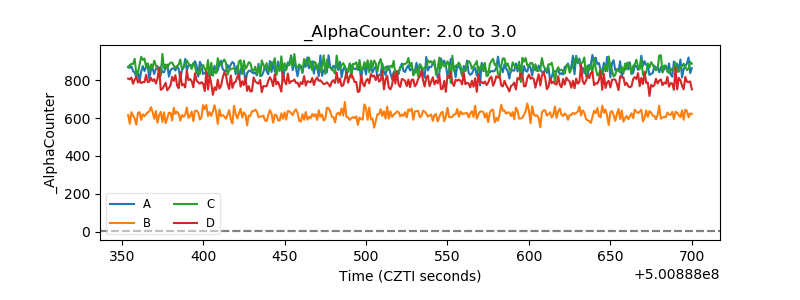 |
| _CPM_Rate | 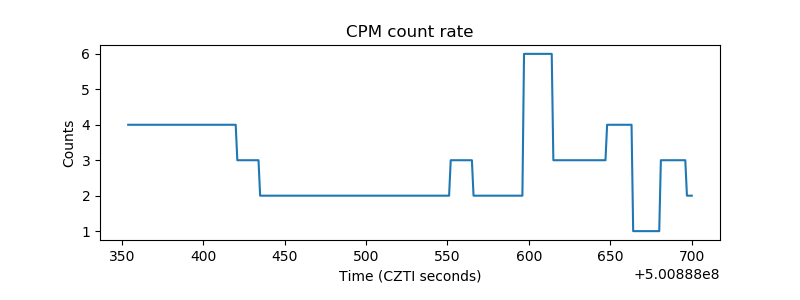 |
| CZT Counter | 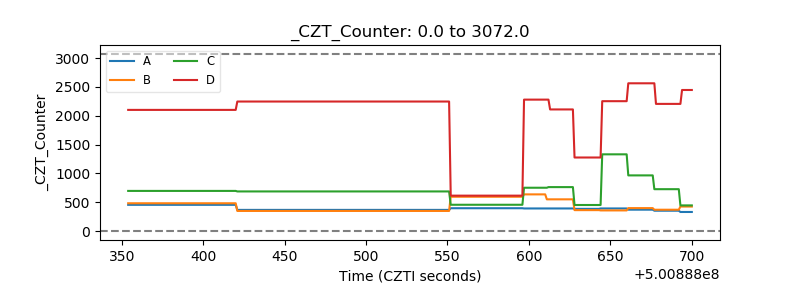 |
| +2.5 Volts monitor |  |
| +5 Volts monitor |  |
| _ROLL_ROT | 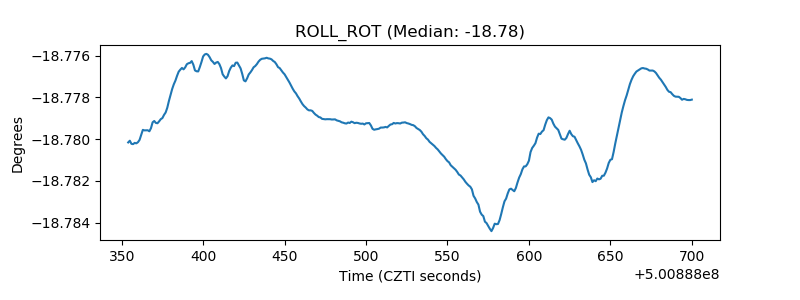 |
| _Roll_DEC | 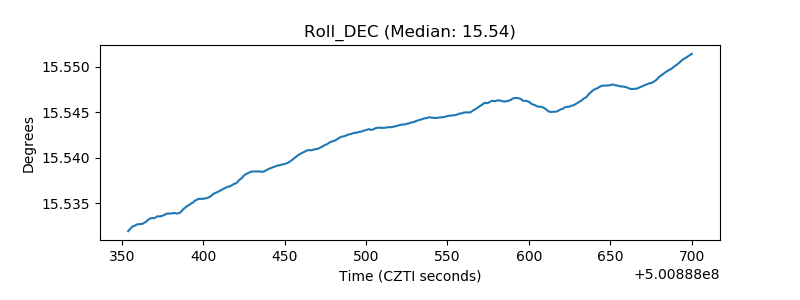 |
| _Roll_RA | 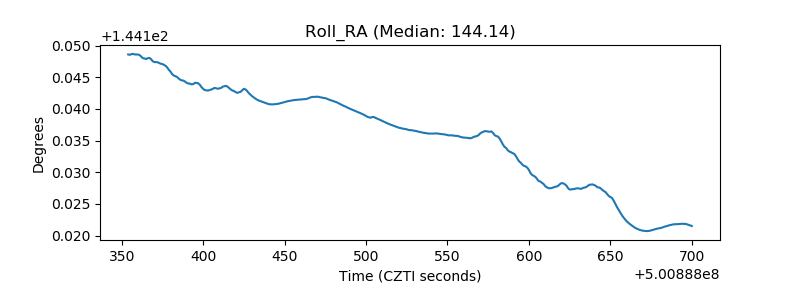 |
| Veto Counter | 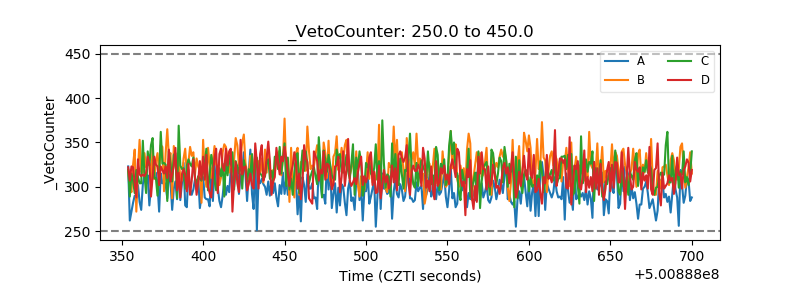 |