| Param | Original file | Final file |
|---|---|---|
| Filename | modeM0/AS1A14_039T06_9000006526_54819cztM0_level2.fits | modeM0/AS1A14_039T06_9000006526_54819cztM0_level2_quad_clean.evt |
| Size (bytes) | 595,051,200 | 84,421,440 |
| Size | 567.5 MB | 80.5 MB |
| Events in quadrant A | 2,616,898 | 603,946 |
| Events in quadrant B | 3,990,244 | 624,833 |
| Events in quadrant C | 4,689,413 | 565,246 |
| Events in quadrant D | 10,236,205 | 318,286 |
| Mode M9 | |||
|---|---|---|---|
| Quadrant | BADHDUFLAG | Total packets | Discarded packets |
| A | 0 | 10 | 0 |
| B | 0 | 10 | 0 |
| C | 0 | 10 | 0 |
| D | 0 | 10 | 0 |
| Mode M0 | |||
|---|---|---|---|
| Quadrant | BADHDUFLAG | Total packets | Discarded packets |
| A | 0 | 12911 | 1 |
| B | 0 | 16381 | 4 |
| C | 0 | 18329 | 1 |
| D | 0 | 34759 | 7 |
| Mode SS | |||
|---|---|---|---|
| Quadrant | BADHDUFLAG | Total packets | Discarded packets |
| A | 0 | 128 | 0 |
| B | 0 | 128 | 0 |
| C | 0 | 128 | 0 |
| D | 0 | 128 | 0 |
| Quadrant | Total seconds | Saturated seconds | Saturation percentage |
|---|---|---|---|
| A | 6360 | 43 | 0.676101% |
| B | 6360 | 265 | 4.166667% |
| C | 6362 | 195 | 3.065074% |
| D | 6361 | 2846 | 44.741393% |
Noise dominated data is calculated using 1-second bins in cleaned event files. If a bin has >2000 counts, and if more than 50% of those come from <1% of pixels, then it is considered to be noise-dominated and hence unusable.
| Quadrant | # 1 sec bins | Bins with >0 counts | Bins with >2000 counts | High rate bins dominated by noise | Noise dominated (total time) | Noise dominated (detector-on time) | Marked lightcurve |
|---|---|---|---|---|---|---|---|
| A | 7356 | 6362 | 0 | 0 | 0.00% | 0.00% | 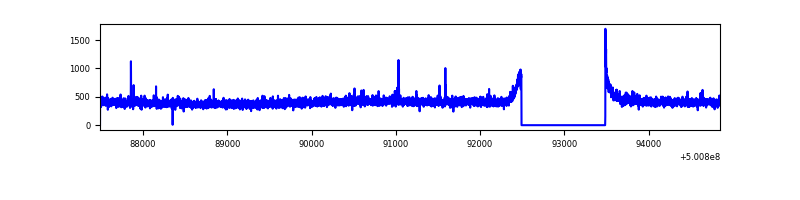 |
| B | 7356 | 6362 | 171 | 171 | 2.32% | 2.69% | 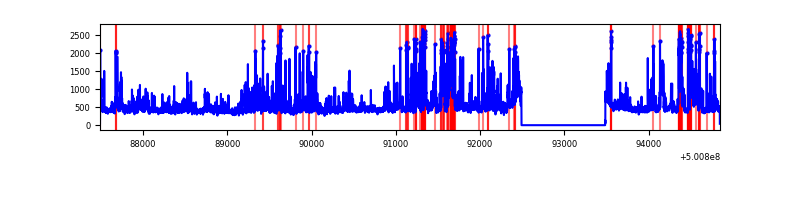 |
| C | 7357 | 6363 | 225 | 225 | 3.06% | 3.54% | 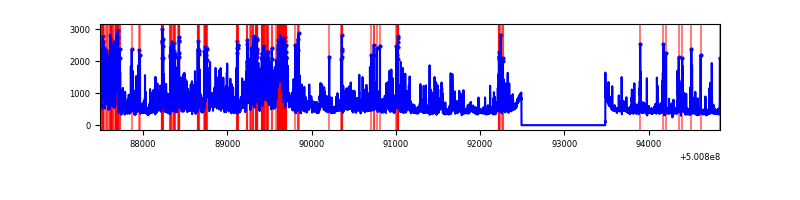 |
| D | 7357 | 6363 | 2749 | 2749 | 37.37% | 43.20% | 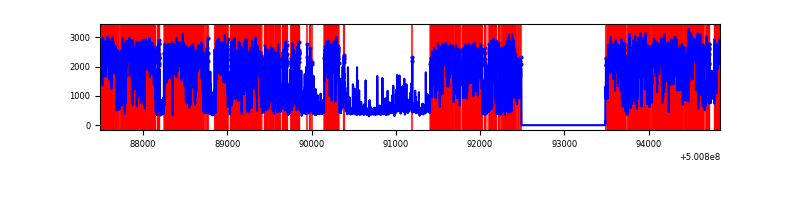 |
Top three noisy pixels from each quadrant. If the there are fewer than three noisy pixels in the level2.evt file, extra rows are filled as -1
| Pixel properties | Quadrant properties | ||||||
|---|---|---|---|---|---|---|---|
| Quadrant | DetID | PixID | Counts | Sigma | Mean | Median | Sigma |
| A | 5 | 241 | 14775 | 85.82 | 666 | 649 | 164.6 |
| A | 13 | 254 | 12495 | 71.97 | 666 | 649 | 164.6 |
| A | 3 | 137 | 7788 | 43.37 | 666 | 649 | 164.6 |
| B | 2 | 249 | 950301 | 6819.2 | 644 | 617 | 139.3 |
| B | 5 | 185 | 300210 | 2151.22 | 644 | 617 | 139.3 |
| B | 10 | 247 | 105953 | 756.36 | 644 | 617 | 139.3 |
| C | 4 | 5 | 747919 | 4262.16 | 637 | 632 | 175.3 |
| C | 9 | 38 | 646705 | 3684.89 | 637 | 632 | 175.3 |
| C | 14 | 254 | 274398 | 1561.43 | 637 | 632 | 175.3 |
| D | 15 | 94 | 5907537 | 43059.68 | 479 | 458 | 137.2 |
| D | 10 | 181 | 1306014 | 9516.86 | 479 | 458 | 137.2 |
| D | 1 | 31 | 526828 | 3836.98 | 479 | 458 | 137.2 |
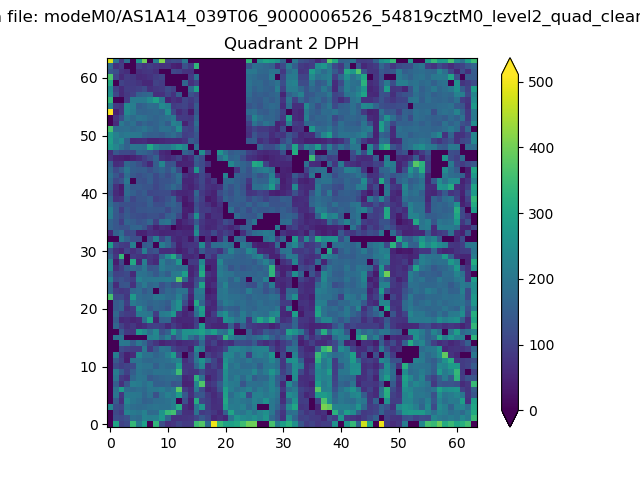
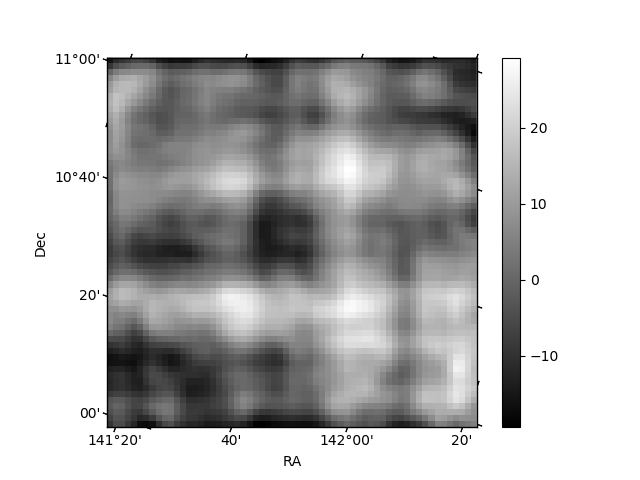
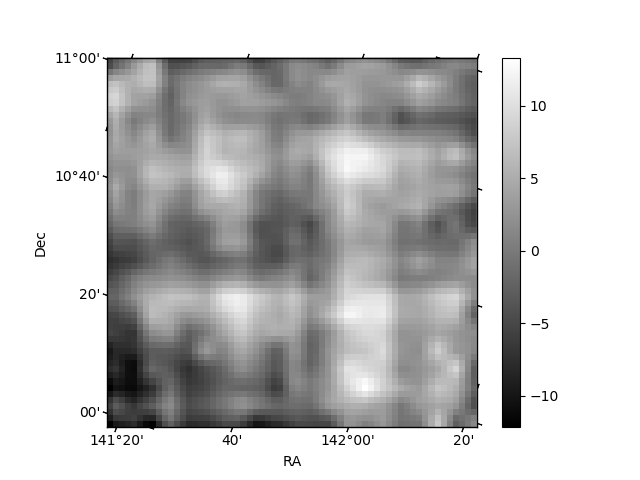
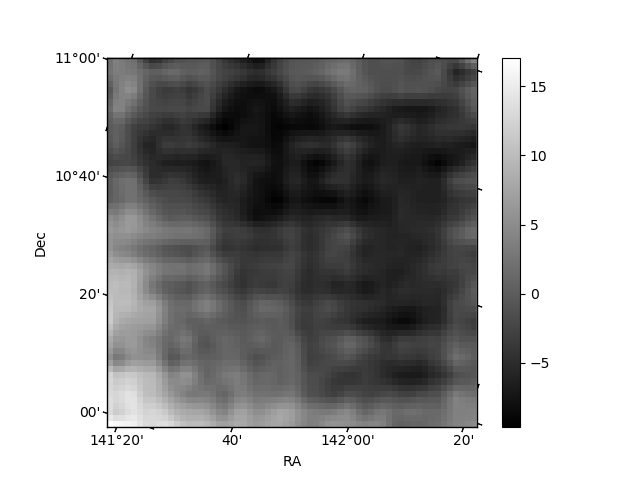
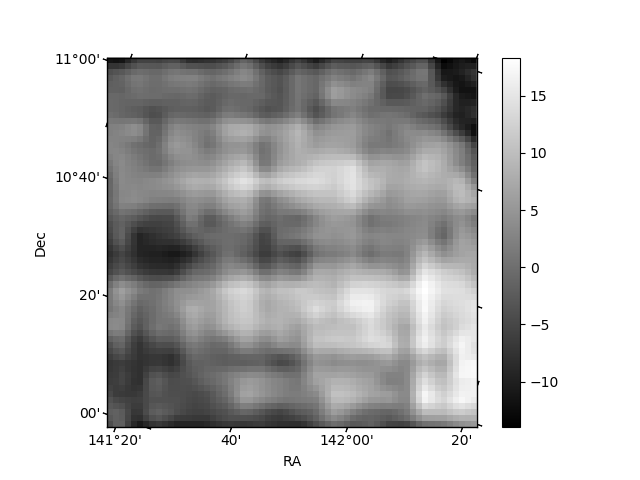
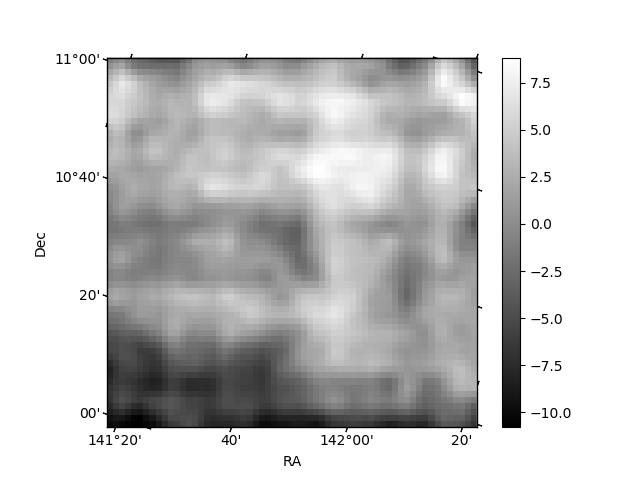
Histogram calculated using DETX and DETY for each event in the final _common_clean file
| Quadrant A | 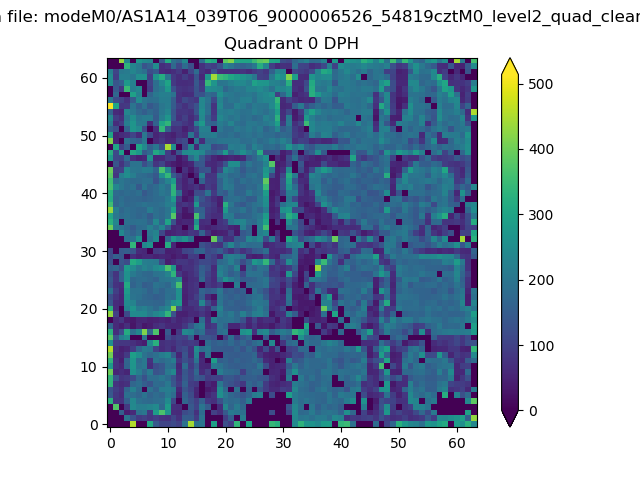 |
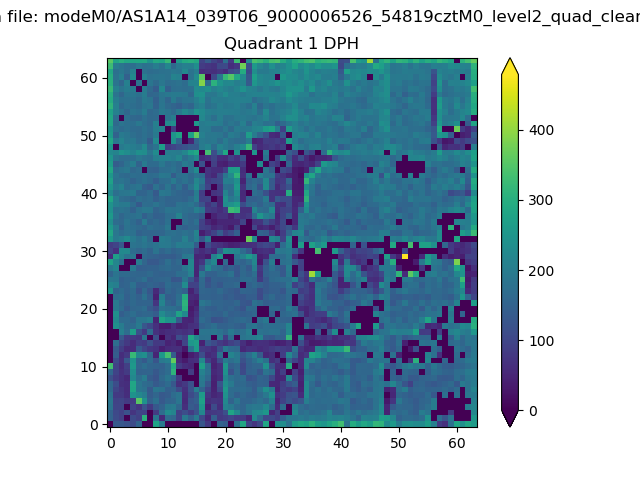 |
Quadrant B |
|---|---|---|---|
| Quadrant D | 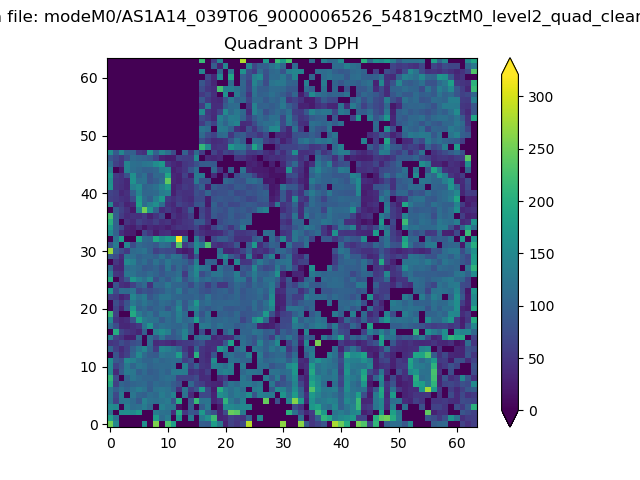 |
 |
Quadrant C |
| Plot type | Count rate plots | Images |
|---|---|---|
| Comparison with Poisson distribution Blue bars denote a histogram of data divided into 1 sec bins. Red curve is a Poisson curve with rate = median count rate of data. |
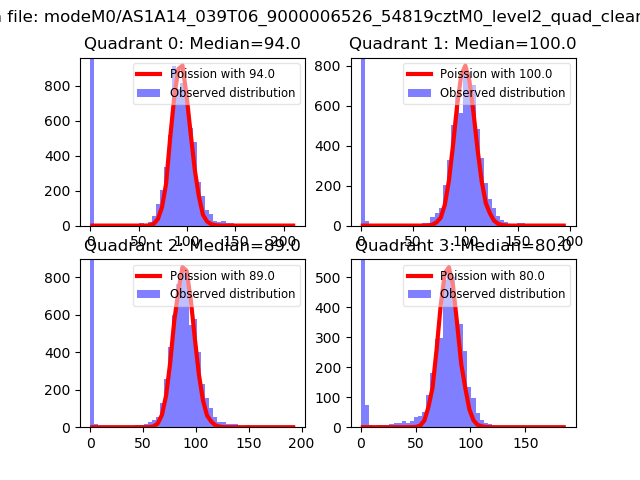 |
 |
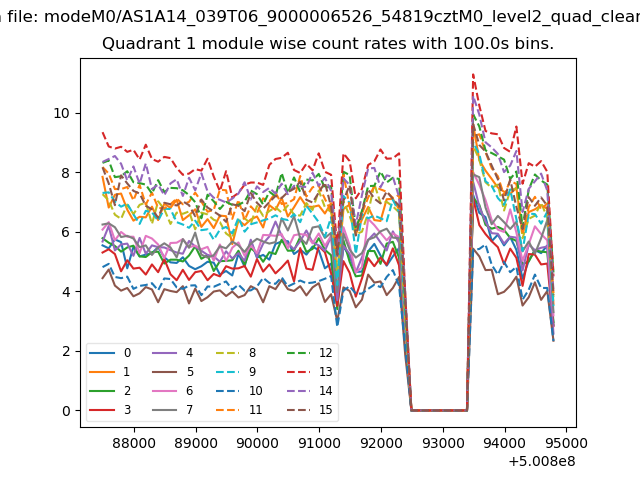
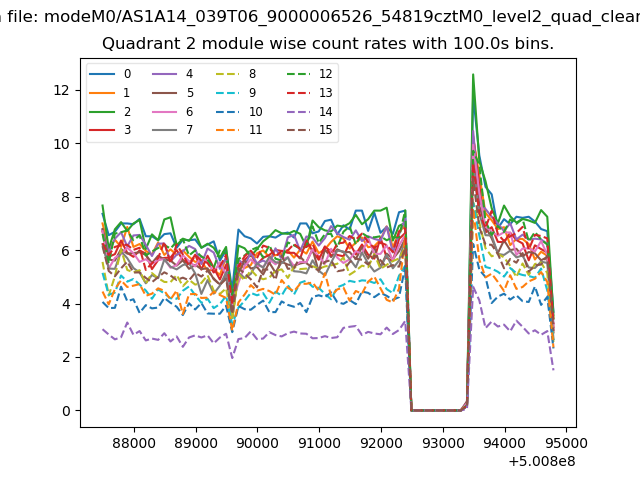
| Quadrant-wise count rates Data is divided into 100 sec bins |
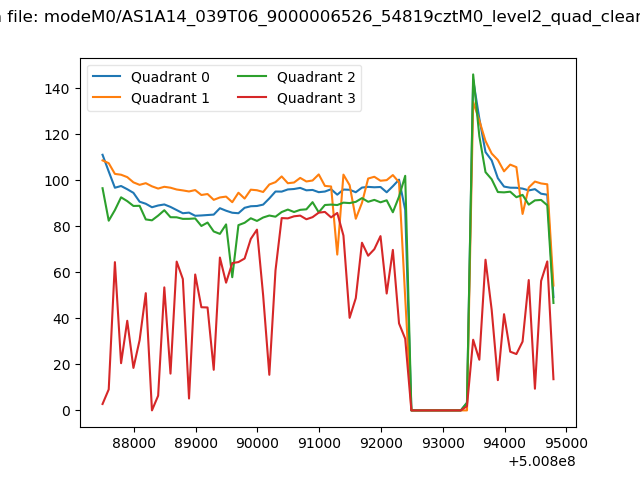 |
|
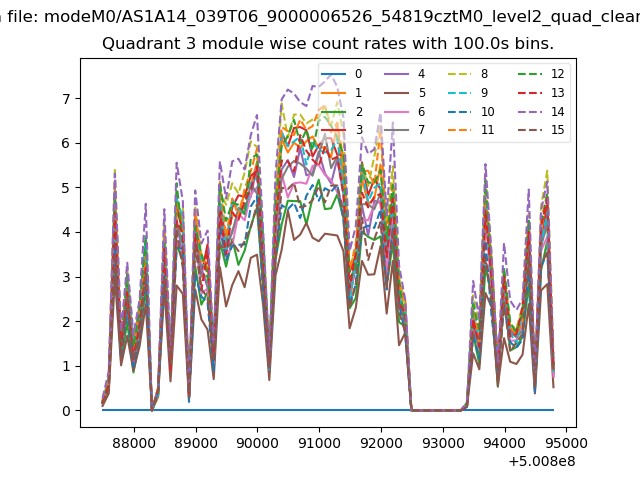
| Module-wise count rates for Quadrant A Data is divided into 100 sec bins |
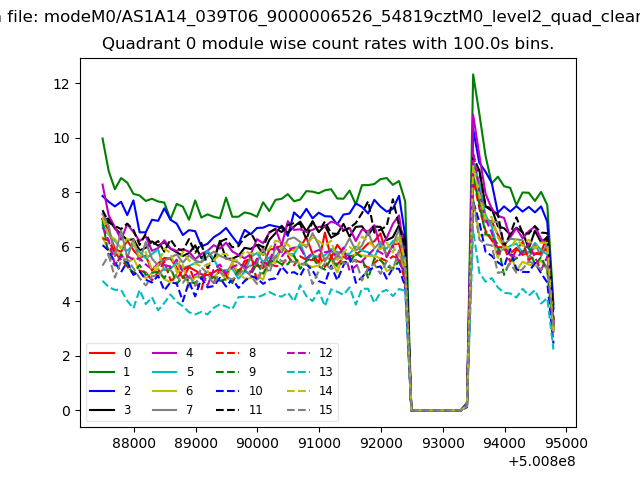 |
 |
| Module-wise count rates for Quadrant B Data is divided into 100 sec bins |
 |
 |
| Module-wise count rates for Quadrant C Data is divided into 100 sec bins |
 |
 |
| Module-wise count rates for Quadrant D Data is divided into 100 sec bins |
 |
 |
| Parameter | Plot |
|---|---|
| CZT HV Monitor | 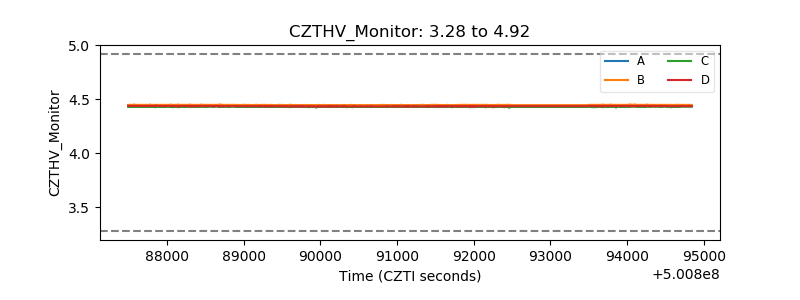 |
| D_VDD | 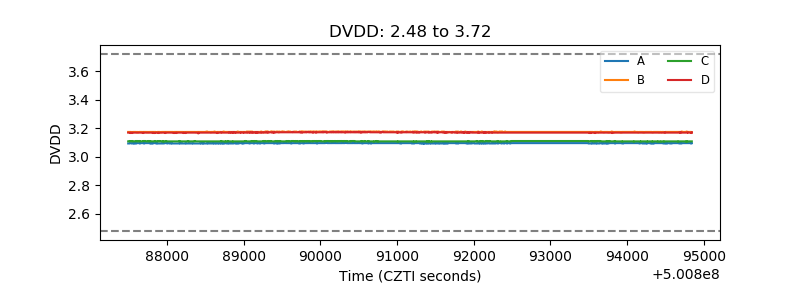 |
| Temperature 1 | 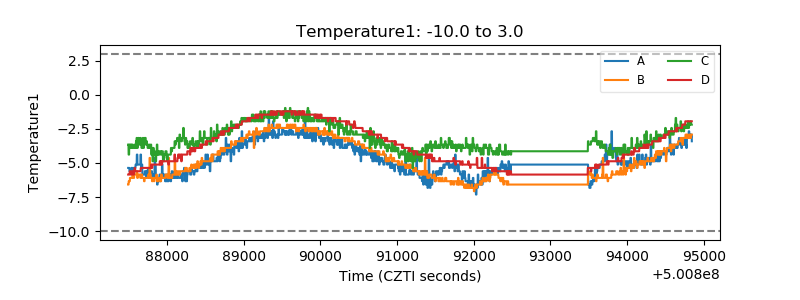 |
| Veto HV Monitor | 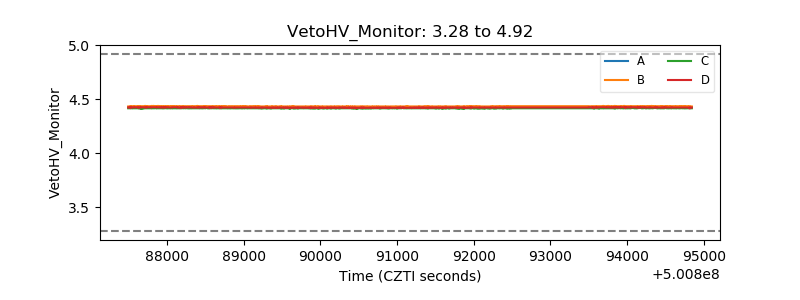 |
| Veto LLD | 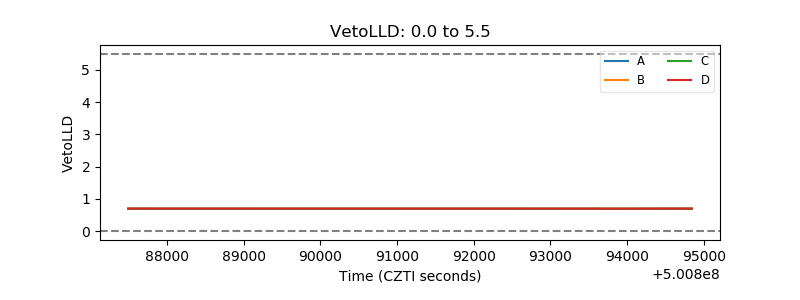 |
| Alpha Counter | 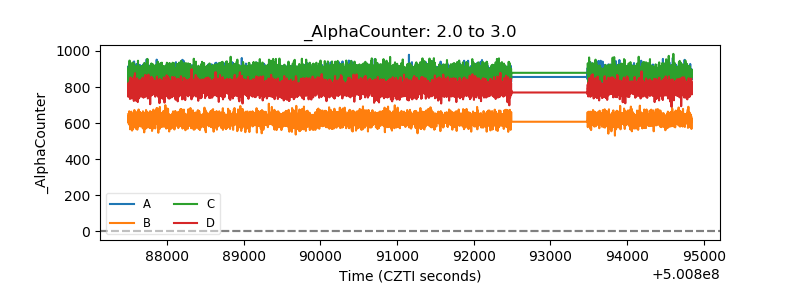 |
| _CPM_Rate | 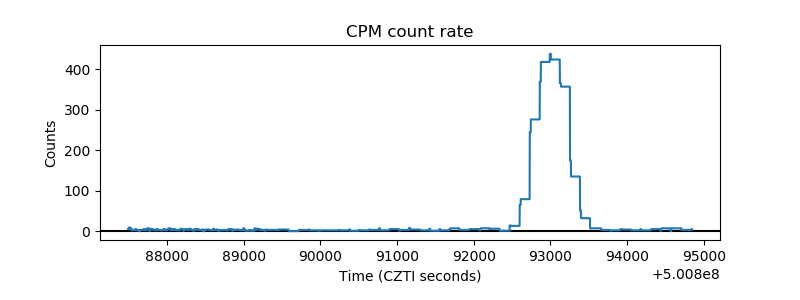 |
| CZT Counter | 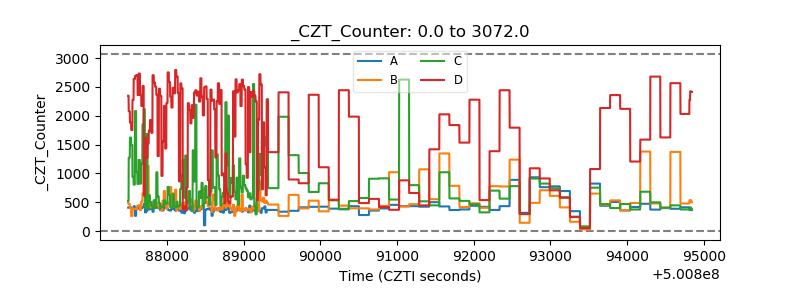 |
| +2.5 Volts monitor |  |
| +5 Volts monitor |  |
| _ROLL_ROT | 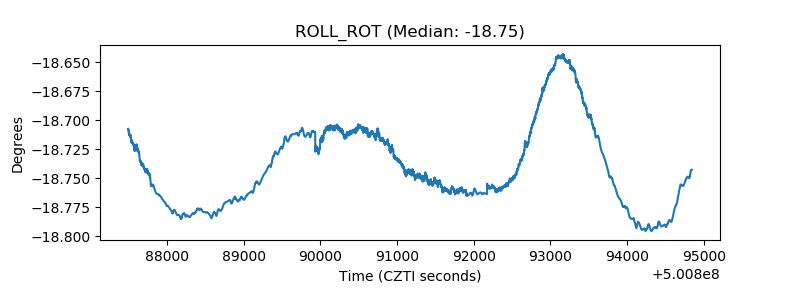 |
| _Roll_DEC | 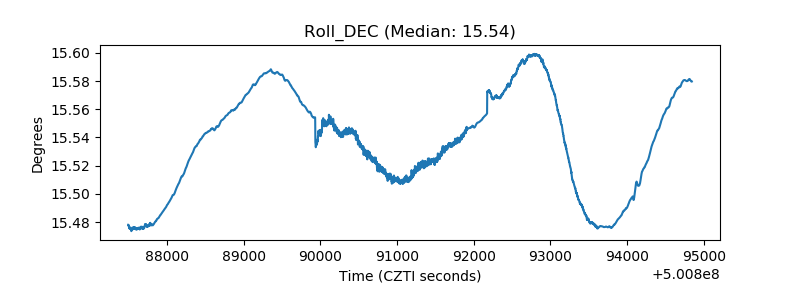 |
| _Roll_RA | 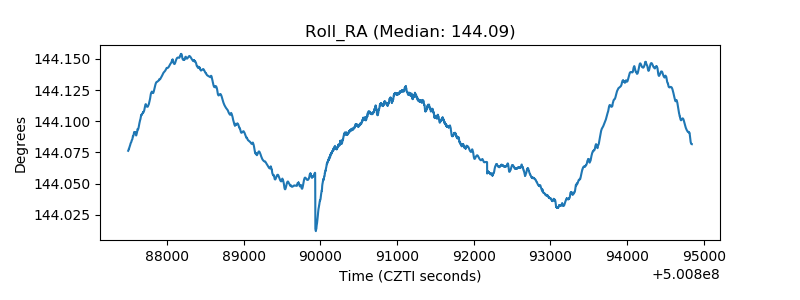 |
| Veto Counter | 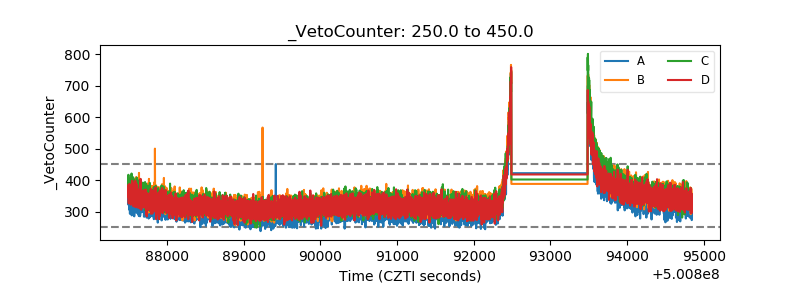 |