| Param | Original file | Final file |
|---|---|---|
| Filename | modeM0/AS1A14_039T06_9000006526_54821cztM0_level2.fits | modeM0/AS1A14_039T06_9000006526_54821cztM0_level2_quad_clean.evt |
| Size (bytes) | 470,854,080 | 95,567,040 |
| Size | 449.0 MB | 91.1 MB |
| Events in quadrant A | 3,001,628 | 641,959 |
| Events in quadrant B | 3,328,983 | 688,677 |
| Events in quadrant C | 3,926,266 | 604,834 |
| Events in quadrant D | 6,663,019 | 501,015 |
| Mode M9 | |||
|---|---|---|---|
| Quadrant | BADHDUFLAG | Total packets | Discarded packets |
| A | 0 | 14 | 0 |
| B | 0 | 15 | 0 |
| C | 0 | 15 | 0 |
| D | 0 | 15 | 0 |
| Mode M0 | |||
|---|---|---|---|
| Quadrant | BADHDUFLAG | Total packets | Discarded packets |
| A | 0 | 13723 | 2 |
| B | 0 | 14530 | 2 |
| C | 0 | 16294 | 2 |
| D | 0 | 24284 | 2 |
| Mode SS | |||
|---|---|---|---|
| Quadrant | BADHDUFLAG | Total packets | Discarded packets |
| A | 0 | 134 | 0 |
| B | 0 | 134 | 0 |
| C | 0 | 134 | 0 |
| D | 0 | 134 | 0 |
| Quadrant | Total seconds | Saturated seconds | Saturation percentage |
|---|---|---|---|
| A | 6556 | 108 | 1.647346% |
| B | 6556 | 140 | 2.135448% |
| C | 6556 | 234 | 3.569250% |
| D | 6556 | 996 | 15.192190% |
Noise dominated data is calculated using 1-second bins in cleaned event files. If a bin has >2000 counts, and if more than 50% of those come from <1% of pixels, then it is considered to be noise-dominated and hence unusable.
| Quadrant | # 1 sec bins | Bins with >0 counts | Bins with >2000 counts | High rate bins dominated by noise | Noise dominated (total time) | Noise dominated (detector-on time) | Marked lightcurve |
|---|---|---|---|---|---|---|---|
| A | 7671 | 6558 | 8 | 8 | 0.10% | 0.12% | 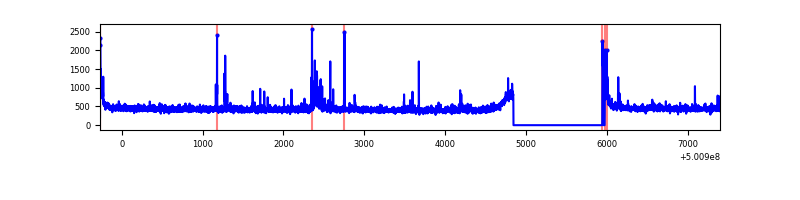 |
| B | 7671 | 6558 | 27 | 27 | 0.35% | 0.41% | 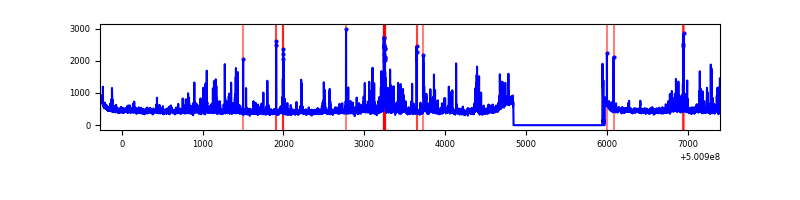 |
| C | 7671 | 6558 | 154 | 154 | 2.01% | 2.35% | 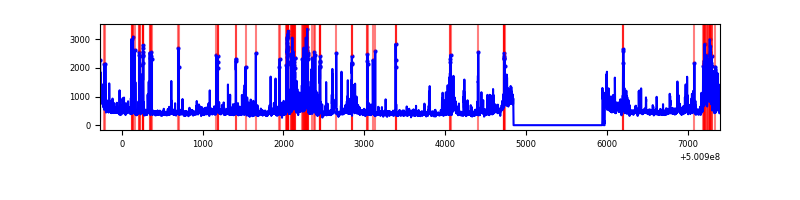 |
| D | 7671 | 6558 | 908 | 908 | 11.84% | 13.85% | 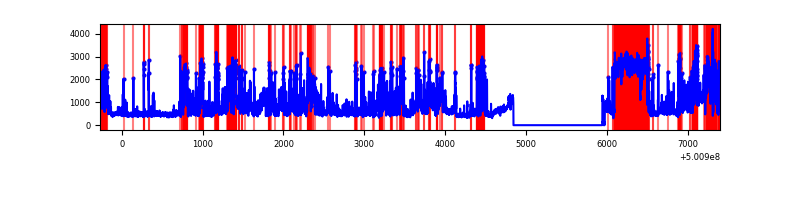 |
Top three noisy pixels from each quadrant. If the there are fewer than three noisy pixels in the level2.evt file, extra rows are filled as -1
| Pixel properties | Quadrant properties | ||||||
|---|---|---|---|---|---|---|---|
| Quadrant | DetID | PixID | Counts | Sigma | Mean | Median | Sigma |
| A | 12 | 15 | 57936 | 314.9 | 728 | 710 | 181.7 |
| A | 6 | 161 | 15014 | 78.71 | 728 | 710 | 181.7 |
| A | 0 | 8 | 14156 | 73.99 | 728 | 710 | 181.7 |
| B | 10 | 247 | 201113 | 1319.99 | 710 | 685 | 151.8 |
| B | 2 | 249 | 153581 | 1006.95 | 710 | 685 | 151.8 |
| B | 5 | 185 | 128049 | 838.8 | 710 | 685 | 151.8 |
| C | 4 | 5 | 503627 | 2640.2 | 697 | 690 | 190.5 |
| C | 9 | 38 | 233540 | 1222.36 | 697 | 690 | 190.5 |
| C | 6 | 223 | 128730 | 672.15 | 697 | 690 | 190.5 |
| D | 1 | 31 | 2456807 | 13132.84 | 657 | 630 | 187.0 |
| D | 11 | 129 | 489002 | 2611.26 | 657 | 630 | 187.0 |
| D | 10 | 181 | 288407 | 1538.7 | 657 | 630 | 187.0 |
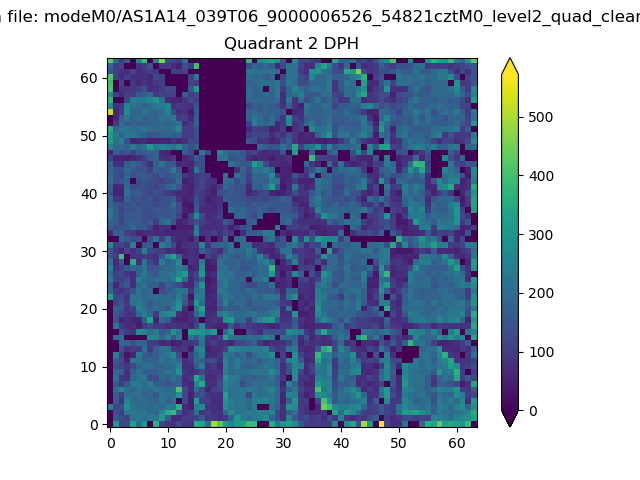
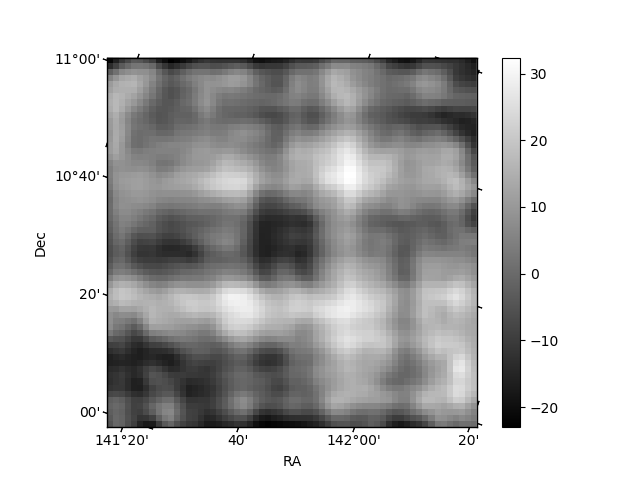
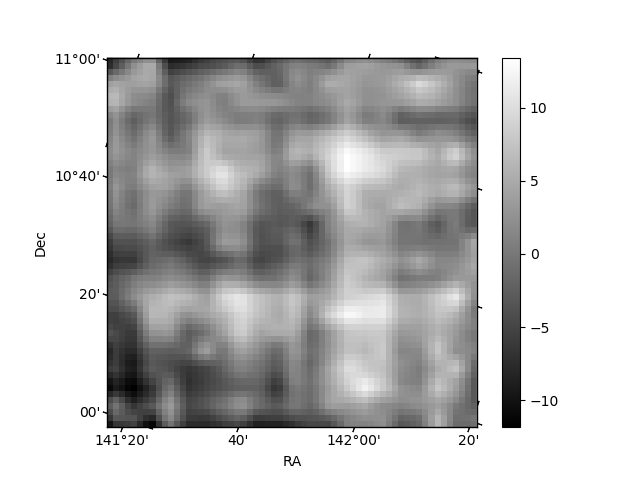
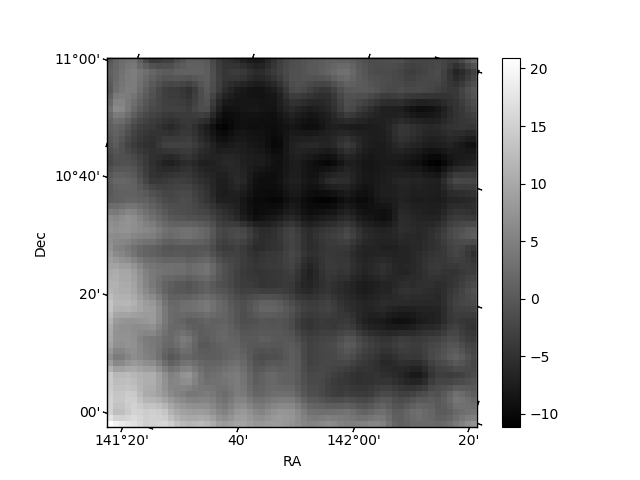
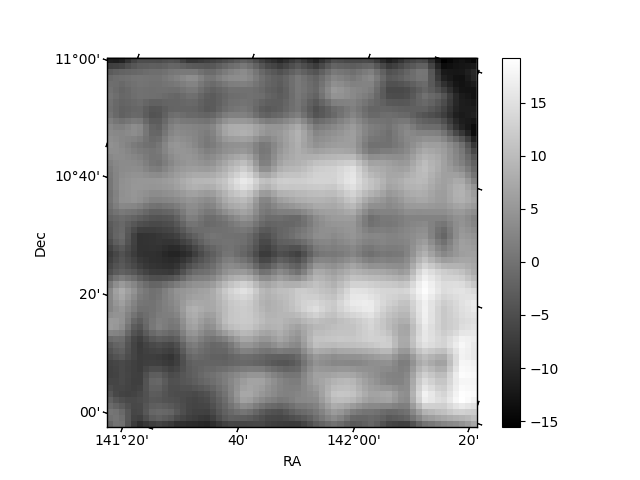
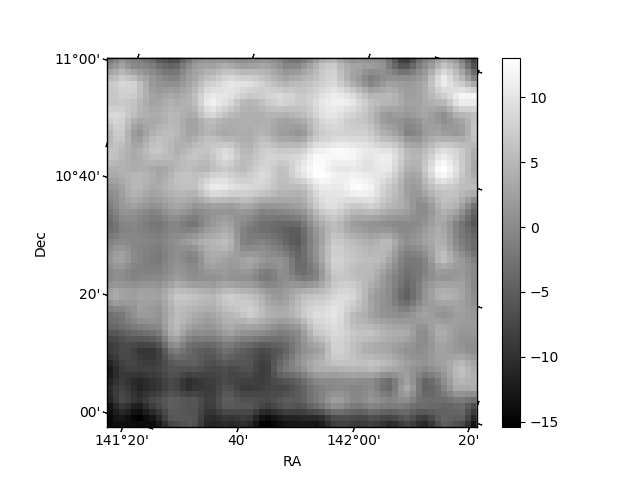
Histogram calculated using DETX and DETY for each event in the final _common_clean file
| Quadrant A | 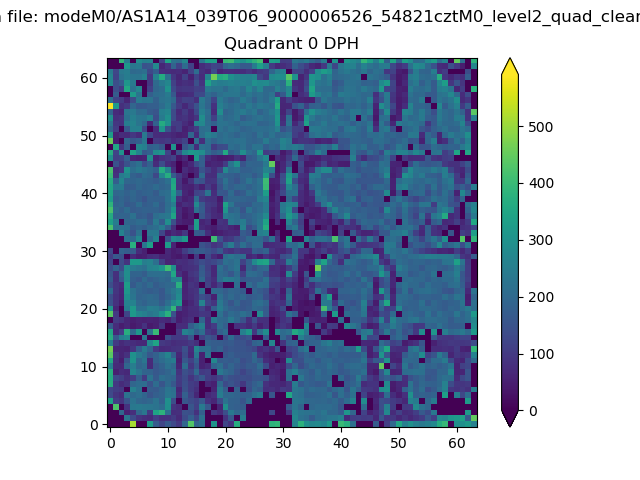 |
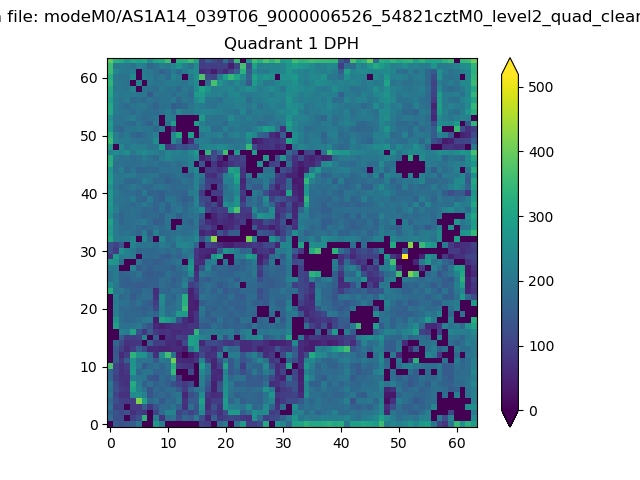 |
Quadrant B |
|---|---|---|---|
| Quadrant D | 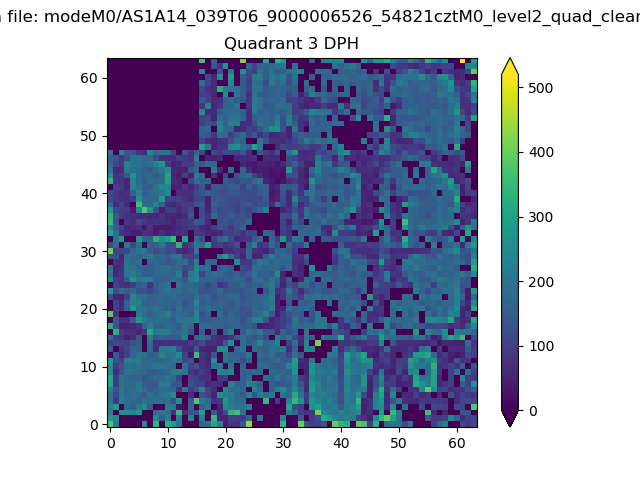 |
 |
Quadrant C |
| Plot type | Count rate plots | Images |
|---|---|---|
| Comparison with Poisson distribution Blue bars denote a histogram of data divided into 1 sec bins. Red curve is a Poisson curve with rate = median count rate of data. |
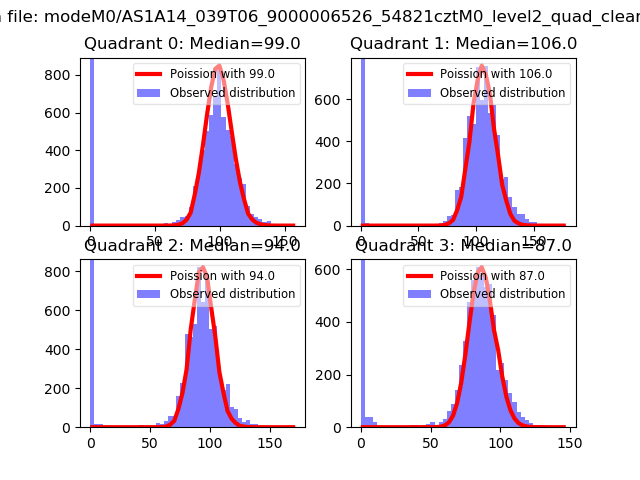 |
 |
| Quadrant-wise count rates Data is divided into 100 sec bins |
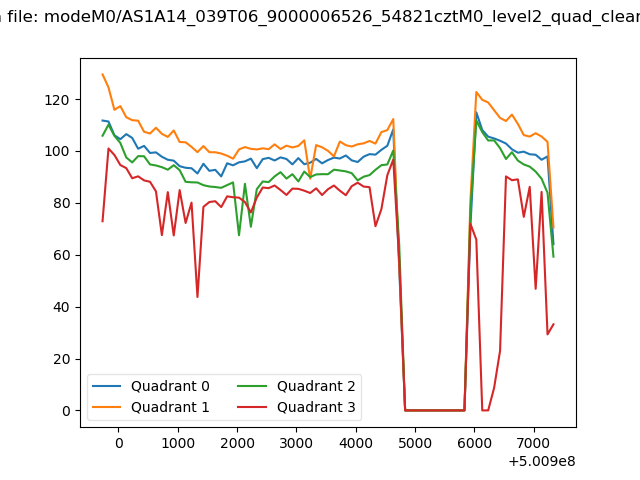 |
|
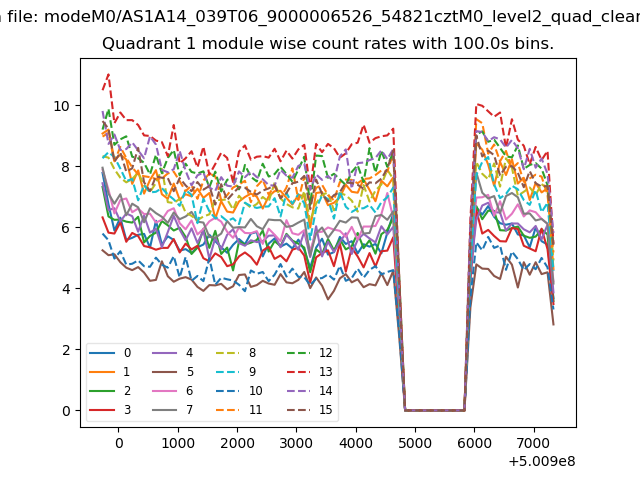
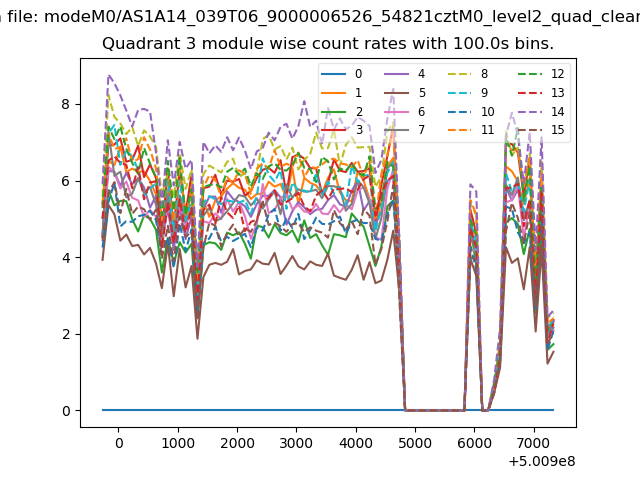
| Module-wise count rates for Quadrant A Data is divided into 100 sec bins |
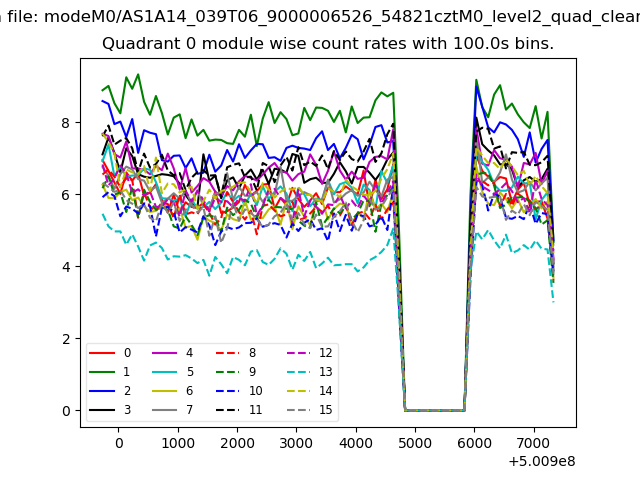 |
 |
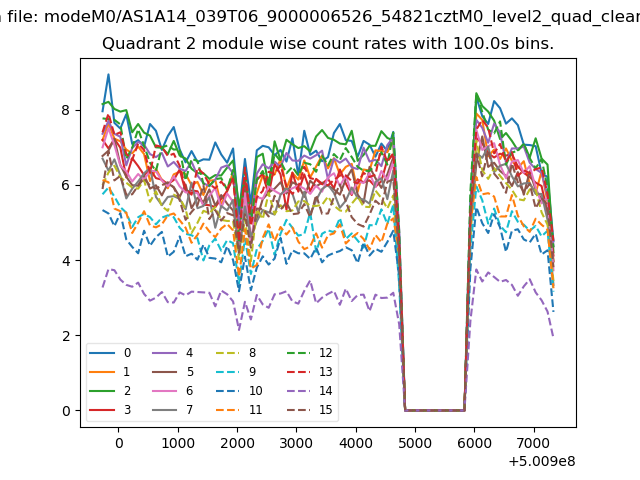
| Module-wise count rates for Quadrant B Data is divided into 100 sec bins |
 |
 |
| Module-wise count rates for Quadrant C Data is divided into 100 sec bins |
 |
 |
| Module-wise count rates for Quadrant D Data is divided into 100 sec bins |
 |
 |
| Parameter | Plot |
|---|---|
| CZT HV Monitor | 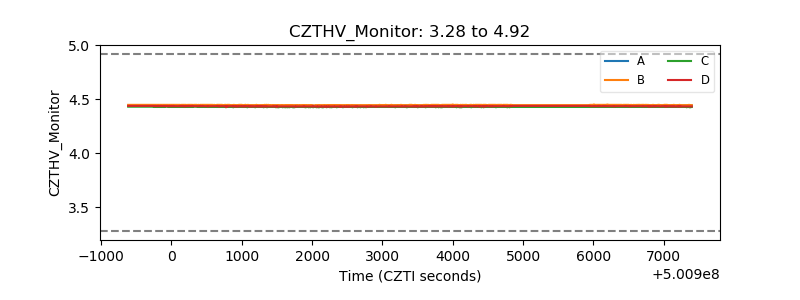 |
| D_VDD | 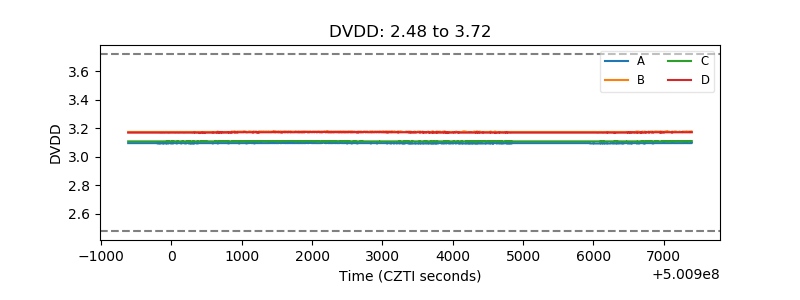 |
| Temperature 1 | 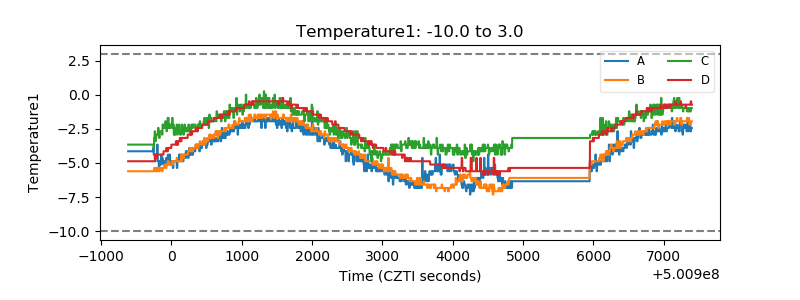 |
| Veto HV Monitor | 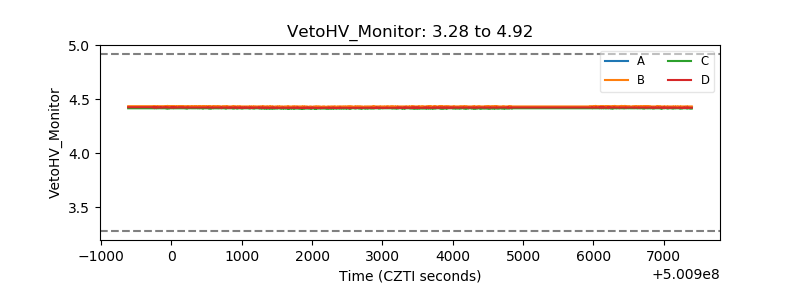 |
| Veto LLD | 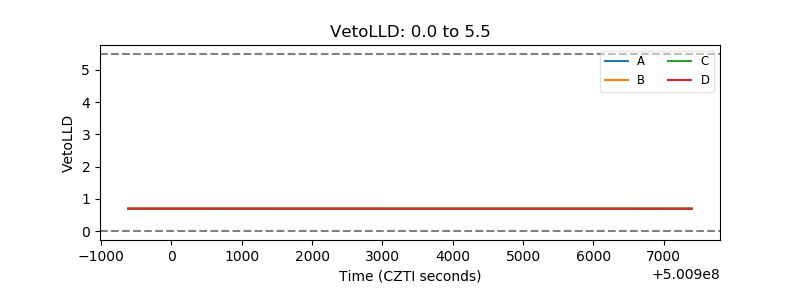 |
| Alpha Counter | 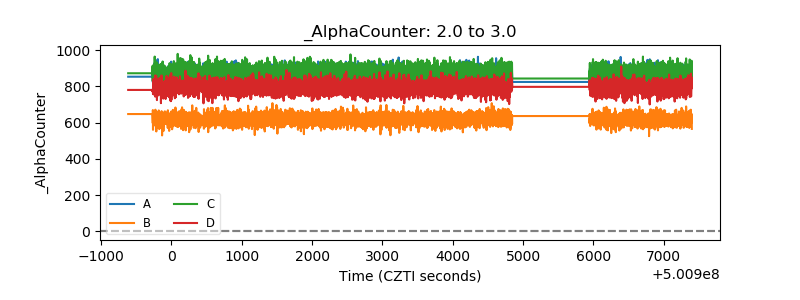 |
| _CPM_Rate | 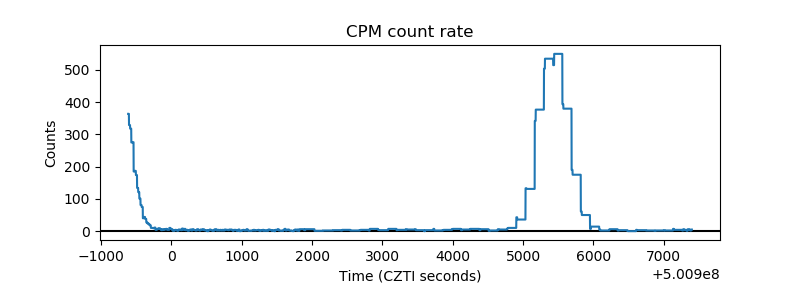 |
| CZT Counter | 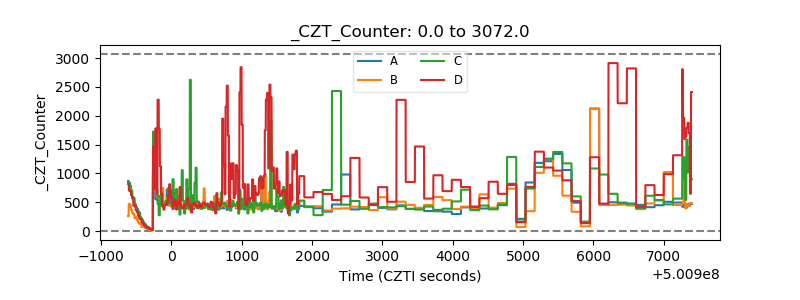 |
| +2.5 Volts monitor | 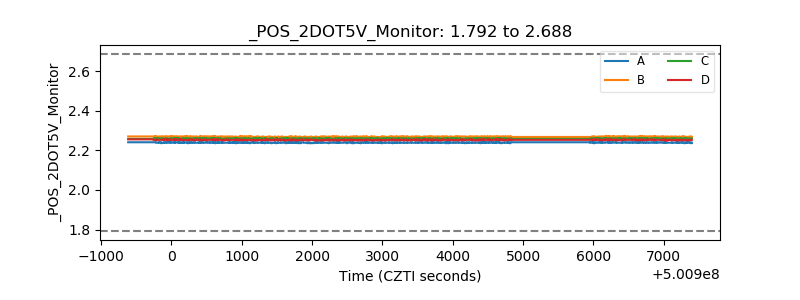 |
| +5 Volts monitor | 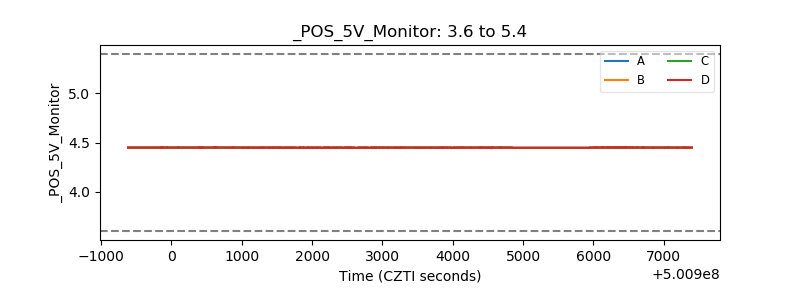 |
| _ROLL_ROT | 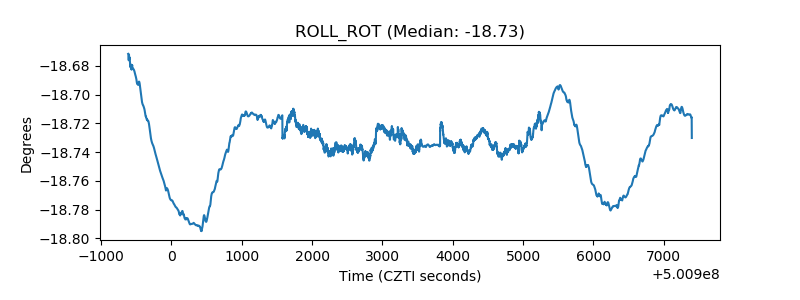 |
| _Roll_DEC | 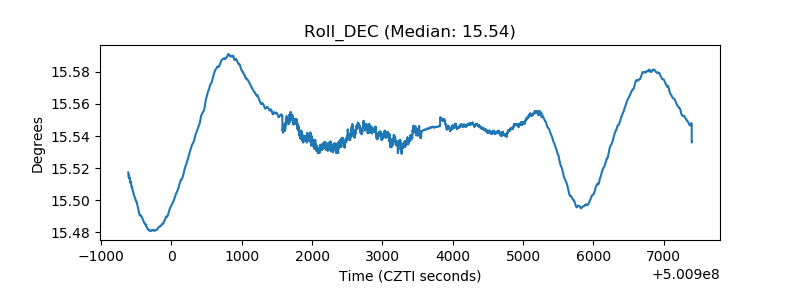 |
| _Roll_RA | 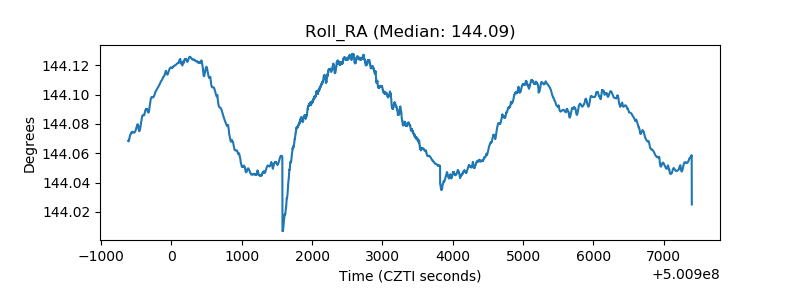 |
| Veto Counter | 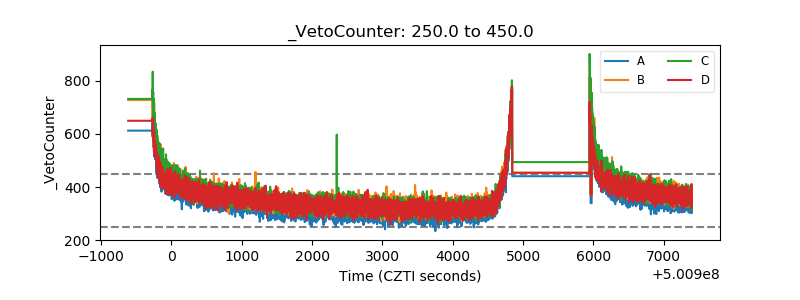 |