| Param | Original file | Final file |
|---|---|---|
| Filename | modeM0/AS1A14_039T06_9000006526_54822cztM0_level2.fits | modeM0/AS1A14_039T06_9000006526_54822cztM0_level2_quad_clean.evt |
| Size (bytes) | 499,008,960 | 98,893,440 |
| Size | 475.9 MB | 94.3 MB |
| Events in quadrant A | 3,095,285 | 668,907 |
| Events in quadrant B | 3,604,465 | 715,658 |
| Events in quadrant C | 4,251,448 | 627,917 |
| Events in quadrant D | 6,989,651 | 505,750 |
| Mode M9 | |||
|---|---|---|---|
| Quadrant | BADHDUFLAG | Total packets | Discarded packets |
| A | 0 | 12 | 0 |
| B | 0 | 12 | 0 |
| C | 0 | 13 | 0 |
| D | 0 | 13 | 0 |
| Mode M0 | |||
|---|---|---|---|
| Quadrant | BADHDUFLAG | Total packets | Discarded packets |
| A | 0 | 14227 | 2 |
| B | 0 | 15532 | 2 |
| C | 0 | 17368 | 2 |
| D | 0 | 25591 | 2 |
| Mode SS | |||
|---|---|---|---|
| Quadrant | BADHDUFLAG | Total packets | Discarded packets |
| A | 0 | 140 | 0 |
| B | 0 | 140 | 0 |
| C | 0 | 140 | 0 |
| D | 0 | 140 | 0 |
| Quadrant | Total seconds | Saturated seconds | Saturation percentage |
|---|---|---|---|
| A | 6831 | 109 | 1.595667% |
| B | 6831 | 144 | 2.108037% |
| C | 6831 | 224 | 3.279168% |
| D | 6830 | 1194 | 17.481698% |
Noise dominated data is calculated using 1-second bins in cleaned event files. If a bin has >2000 counts, and if more than 50% of those come from <1% of pixels, then it is considered to be noise-dominated and hence unusable.
| Quadrant | # 1 sec bins | Bins with >0 counts | Bins with >2000 counts | High rate bins dominated by noise | Noise dominated (total time) | Noise dominated (detector-on time) | Marked lightcurve |
|---|---|---|---|---|---|---|---|
| A | 7941 | 6833 | 4 | 4 | 0.05% | 0.06% | 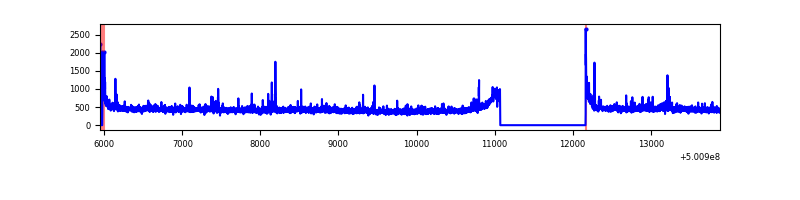 |
| B | 7941 | 6833 | 43 | 43 | 0.54% | 0.63% | 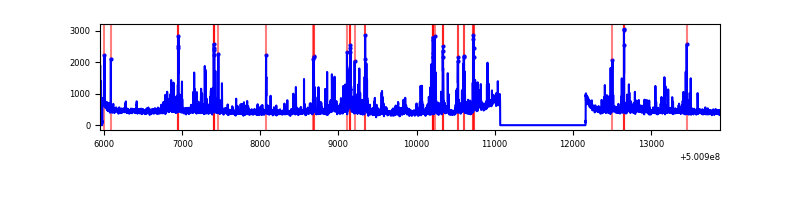 |
| C | 7941 | 6833 | 112 | 112 | 1.41% | 1.64% | 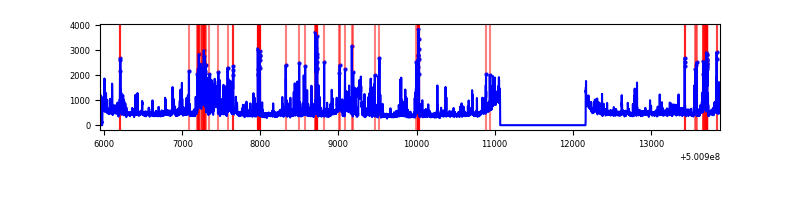 |
| D | 7940 | 6832 | 1056 | 1056 | 13.30% | 15.46% | 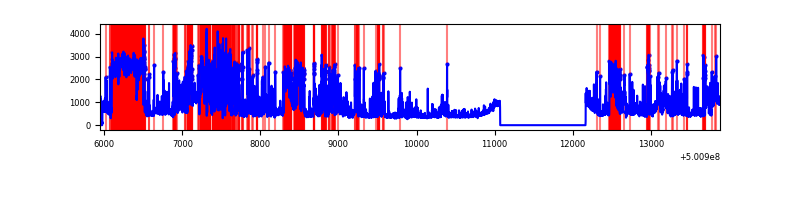 |
Top three noisy pixels from each quadrant. If the there are fewer than three noisy pixels in the level2.evt file, extra rows are filled as -1
| Pixel properties | Quadrant properties | ||||||
|---|---|---|---|---|---|---|---|
| Quadrant | DetID | PixID | Counts | Sigma | Mean | Median | Sigma |
| A | 8 | 246 | 32332 | 167.46 | 761 | 743 | 188.6 |
| A | 6 | 226 | 18431 | 93.77 | 761 | 743 | 188.6 |
| A | 13 | 254 | 14809 | 74.57 | 761 | 743 | 188.6 |
| B | 5 | 185 | 266971 | 1655.32 | 743 | 718 | 160.8 |
| B | 2 | 249 | 228016 | 1413.13 | 743 | 718 | 160.8 |
| B | 10 | 247 | 115997 | 716.7 | 743 | 718 | 160.8 |
| C | 12 | 252 | 434033 | 2167.1 | 733 | 725 | 199.9 |
| C | 9 | 38 | 275423 | 1373.84 | 733 | 725 | 199.9 |
| C | 13 | 3 | 264113 | 1317.28 | 733 | 725 | 199.9 |
| D | 1 | 31 | 2595436 | 13427.05 | 683 | 654 | 193.3 |
| D | 11 | 129 | 802024 | 4146.8 | 683 | 654 | 193.3 |
| D | 10 | 181 | 340016 | 1756.07 | 683 | 654 | 193.3 |
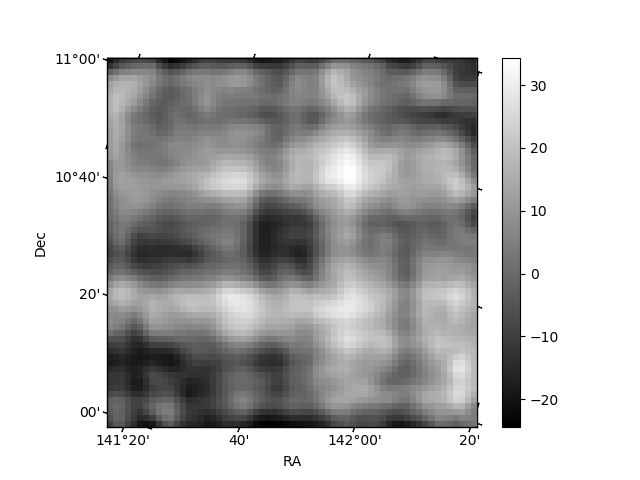
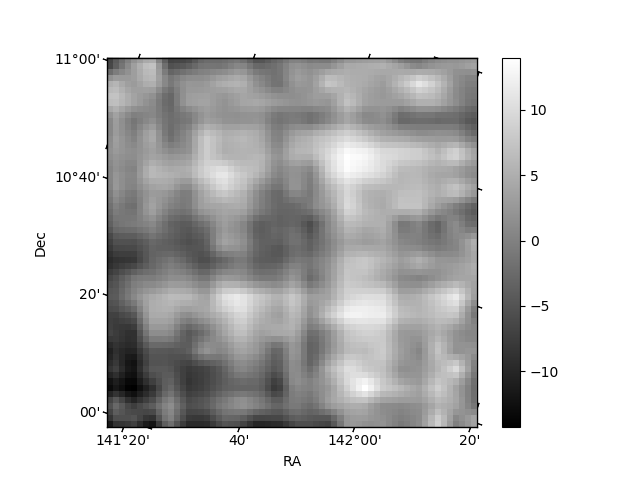
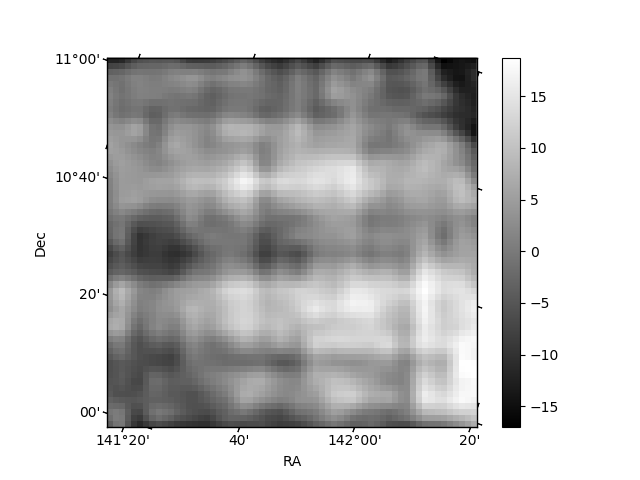
Histogram calculated using DETX and DETY for each event in the final _common_clean file
| Quadrant A | 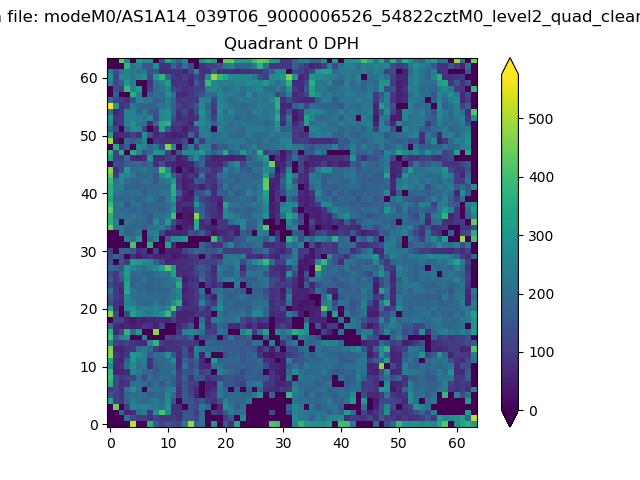 |
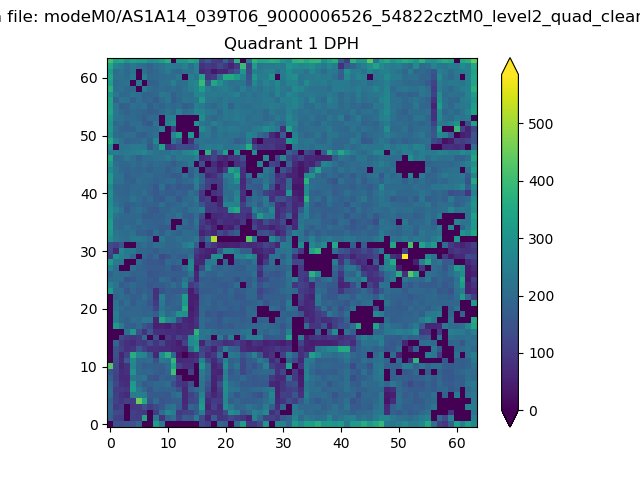 |
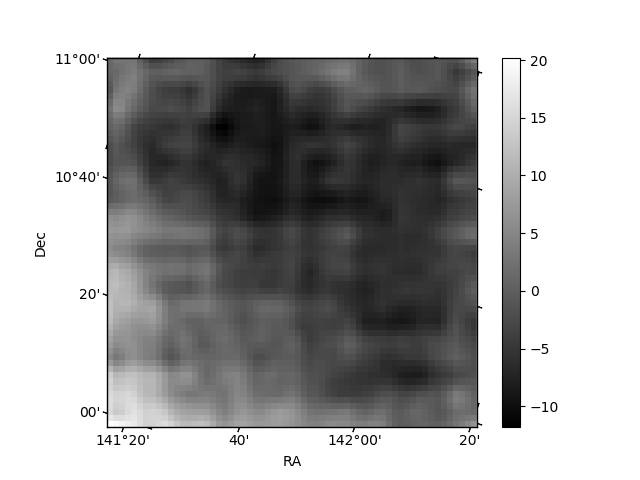
Quadrant B |
|---|---|---|---|
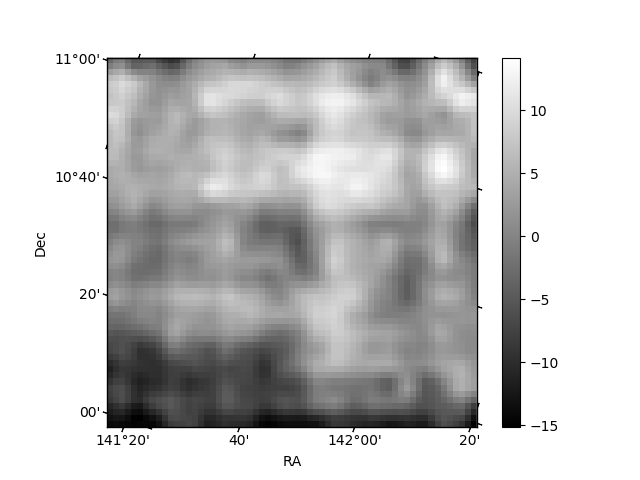
| Quadrant D | 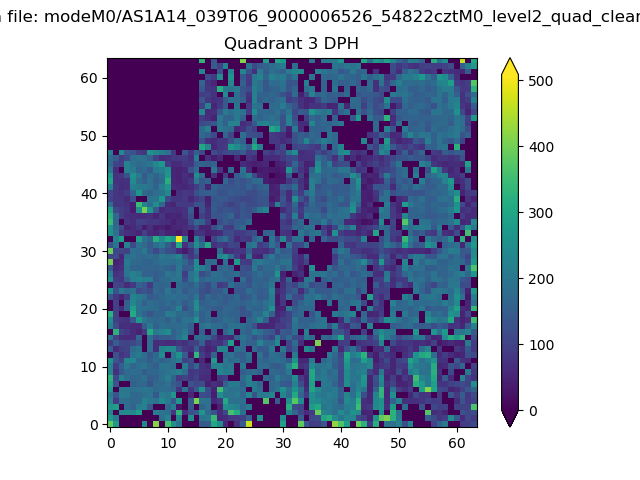 |
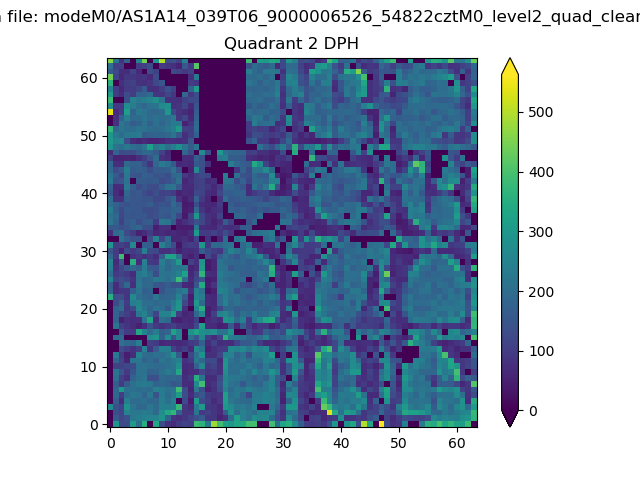 |
Quadrant C |
| Plot type | Count rate plots | Images |
|---|---|---|
| Comparison with Poisson distribution Blue bars denote a histogram of data divided into 1 sec bins. Red curve is a Poisson curve with rate = median count rate of data. |
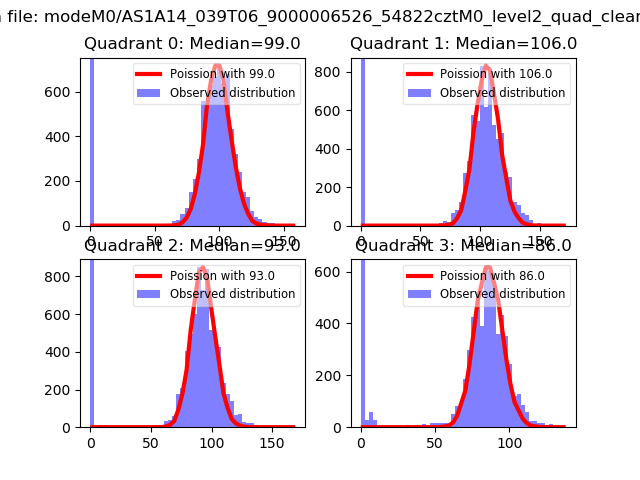 |
 |
| Quadrant-wise count rates Data is divided into 100 sec bins |
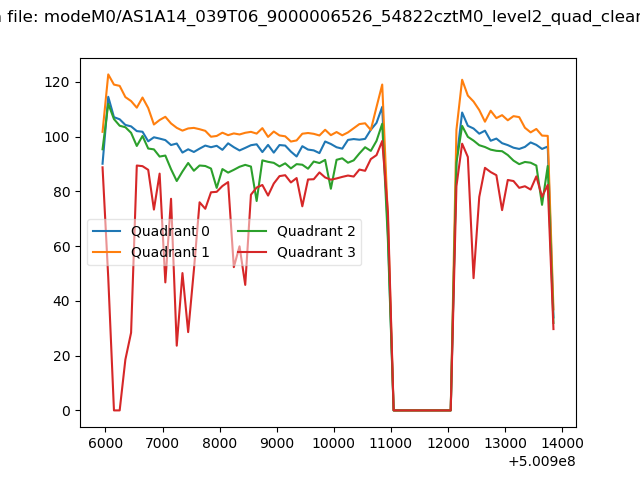 |
|
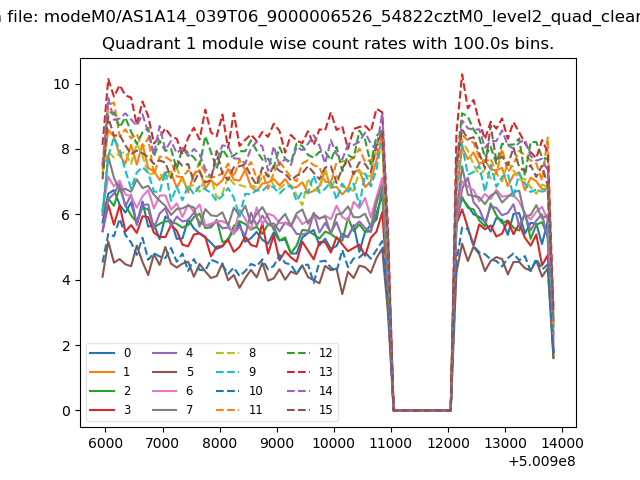
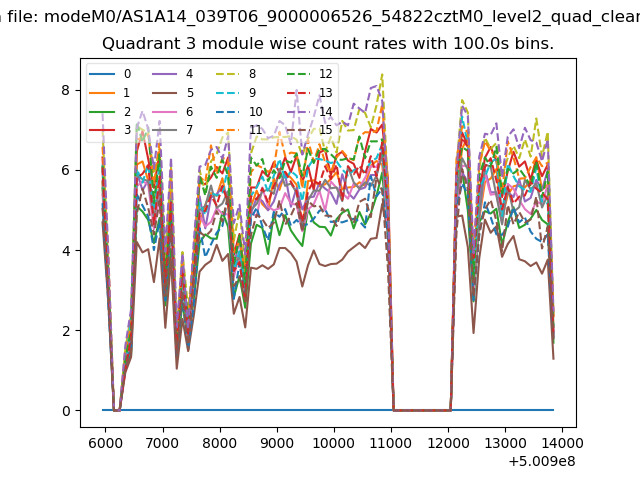
| Module-wise count rates for Quadrant A Data is divided into 100 sec bins |
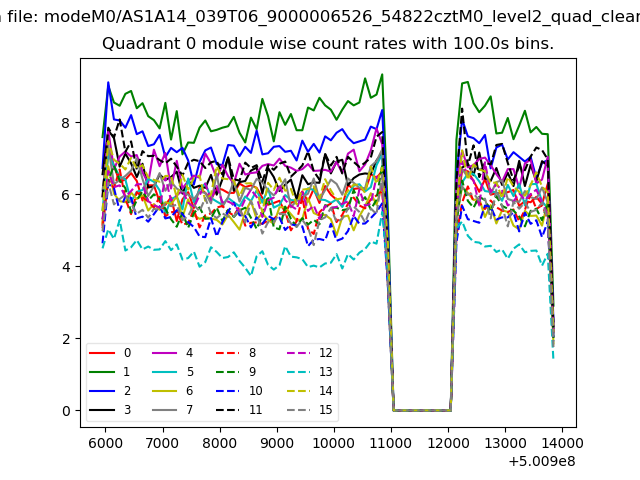 |
 |
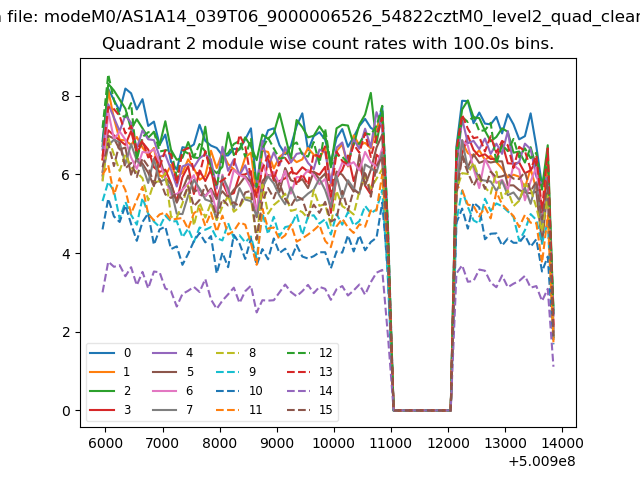
| Module-wise count rates for Quadrant B Data is divided into 100 sec bins |
 |
 |
| Module-wise count rates for Quadrant C Data is divided into 100 sec bins |
 |
 |
| Module-wise count rates for Quadrant D Data is divided into 100 sec bins |
 |
 |
| Parameter | Plot |
|---|---|
| CZT HV Monitor |  |
| D_VDD | 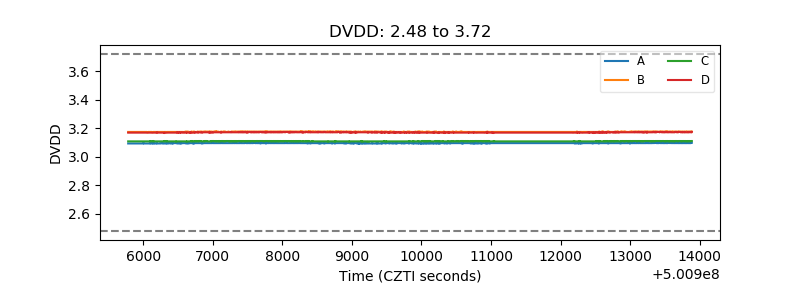 |
| Temperature 1 | 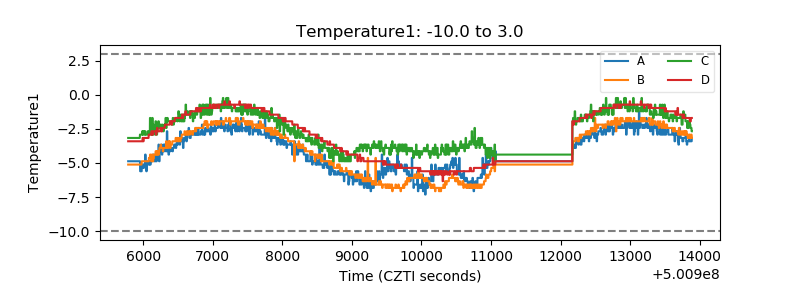 |
| Veto HV Monitor | 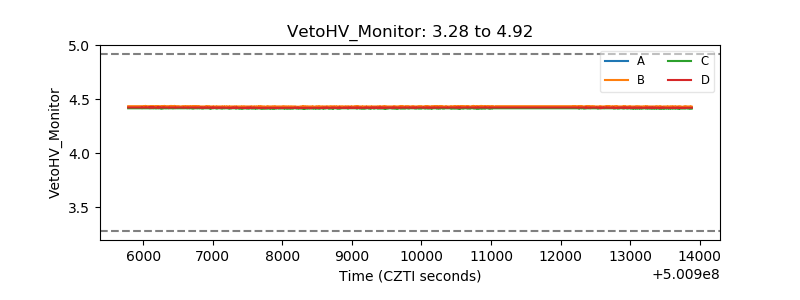 |
| Veto LLD | 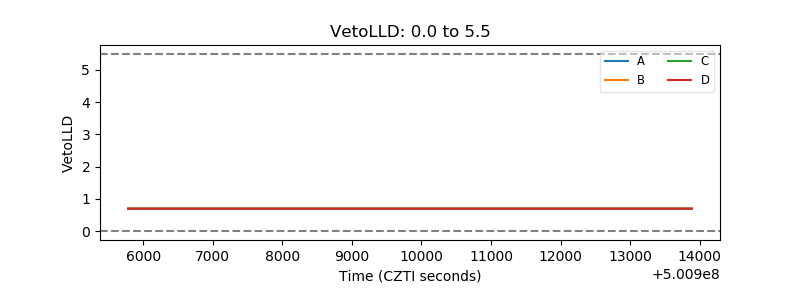 |
| Alpha Counter | 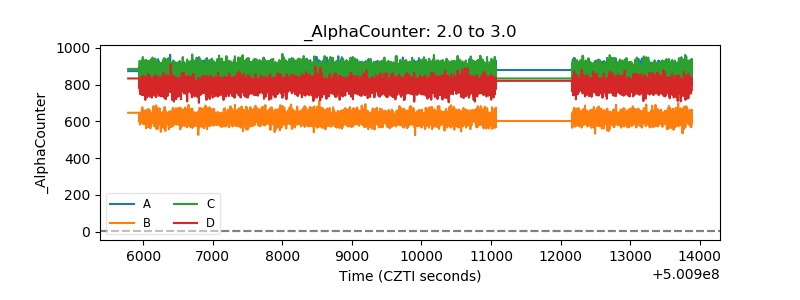 |
| _CPM_Rate | 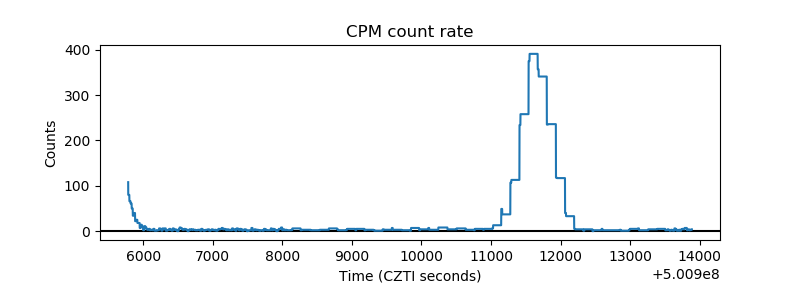 |
| CZT Counter | 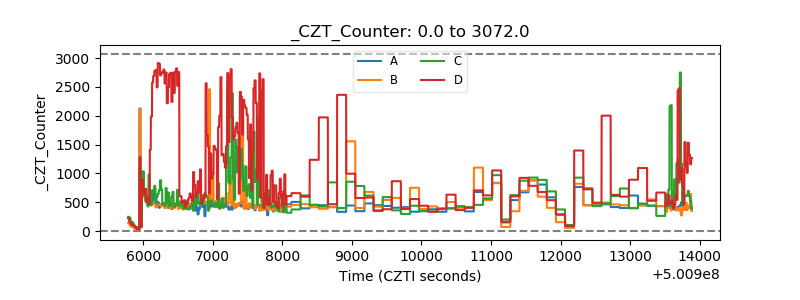 |
| +2.5 Volts monitor |  |
| +5 Volts monitor | 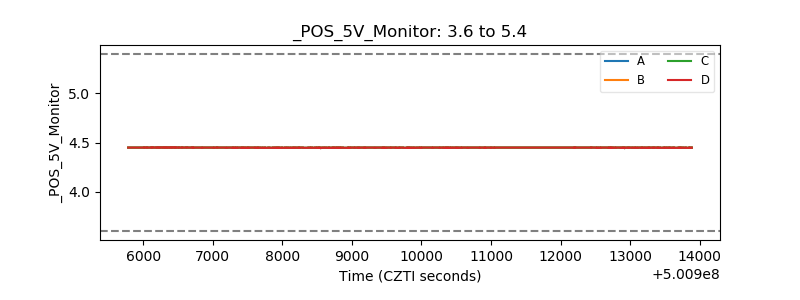 |
| _ROLL_ROT | 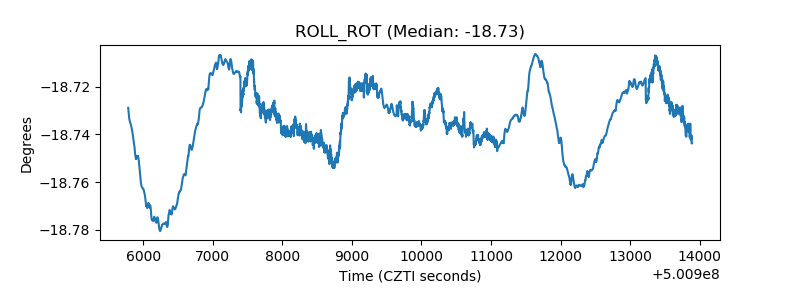 |
| _Roll_DEC | 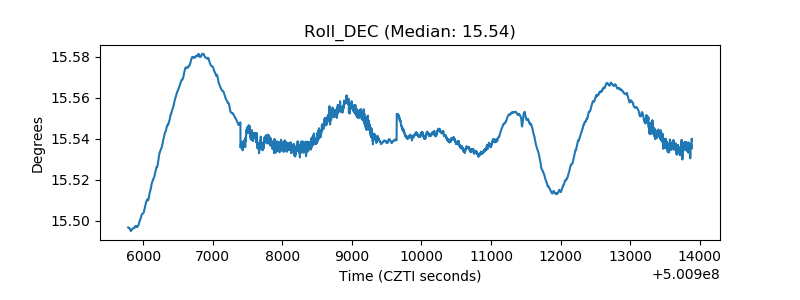 |
| _Roll_RA | 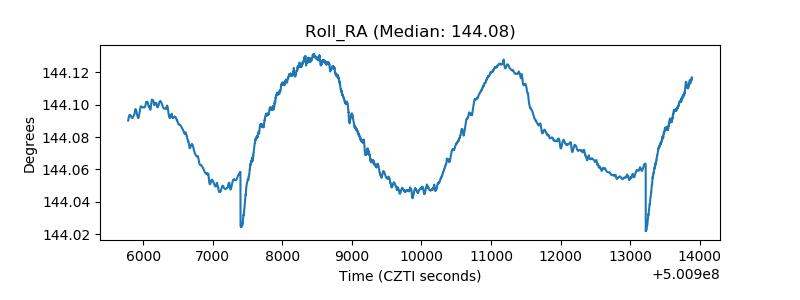 |
| Veto Counter | 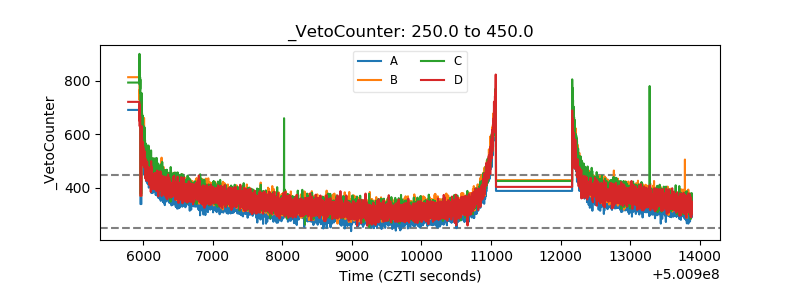 |