| Param | Original file | Final file |
|---|---|---|
| Filename | modeM0/AS1A14_039T06_9000006526_54823cztM0_level2.fits | modeM0/AS1A14_039T06_9000006526_54823cztM0_level2_quad_clean.evt |
| Size (bytes) | 450,866,880 | 92,062,080 |
| Size | 430.0 MB | 87.8 MB |
| Events in quadrant A | 2,843,028 | 621,143 |
| Events in quadrant B | 3,426,105 | 652,943 |
| Events in quadrant C | 3,738,115 | 583,003 |
| Events in quadrant D | 6,178,168 | 478,940 |
| Mode M9 | |||
|---|---|---|---|
| Quadrant | BADHDUFLAG | Total packets | Discarded packets |
| A | 0 | 11 | 0 |
| B | 0 | 11 | 0 |
| C | 0 | 11 | 0 |
| D | 0 | 11 | 0 |
| Mode M0 | |||
|---|---|---|---|
| Quadrant | BADHDUFLAG | Total packets | Discarded packets |
| A | 0 | 13393 | 1 |
| B | 0 | 14903 | 1 |
| C | 0 | 15587 | 1 |
| D | 0 | 22994 | 1 |
| Mode SS | |||
|---|---|---|---|
| Quadrant | BADHDUFLAG | Total packets | Discarded packets |
| A | 0 | 130 | 0 |
| B | 0 | 130 | 0 |
| C | 0 | 130 | 0 |
| D | 0 | 130 | 0 |
| Quadrant | Total seconds | Saturated seconds | Saturation percentage |
|---|---|---|---|
| A | 6480 | 79 | 1.219136% |
| B | 6480 | 186 | 2.870370% |
| C | 6480 | 144 | 2.222222% |
| D | 6479 | 1039 | 16.036425% |
Noise dominated data is calculated using 1-second bins in cleaned event files. If a bin has >2000 counts, and if more than 50% of those come from <1% of pixels, then it is considered to be noise-dominated and hence unusable.
| Quadrant | # 1 sec bins | Bins with >0 counts | Bins with >2000 counts | High rate bins dominated by noise | Noise dominated (total time) | Noise dominated (detector-on time) | Marked lightcurve |
|---|---|---|---|---|---|---|---|
| A | 7490 | 6481 | 3 | 3 | 0.04% | 0.05% | 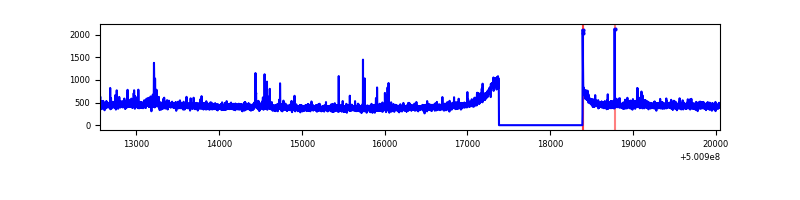 |
| B | 7490 | 6481 | 57 | 57 | 0.76% | 0.88% | 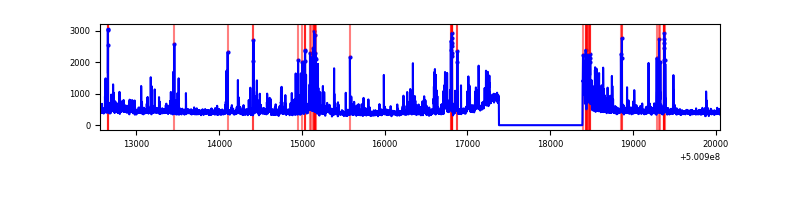 |
| C | 7490 | 6481 | 80 | 80 | 1.07% | 1.23% | 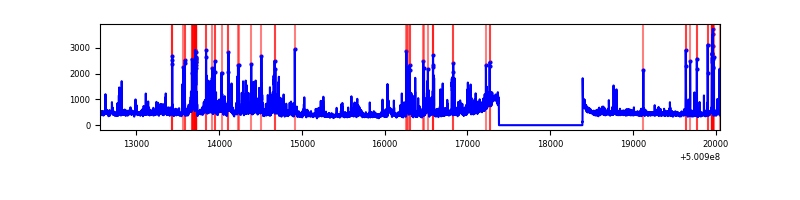 |
| D | 7489 | 6480 | 1023 | 1023 | 13.66% | 15.79% | 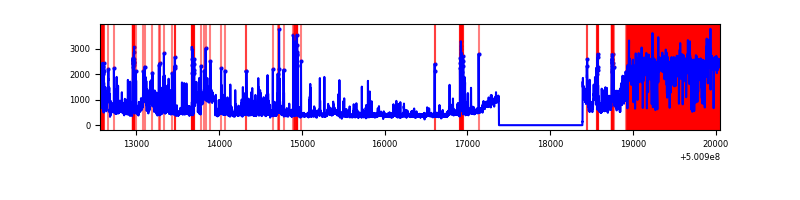 |
Top three noisy pixels from each quadrant. If the there are fewer than three noisy pixels in the level2.evt file, extra rows are filled as -1
| Pixel properties | Quadrant properties | ||||||
|---|---|---|---|---|---|---|---|
| Quadrant | DetID | PixID | Counts | Sigma | Mean | Median | Sigma |
| A | 0 | 8 | 21833 | 120.68 | 705 | 688 | 175.2 |
| A | 4 | 3 | 14950 | 81.4 | 705 | 688 | 175.2 |
| A | 13 | 254 | 14936 | 81.32 | 705 | 688 | 175.2 |
| B | 5 | 185 | 336697 | 2285.97 | 686 | 661 | 147.0 |
| B | 2 | 249 | 236775 | 1606.23 | 686 | 661 | 147.0 |
| B | 10 | 247 | 110490 | 747.14 | 686 | 661 | 147.0 |
| C | 12 | 252 | 426239 | 2282.7 | 681 | 677 | 186.4 |
| C | 13 | 3 | 282781 | 1513.2 | 681 | 677 | 186.4 |
| C | 4 | 5 | 159059 | 849.56 | 681 | 677 | 186.4 |
| D | 2 | 172 | 1857493 | 10009.0 | 658 | 630 | 185.5 |
| D | 1 | 31 | 499326 | 2688.11 | 658 | 630 | 185.5 |
| D | 11 | 129 | 367328 | 1976.6 | 658 | 630 | 185.5 |
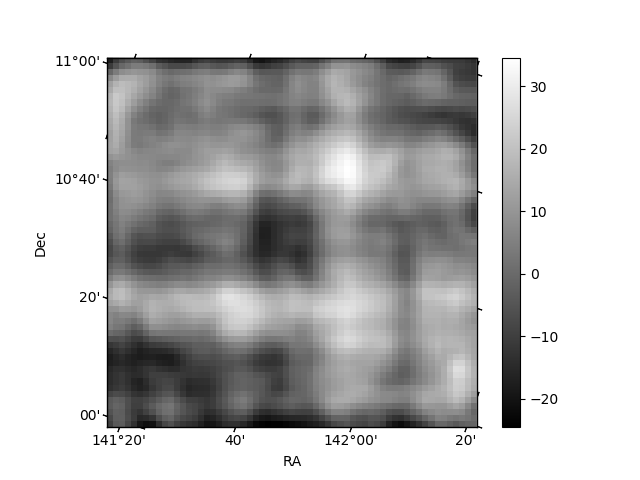
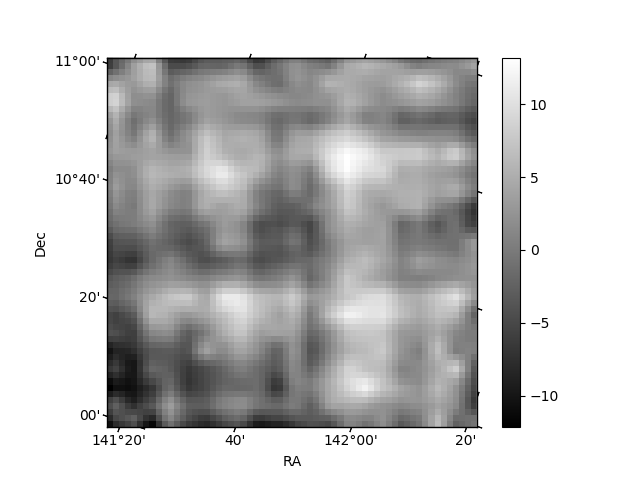
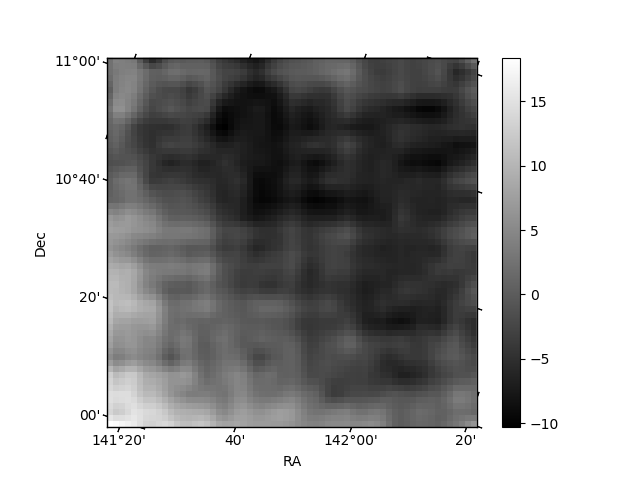
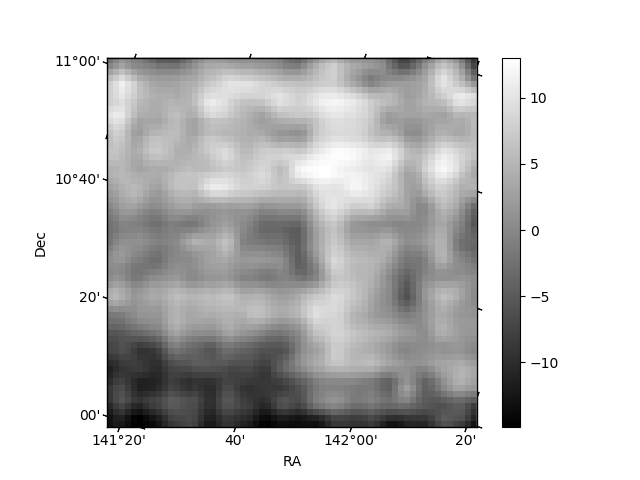
Histogram calculated using DETX and DETY for each event in the final _common_clean file
| Quadrant A | 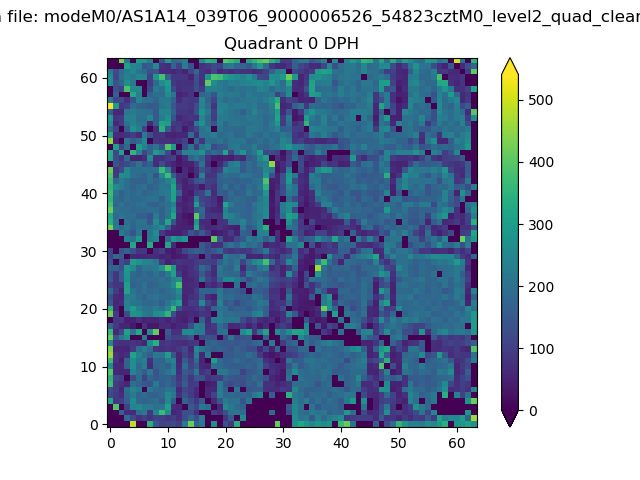 |
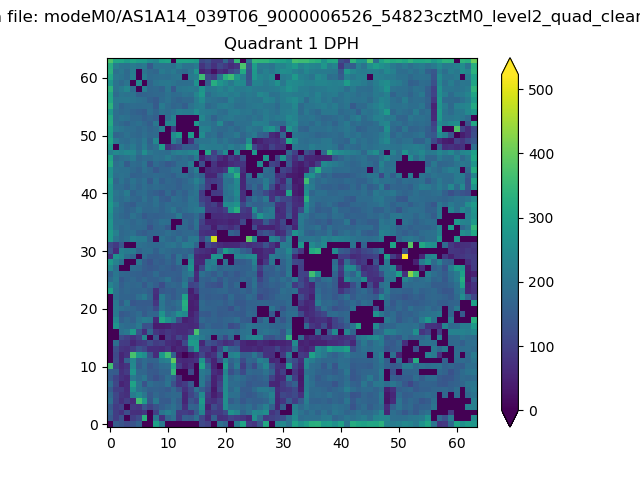 |
Quadrant B |
|---|---|---|---|
| Quadrant D | 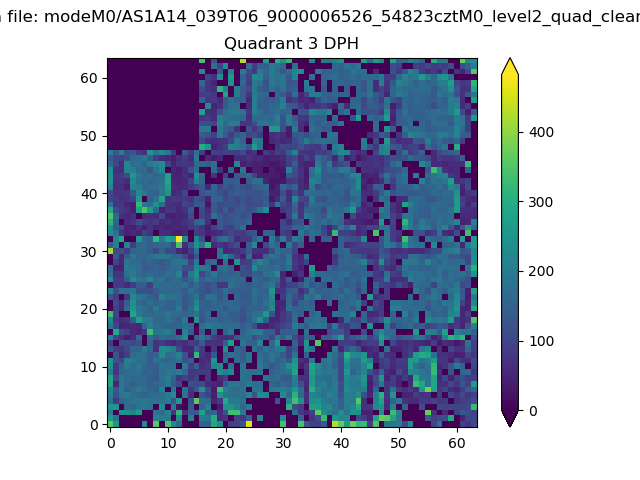 |
 |
Quadrant C |
| Plot type | Count rate plots | Images |
|---|---|---|
| Comparison with Poisson distribution Blue bars denote a histogram of data divided into 1 sec bins. Red curve is a Poisson curve with rate = median count rate of data. |
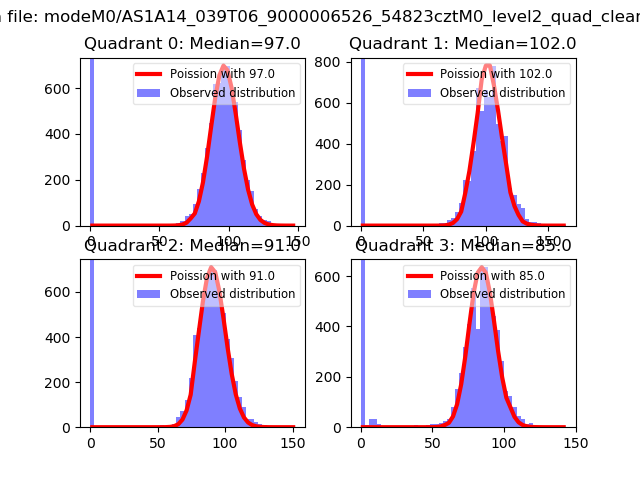 |
 |
| Quadrant-wise count rates Data is divided into 100 sec bins |
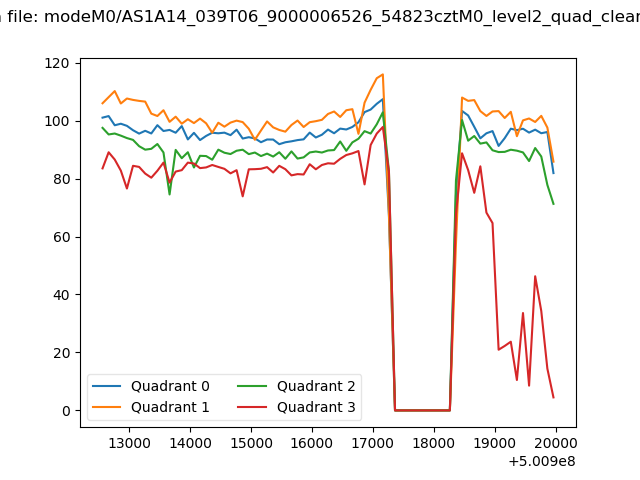 |
|
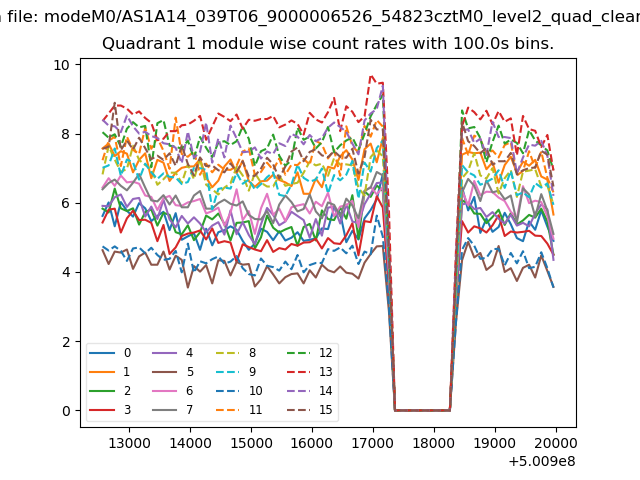
| Module-wise count rates for Quadrant A Data is divided into 100 sec bins |
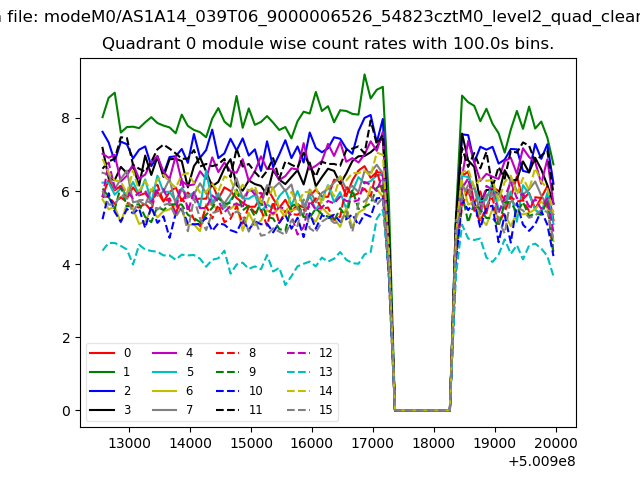 |
 |
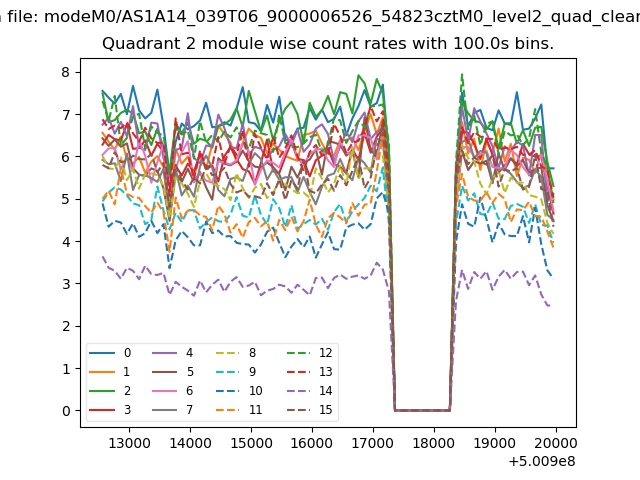
| Module-wise count rates for Quadrant B Data is divided into 100 sec bins |
 |
 |
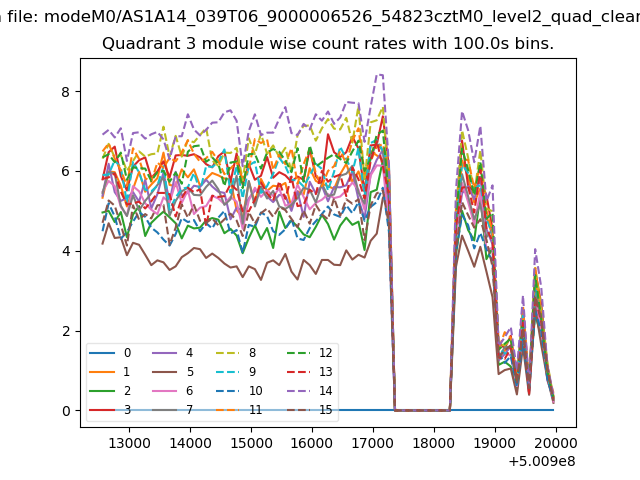
| Module-wise count rates for Quadrant C Data is divided into 100 sec bins |
 |
 |
| Module-wise count rates for Quadrant D Data is divided into 100 sec bins |
 |
 |
| Parameter | Plot |
|---|---|
| CZT HV Monitor | 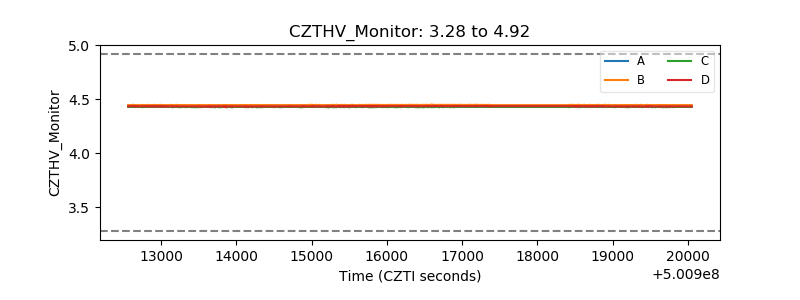 |
| D_VDD | 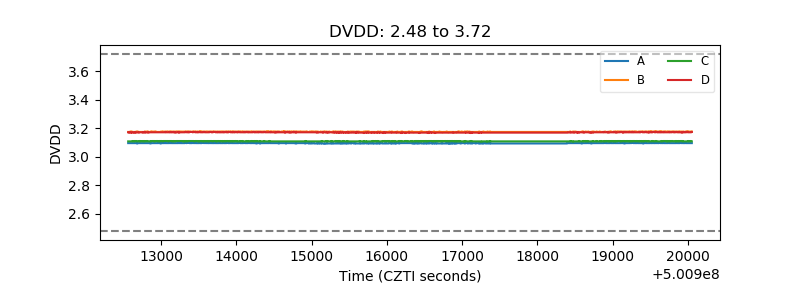 |
| Temperature 1 | 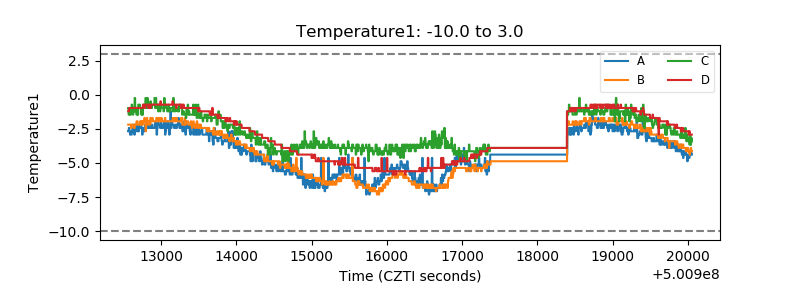 |
| Veto HV Monitor | 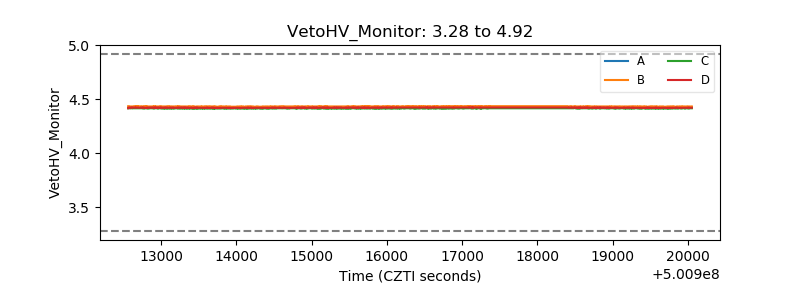 |
| Veto LLD | 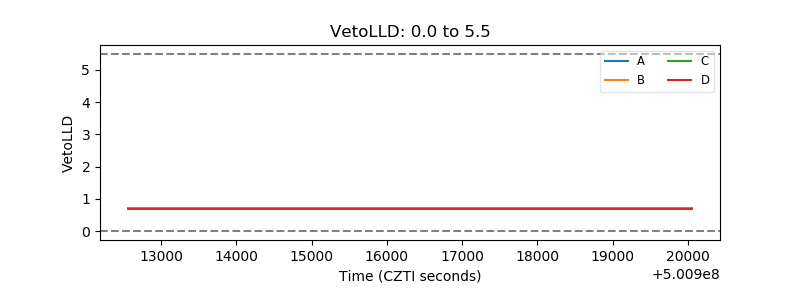 |
| Alpha Counter | 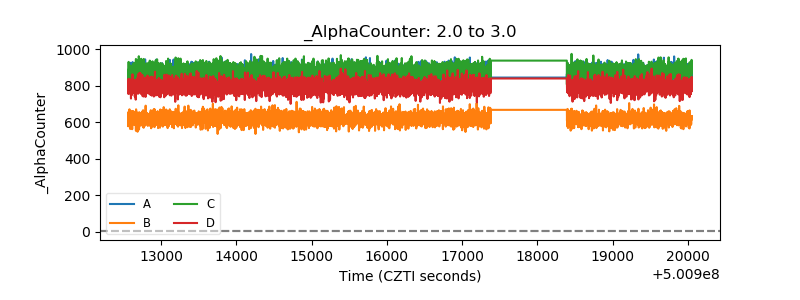 |
| _CPM_Rate | 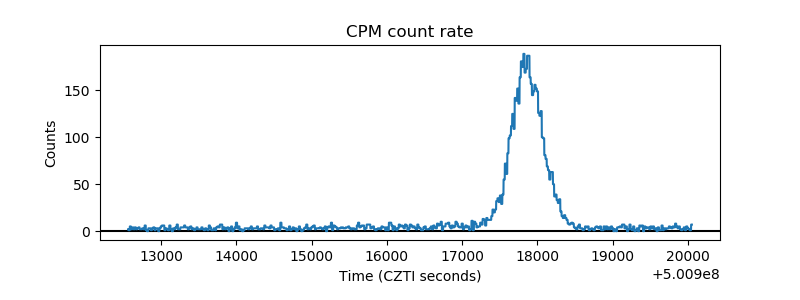 |
| CZT Counter | 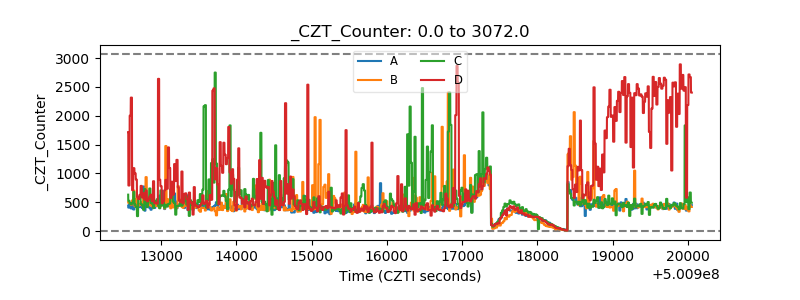 |
| +2.5 Volts monitor |  |
| +5 Volts monitor |  |
| _ROLL_ROT | 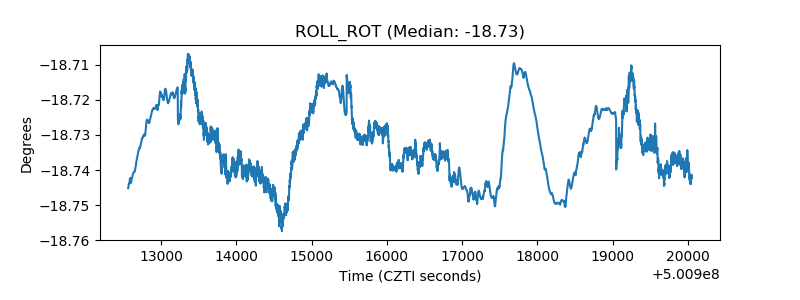 |
| _Roll_DEC | 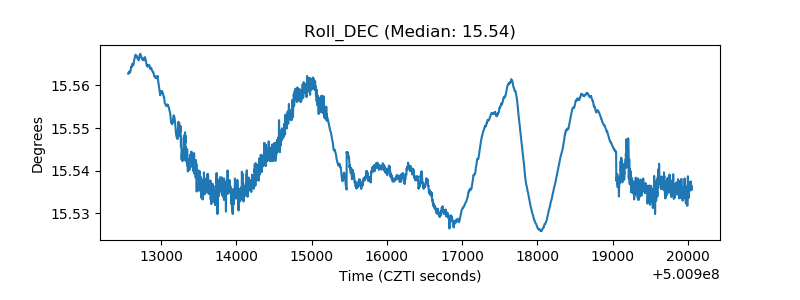 |
| _Roll_RA | 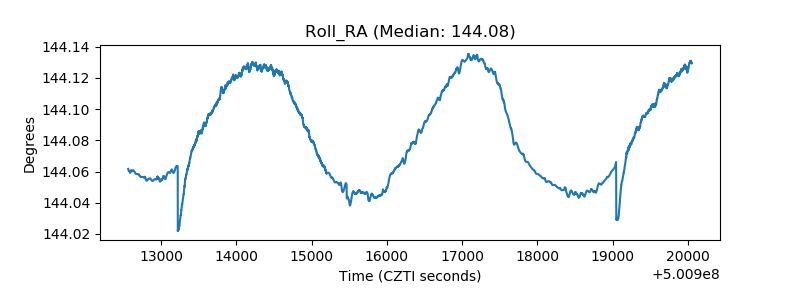 |
| Veto Counter | 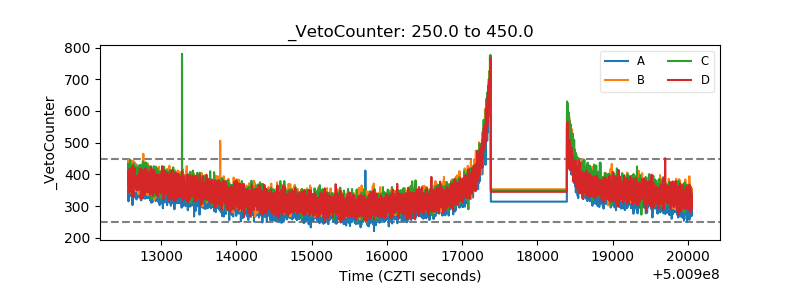 |