| Param | Original file | Final file |
|---|---|---|
| Filename | modeM0/AS1A14_039T06_9000006526_54826cztM0_level2.fits | modeM0/AS1A14_039T06_9000006526_54826cztM0_level2_quad_clean.evt |
| Size (bytes) | 686,537,280 | 122,794,560 |
| Size | 654.7 MB | 117.1 MB |
| Events in quadrant A | 4,206,746 | 826,036 |
| Events in quadrant B | 5,126,859 | 861,597 |
| Events in quadrant C | 6,032,286 | 758,960 |
| Events in quadrant D | 9,371,308 | 665,554 |
| Mode M0 | |||
|---|---|---|---|
| Quadrant | BADHDUFLAG | Total packets | Discarded packets |
| A | 0 | 19113 | 1 |
| B | 0 | 21770 | 1 |
| C | 0 | 24054 | 1 |
| D | 0 | 33942 | 2 |
| Mode SS | |||
|---|---|---|---|
| Quadrant | BADHDUFLAG | Total packets | Discarded packets |
| A | 0 | 174 | 0 |
| B | 0 | 174 | 0 |
| C | 0 | 174 | 0 |
| D | 0 | 174 | 0 |
| Quadrant | Total seconds | Saturated seconds | Saturation percentage |
|---|---|---|---|
| A | 8728 | 85 | 0.973877% |
| B | 8728 | 439 | 5.029789% |
| C | 8728 | 451 | 5.167278% |
| D | 8728 | 1073 | 12.293767% |
Noise dominated data is calculated using 1-second bins in cleaned event files. If a bin has >2000 counts, and if more than 50% of those come from <1% of pixels, then it is considered to be noise-dominated and hence unusable.
| Quadrant | # 1 sec bins | Bins with >0 counts | Bins with >2000 counts | High rate bins dominated by noise | Noise dominated (total time) | Noise dominated (detector-on time) | Marked lightcurve |
|---|---|---|---|---|---|---|---|
| A | 8743 | 8729 | 39 | 39 | 0.45% | 0.45% | 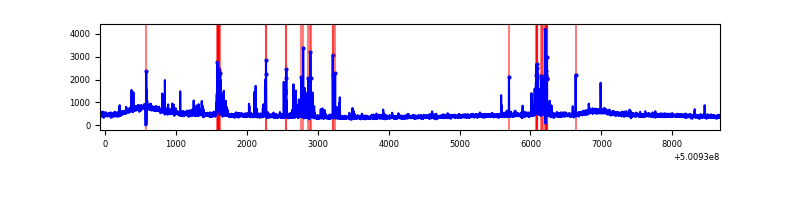 |
| B | 8743 | 8729 | 235 | 235 | 2.69% | 2.69% | 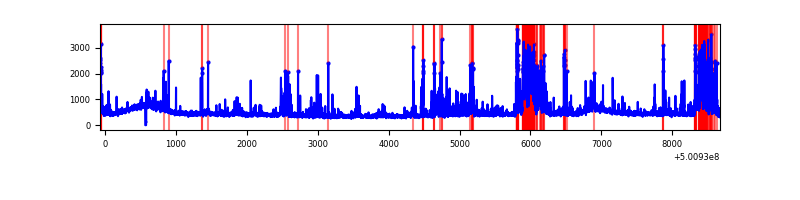 |
| C | 8743 | 8729 | 286 | 286 | 3.27% | 3.28% | 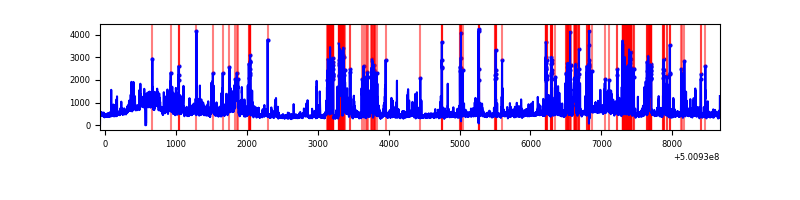 |
| D | 8743 | 8729 | 898 | 898 | 10.27% | 10.29% | 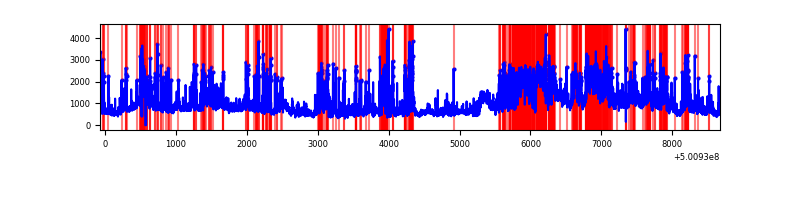 |
Top three noisy pixels from each quadrant. If the there are fewer than three noisy pixels in the level2.evt file, extra rows are filled as -1
| Pixel properties | Quadrant properties | ||||||
|---|---|---|---|---|---|---|---|
| Quadrant | DetID | PixID | Counts | Sigma | Mean | Median | Sigma |
| A | 13 | 248 | 219941 | 928.26 | 960 | 934 | 235.9 |
| A | 12 | 15 | 117461 | 493.9 | 960 | 934 | 235.9 |
| A | 4 | 3 | 27428 | 112.29 | 960 | 934 | 235.9 |
| B | 5 | 185 | 979518 | 4861.96 | 937 | 901 | 201.3 |
| B | 10 | 247 | 330877 | 1639.39 | 937 | 901 | 201.3 |
| B | 12 | 111 | 24365 | 116.57 | 937 | 901 | 201.3 |
| C | 12 | 252 | 969583 | 3835.6 | 923 | 918 | 252.5 |
| C | 13 | 3 | 561334 | 2219.07 | 923 | 918 | 252.5 |
| C | 4 | 5 | 400751 | 1583.21 | 923 | 918 | 252.5 |
| D | 1 | 31 | 1686030 | 6735.92 | 889 | 853 | 250.2 |
| D | 2 | 172 | 1478256 | 5905.42 | 889 | 853 | 250.2 |
| D | 3 | 12 | 1023335 | 4087.02 | 889 | 853 | 250.2 |
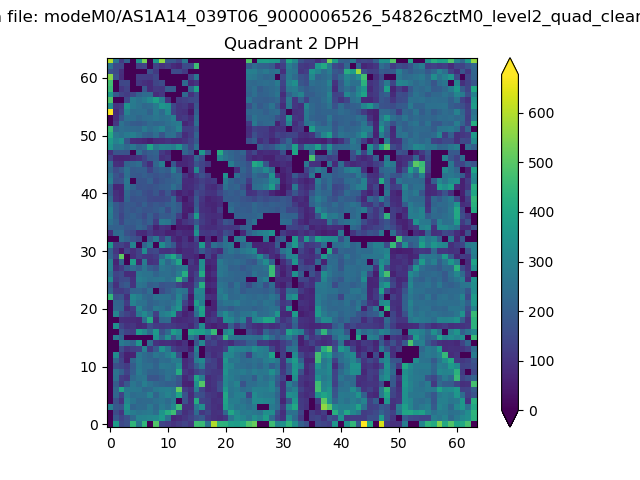
Histogram calculated using DETX and DETY for each event in the final _common_clean file
| Quadrant A |  |
 |
Quadrant B |
|---|---|---|---|
| Quadrant D |  |
 |
Quadrant C |
| Plot type | Count rate plots | Images |
|---|---|---|
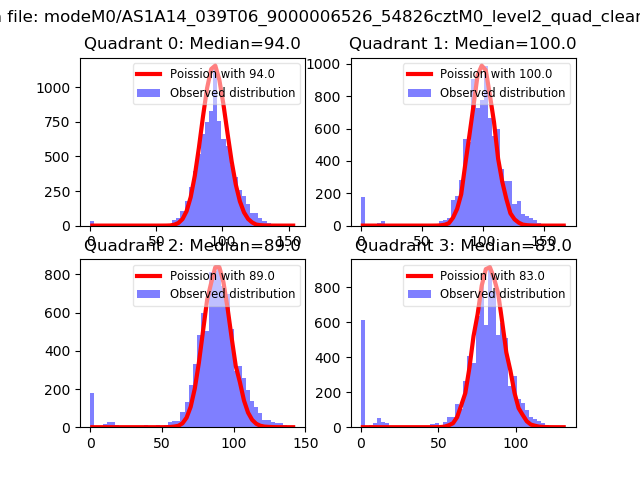
| Comparison with Poisson distribution Blue bars denote a histogram of data divided into 1 sec bins. Red curve is a Poisson curve with rate = median count rate of data. |
 |
 |
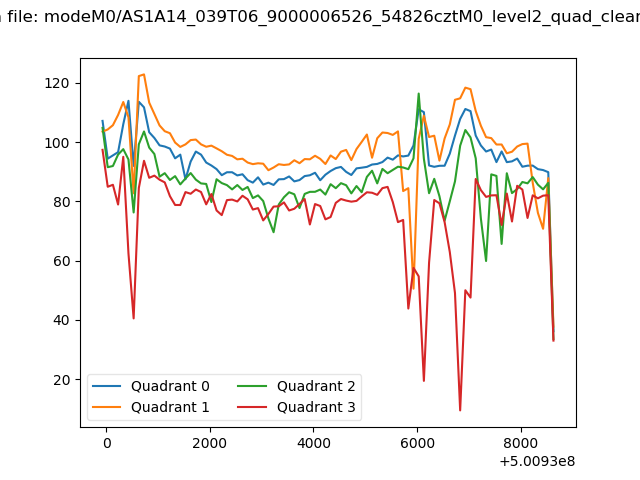
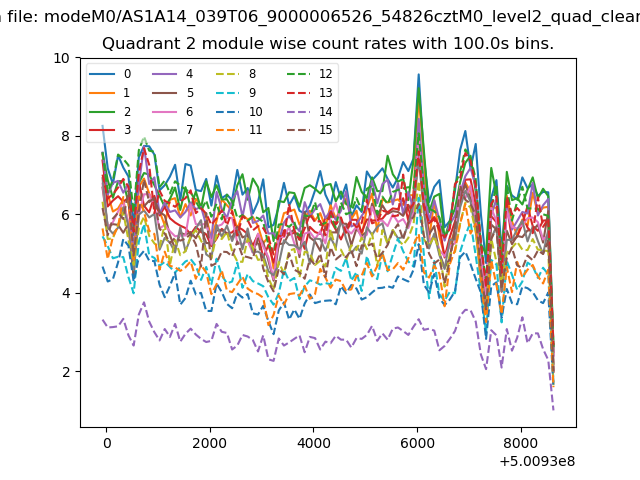
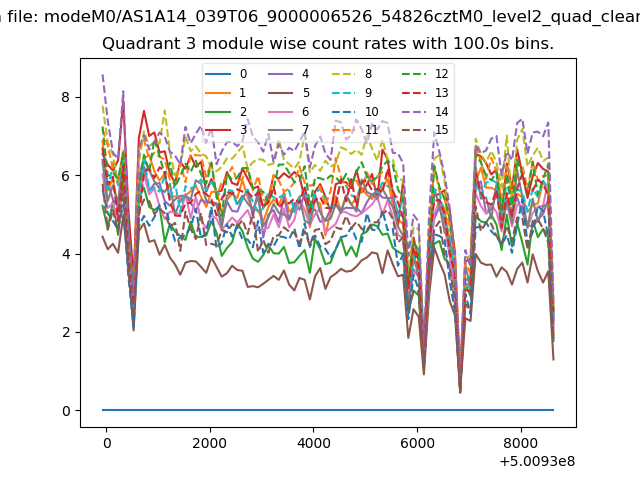
| Quadrant-wise count rates Data is divided into 100 sec bins |
 |
|
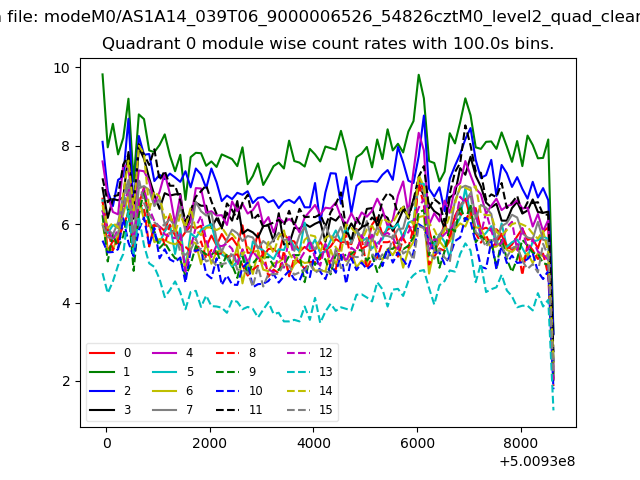
| Module-wise count rates for Quadrant A Data is divided into 100 sec bins |
 |
 |
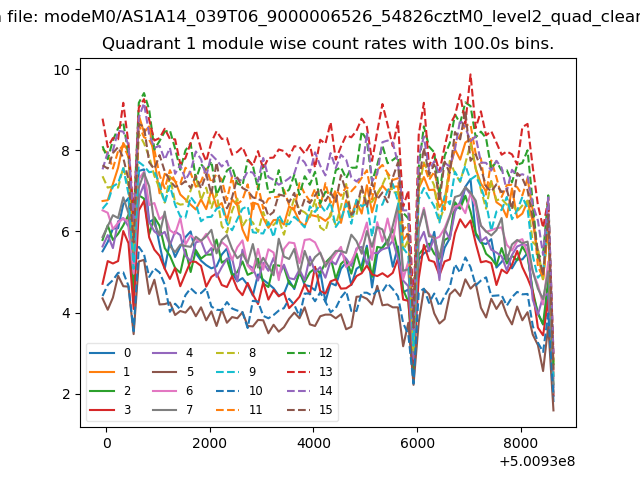
| Module-wise count rates for Quadrant B Data is divided into 100 sec bins |
 |
 |
| Module-wise count rates for Quadrant C Data is divided into 100 sec bins |
 |
 |
| Module-wise count rates for Quadrant D Data is divided into 100 sec bins |
 |
 |
| Parameter | Plot |
|---|---|
| CZT HV Monitor | 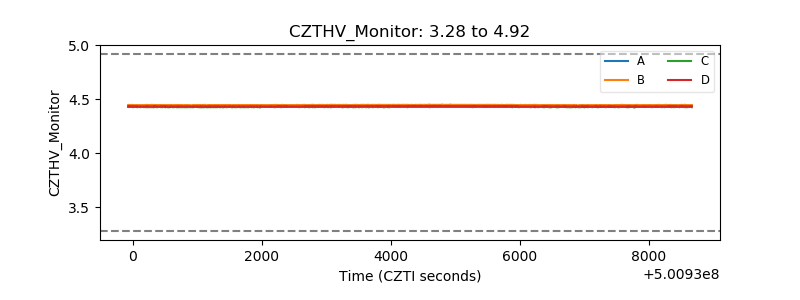 |
| D_VDD | 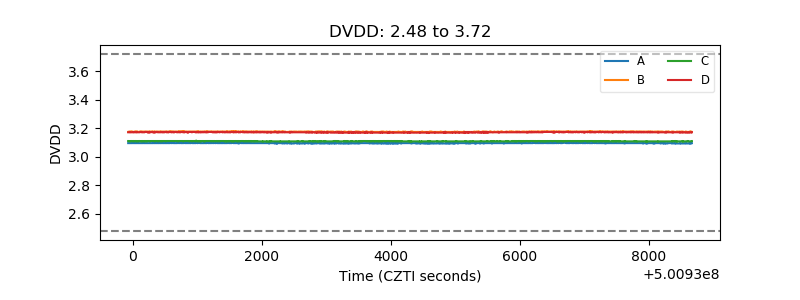 |
| Temperature 1 | 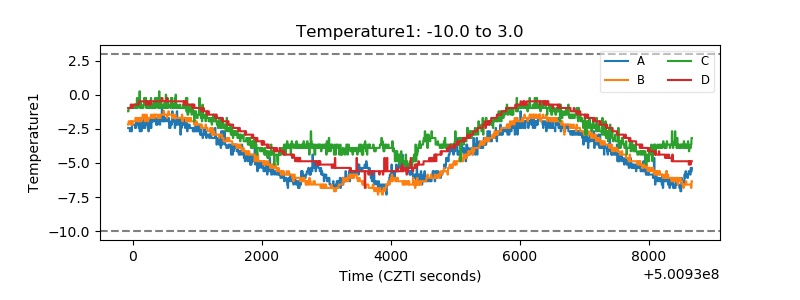 |
| Veto HV Monitor | 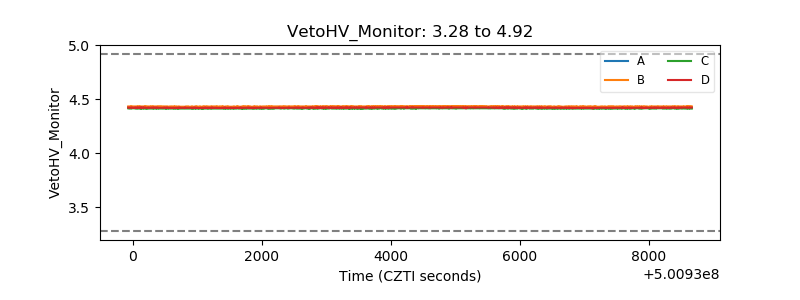 |
| Veto LLD | 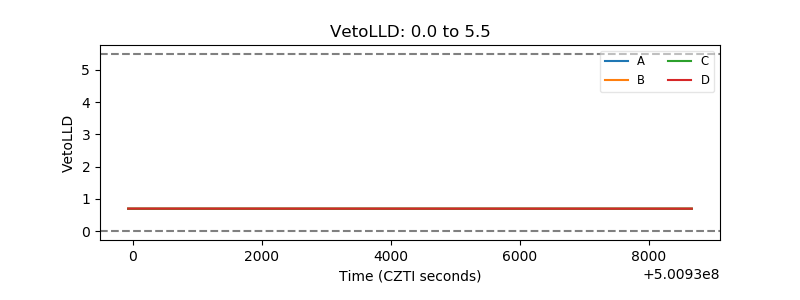 |
| Alpha Counter | 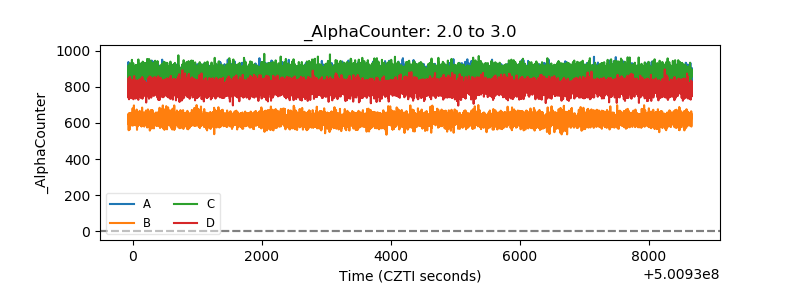 |
| _CPM_Rate | 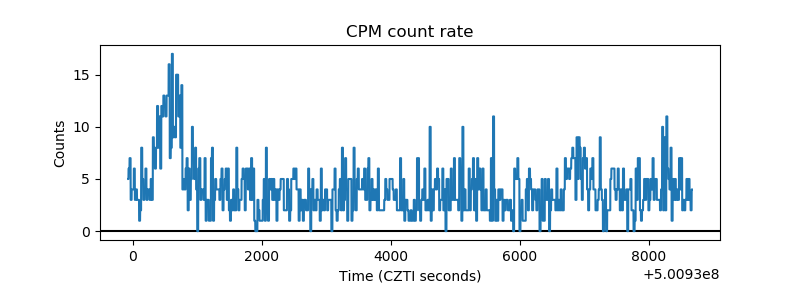 |
| CZT Counter | 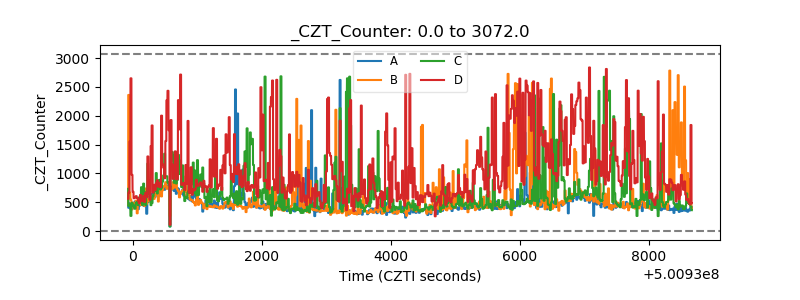 |
| +2.5 Volts monitor |  |
| +5 Volts monitor |  |
| _ROLL_ROT |  |
| _Roll_DEC | 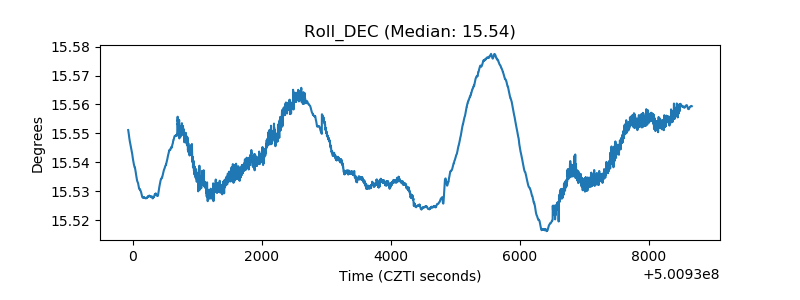 |
| _Roll_RA | 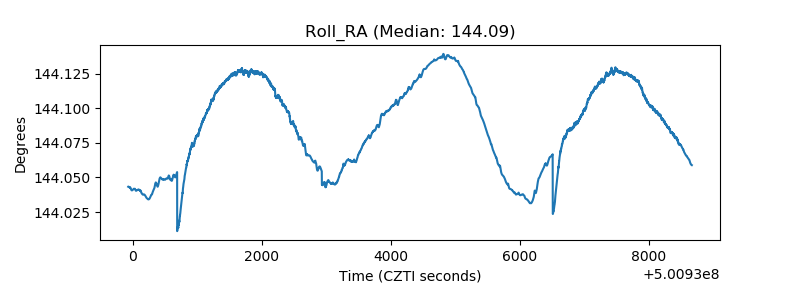 |
| Veto Counter | 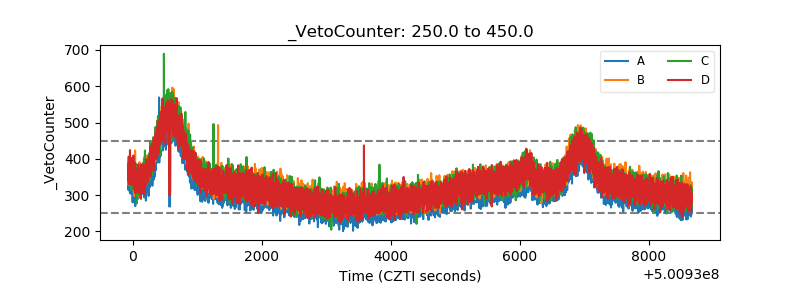 |