| Param | Original file | Final file |
|---|---|---|
| Filename | modeM0/AS1A14_039T06_9000006526_54831cztM0_level2.fits | modeM0/AS1A14_039T06_9000006526_54831cztM0_level2_quad_clean.evt |
| Size (bytes) | 450,547,200 | 102,720,960 |
| Size | 429.7 MB | 98.0 MB |
| Events in quadrant A | 3,217,522 | 675,120 |
| Events in quadrant B | 3,359,402 | 717,593 |
| Events in quadrant C | 4,361,648 | 622,611 |
| Events in quadrant D | 5,173,600 | 589,487 |
| Mode M9 | |||
|---|---|---|---|
| Quadrant | BADHDUFLAG | Total packets | Discarded packets |
| A | 0 | 16 | 0 |
| B | 0 | 16 | 0 |
| C | 0 | 16 | 0 |
| D | 0 | 16 | 0 |
| Mode M0 | |||
|---|---|---|---|
| Quadrant | BADHDUFLAG | Total packets | Discarded packets |
| A | 0 | 15373 | 2 |
| B | 0 | 15629 | 2 |
| C | 0 | 18473 | 2 |
| D | 0 | 20260 | 2 |
| Mode SS | |||
|---|---|---|---|
| Quadrant | BADHDUFLAG | Total packets | Discarded packets |
| A | 0 | 146 | 0 |
| B | 0 | 146 | 0 |
| C | 0 | 146 | 0 |
| D | 0 | 146 | 0 |
| Quadrant | Total seconds | Saturated seconds | Saturation percentage |
|---|---|---|---|
| A | 7272 | 85 | 1.168867% |
| B | 7272 | 109 | 1.498900% |
| C | 7272 | 286 | 3.932893% |
| D | 7273 | 302 | 4.152344% |
Noise dominated data is calculated using 1-second bins in cleaned event files. If a bin has >2000 counts, and if more than 50% of those come from <1% of pixels, then it is considered to be noise-dominated and hence unusable.
| Quadrant | # 1 sec bins | Bins with >0 counts | Bins with >2000 counts | High rate bins dominated by noise | Noise dominated (total time) | Noise dominated (detector-on time) | Marked lightcurve |
|---|---|---|---|---|---|---|---|
| A | 8762 | 7274 | 31 | 31 | 0.35% | 0.43% | 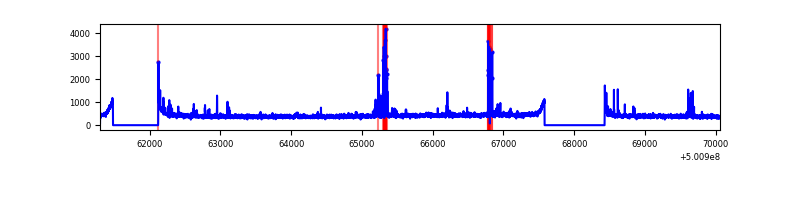 |
| B | 8762 | 7274 | 26 | 26 | 0.30% | 0.36% | 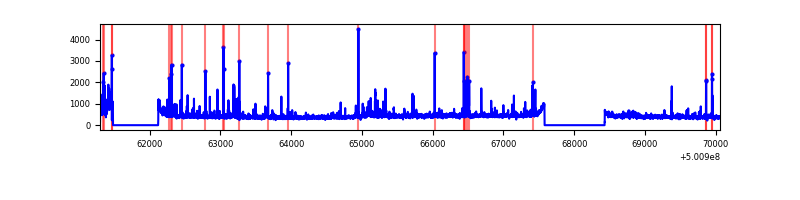 |
| C | 8762 | 7274 | 260 | 260 | 2.97% | 3.57% | 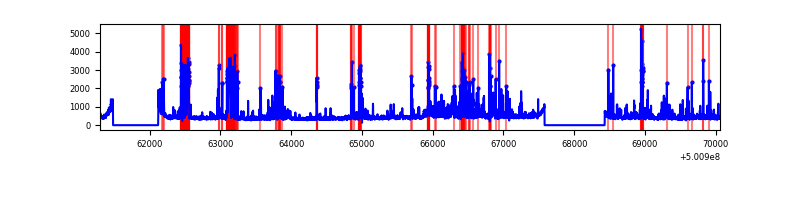 |
| D | 8763 | 7275 | 253 | 253 | 2.89% | 3.48% | 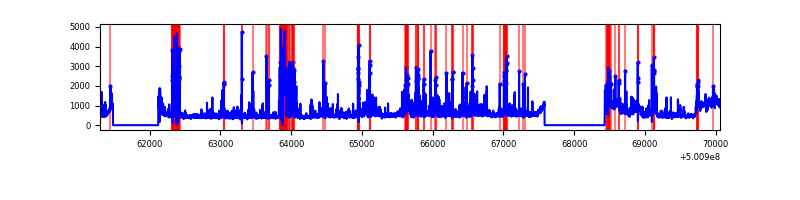 |
Top three noisy pixels from each quadrant. If the there are fewer than three noisy pixels in the level2.evt file, extra rows are filled as -1
| Pixel properties | Quadrant properties | ||||||
|---|---|---|---|---|---|---|---|
| Quadrant | DetID | PixID | Counts | Sigma | Mean | Median | Sigma |
| A | 13 | 248 | 98809 | 524.48 | 755 | 737 | 187.0 |
| A | 3 | 45 | 52524 | 276.95 | 755 | 737 | 187.0 |
| A | 3 | 14 | 46862 | 246.67 | 755 | 737 | 187.0 |
| B | 5 | 236 | 272585 | 1669.3 | 744 | 717 | 162.9 |
| B | 5 | 185 | 56992 | 345.54 | 744 | 717 | 162.9 |
| B | 10 | 247 | 47455 | 286.98 | 744 | 717 | 162.9 |
| C | 12 | 252 | 449188 | 2271.27 | 719 | 713 | 197.5 |
| C | 4 | 5 | 386368 | 1953.12 | 719 | 713 | 197.5 |
| C | 13 | 3 | 308043 | 1556.45 | 719 | 713 | 197.5 |
| D | 11 | 129 | 578529 | 2863.16 | 711 | 681 | 201.8 |
| D | 5 | 38 | 395498 | 1956.27 | 711 | 681 | 201.8 |
| D | 2 | 252 | 246798 | 1219.48 | 711 | 681 | 201.8 |
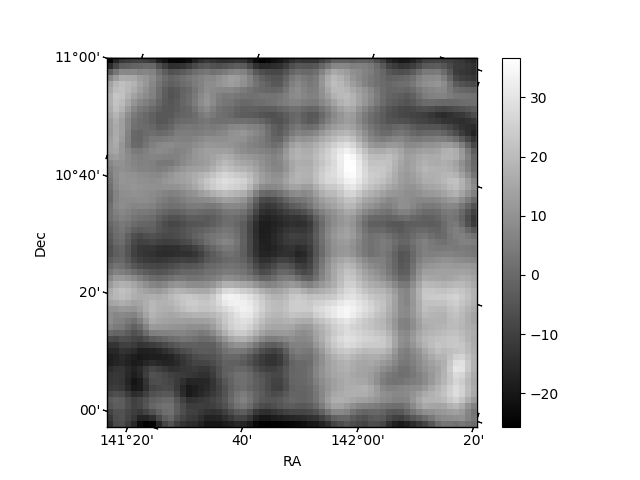
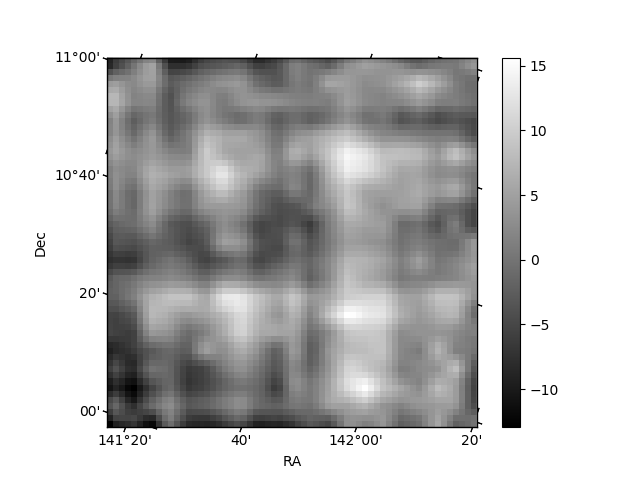
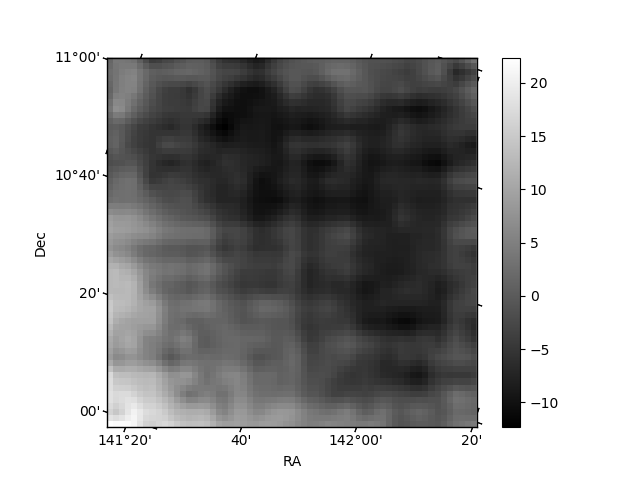
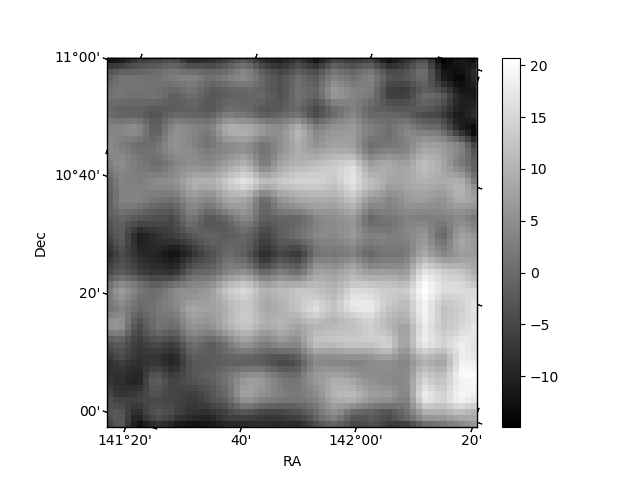
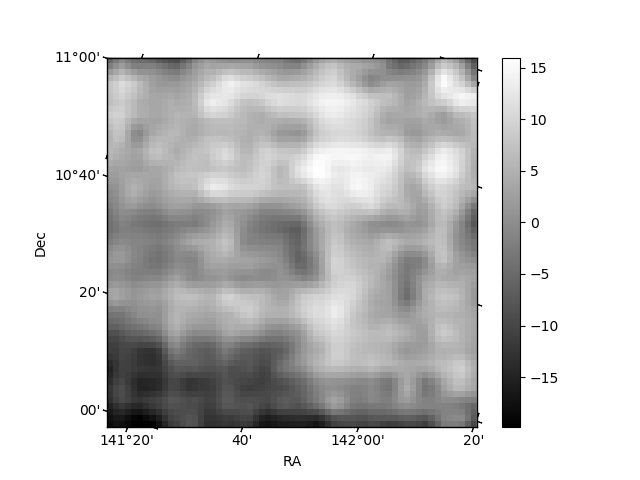
Histogram calculated using DETX and DETY for each event in the final _common_clean file
| Quadrant A | 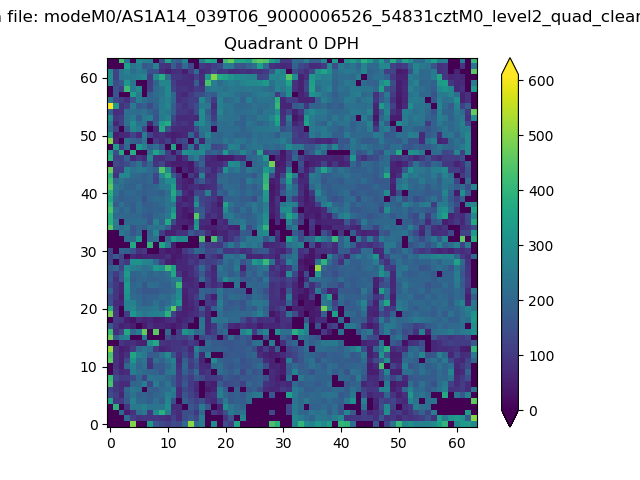 |
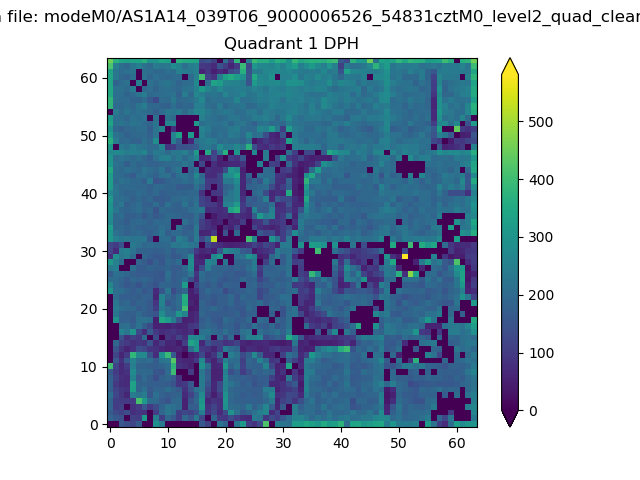 |
Quadrant B |
|---|---|---|---|
| Quadrant D | 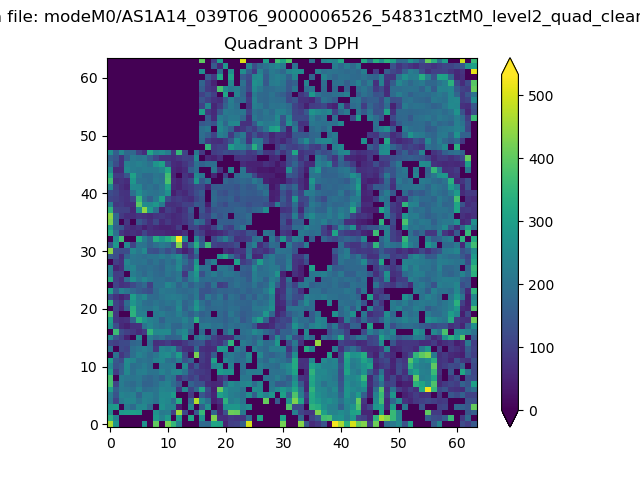 |
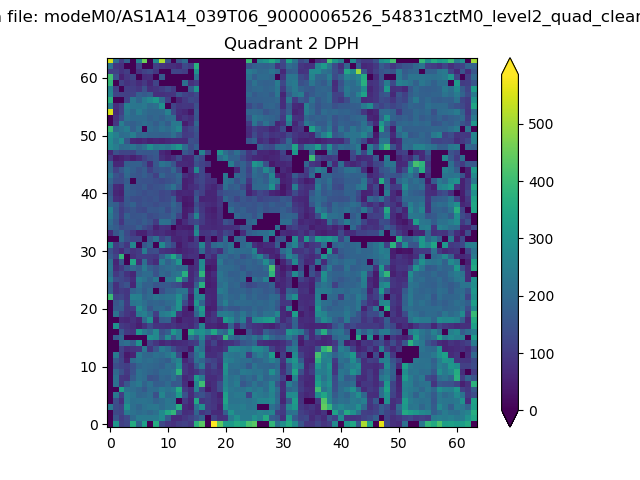 |
Quadrant C |
| Plot type | Count rate plots | Images |
|---|---|---|
| Comparison with Poisson distribution Blue bars denote a histogram of data divided into 1 sec bins. Red curve is a Poisson curve with rate = median count rate of data. |
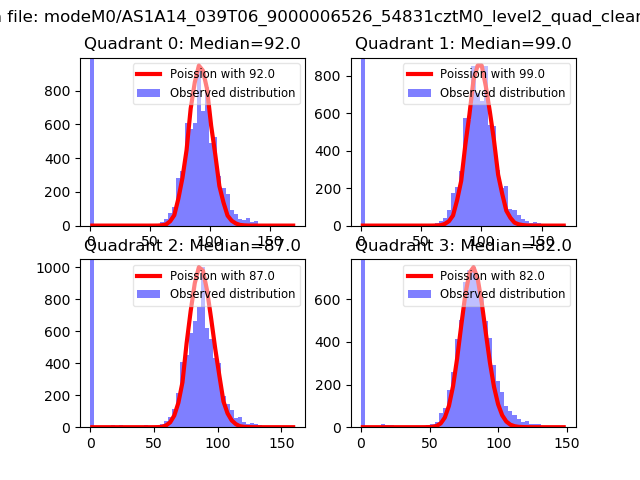 |
 |
| Quadrant-wise count rates Data is divided into 100 sec bins |
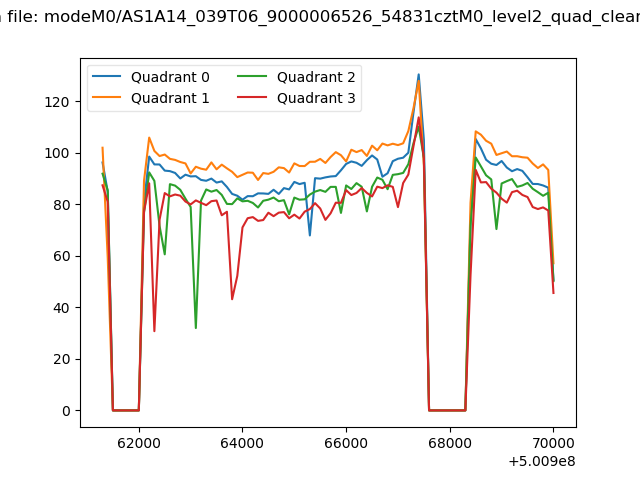 |
|
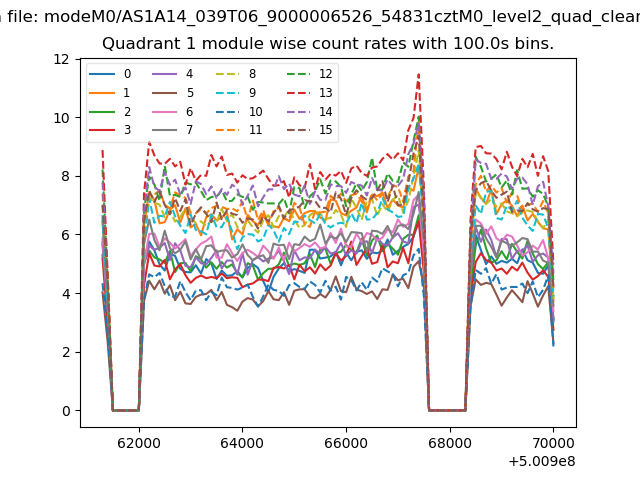
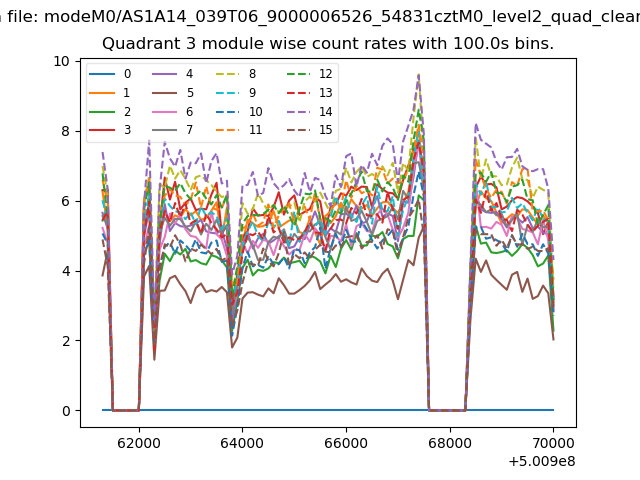
| Module-wise count rates for Quadrant A Data is divided into 100 sec bins |
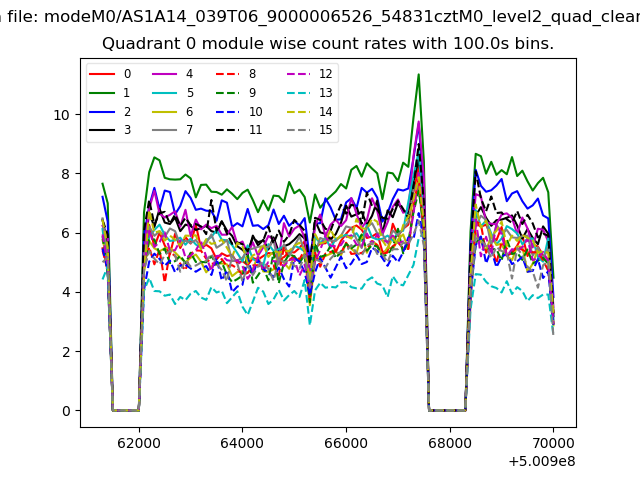 |
 |
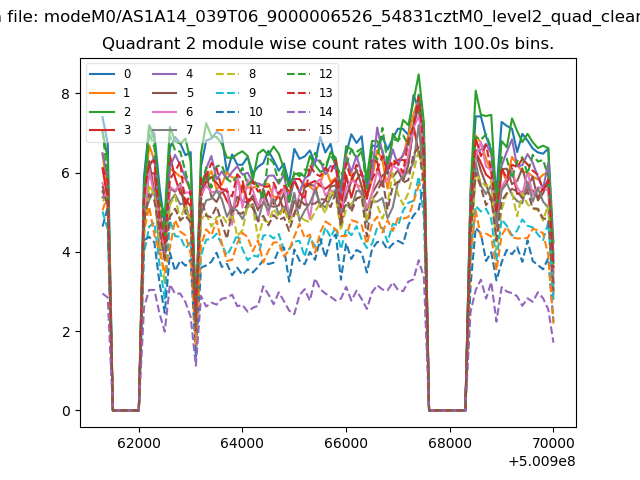
| Module-wise count rates for Quadrant B Data is divided into 100 sec bins |
 |
 |
| Module-wise count rates for Quadrant C Data is divided into 100 sec bins |
 |
 |
| Module-wise count rates for Quadrant D Data is divided into 100 sec bins |
 |
 |
| Parameter | Plot |
|---|---|
| CZT HV Monitor | 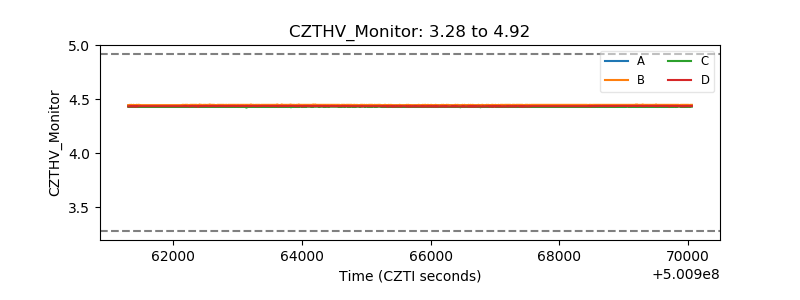 |
| D_VDD | 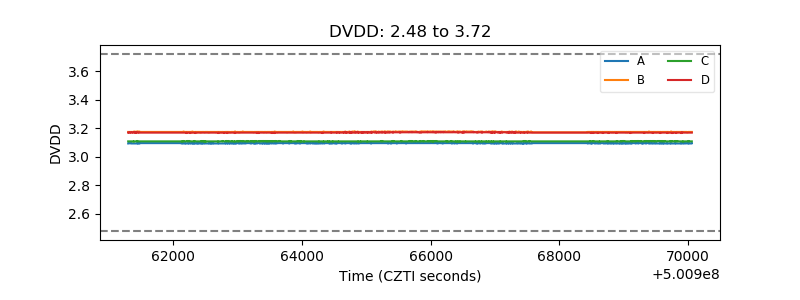 |
| Temperature 1 | 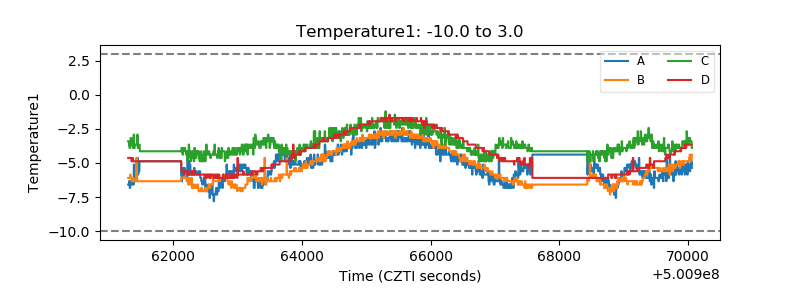 |
| Veto HV Monitor |  |
| Veto LLD | 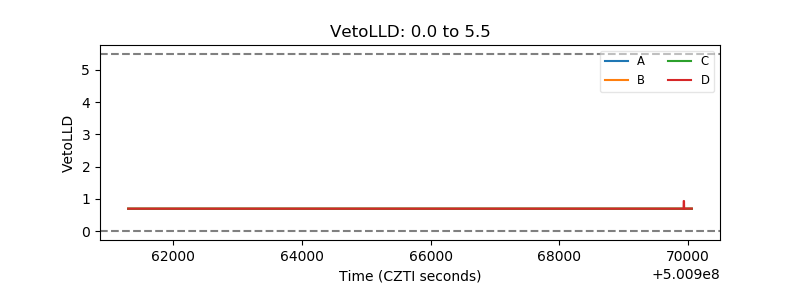 |
| Alpha Counter | 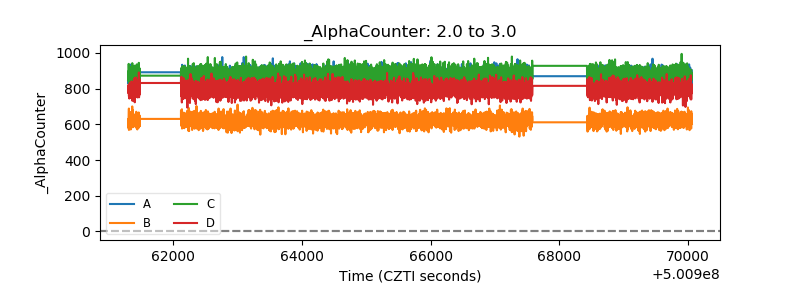 |
| _CPM_Rate | 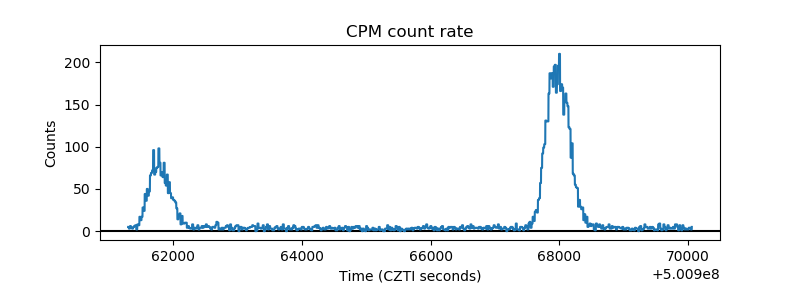 |
| CZT Counter |  |
| +2.5 Volts monitor |  |
| +5 Volts monitor |  |
| _ROLL_ROT | 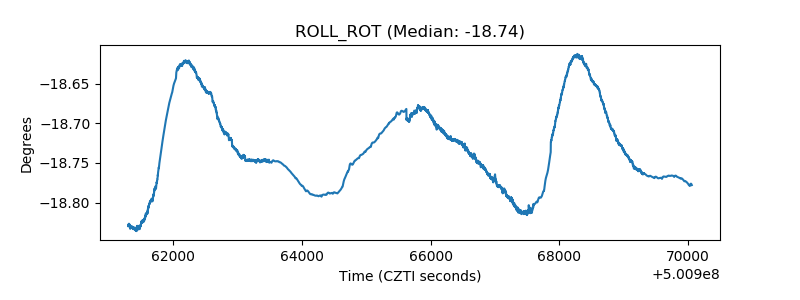 |
| _Roll_DEC | 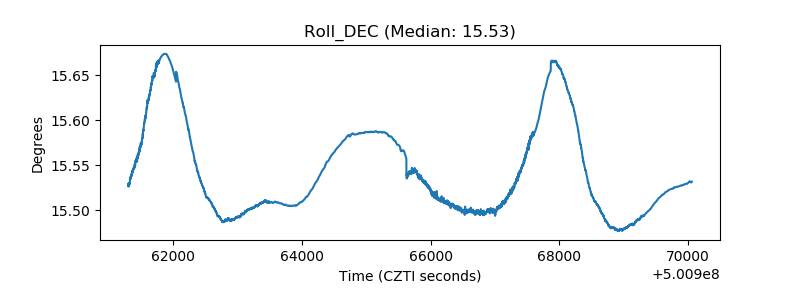 |
| _Roll_RA | 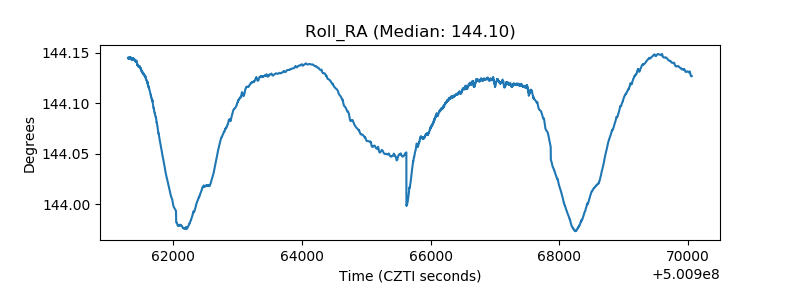 |
| Veto Counter | 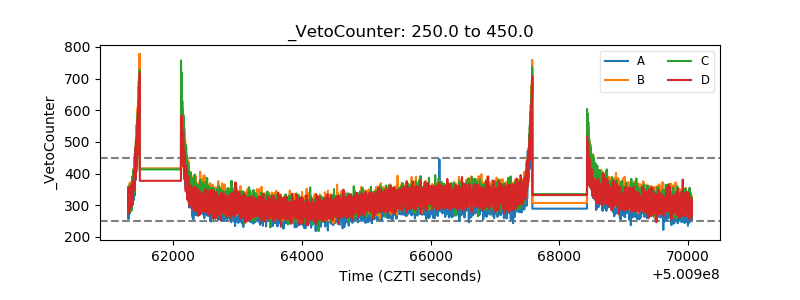 |