| Param | Original file | Final file |
|---|---|---|
| Filename | modeM0/AS1A14_039T06_9000006526_54833cztM0_level2.fits | modeM0/AS1A14_039T06_9000006526_54833cztM0_level2_quad_clean.evt |
| Size (bytes) | 382,518,720 | 95,287,680 |
| Size | 364.8 MB | 90.9 MB |
| Events in quadrant A | 2,915,601 | 622,279 |
| Events in quadrant B | 2,970,626 | 662,835 |
| Events in quadrant C | 3,346,765 | 589,768 |
| Events in quadrant D | 4,412,512 | 550,034 |
| Mode M9 | |||
|---|---|---|---|
| Quadrant | BADHDUFLAG | Total packets | Discarded packets |
| A | 0 | 9 | 0 |
| B | 0 | 9 | 0 |
| C | 0 | 9 | 0 |
| D | 0 | 9 | 0 |
| Mode M0 | |||
|---|---|---|---|
| Quadrant | BADHDUFLAG | Total packets | Discarded packets |
| A | 0 | 13876 | 2 |
| B | 0 | 13976 | 1 |
| C | 0 | 14902 | 1 |
| D | 0 | 17624 | 1 |
| Mode SS | |||
|---|---|---|---|
| Quadrant | BADHDUFLAG | Total packets | Discarded packets |
| A | 0 | 134 | 0 |
| B | 0 | 134 | 0 |
| C | 0 | 134 | 0 |
| D | 0 | 134 | 0 |
| Quadrant | Total seconds | Saturated seconds | Saturation percentage |
|---|---|---|---|
| A | 6604 | 77 | 1.165960% |
| B | 6604 | 107 | 1.620230% |
| C | 6604 | 105 | 1.589945% |
| D | 6604 | 184 | 2.786190% |
Noise dominated data is calculated using 1-second bins in cleaned event files. If a bin has >2000 counts, and if more than 50% of those come from <1% of pixels, then it is considered to be noise-dominated and hence unusable.
| Quadrant | # 1 sec bins | Bins with >0 counts | Bins with >2000 counts | High rate bins dominated by noise | Noise dominated (total time) | Noise dominated (detector-on time) | Marked lightcurve |
|---|---|---|---|---|---|---|---|
| A | 7524 | 6605 | 11 | 11 | 0.15% | 0.17% | 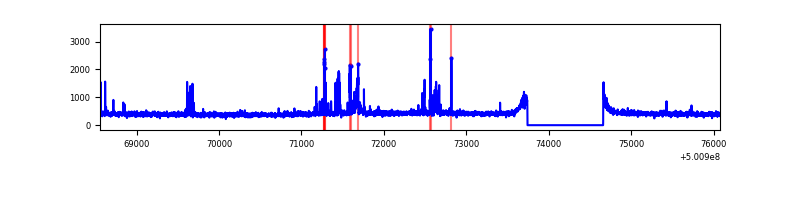 |
| B | 7524 | 6605 | 22 | 22 | 0.29% | 0.33% | 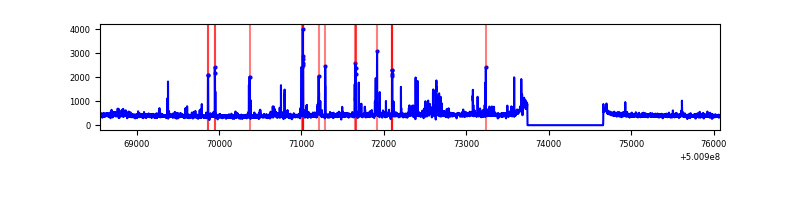 |
| C | 7524 | 6605 | 58 | 58 | 0.77% | 0.88% | 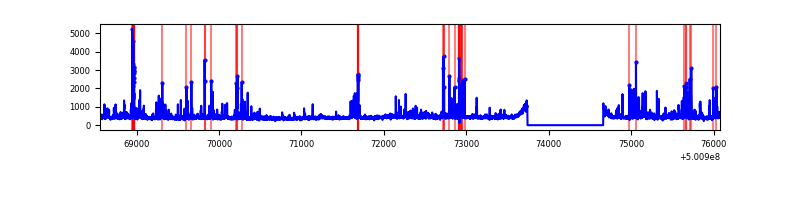 |
| D | 7524 | 6605 | 129 | 129 | 1.71% | 1.95% | 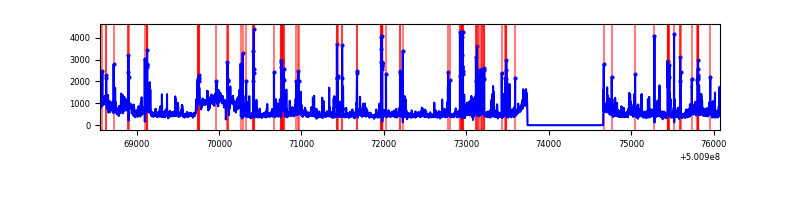 |
Top three noisy pixels from each quadrant. If the there are fewer than three noisy pixels in the level2.evt file, extra rows are filled as -1
| Pixel properties | Quadrant properties | ||||||
|---|---|---|---|---|---|---|---|
| Quadrant | DetID | PixID | Counts | Sigma | Mean | Median | Sigma |
| A | 13 | 248 | 139510 | 811.82 | 690 | 671 | 171.0 |
| A | 3 | 94 | 24923 | 141.8 | 690 | 671 | 171.0 |
| A | 0 | 8 | 19692 | 111.22 | 690 | 671 | 171.0 |
| B | 5 | 236 | 175810 | 1192.3 | 676 | 649 | 146.9 |
| B | 5 | 185 | 57543 | 387.27 | 676 | 649 | 146.9 |
| B | 10 | 247 | 35774 | 239.09 | 676 | 649 | 146.9 |
| C | 12 | 252 | 293597 | 1588.17 | 665 | 658 | 184.5 |
| C | 4 | 5 | 112063 | 603.98 | 665 | 658 | 184.5 |
| C | 13 | 3 | 101129 | 544.71 | 665 | 658 | 184.5 |
| D | 11 | 129 | 637438 | 3411.26 | 659 | 631 | 186.7 |
| D | 11 | 176 | 259561 | 1387.04 | 659 | 631 | 186.7 |
| D | 10 | 181 | 177751 | 948.8 | 659 | 631 | 186.7 |
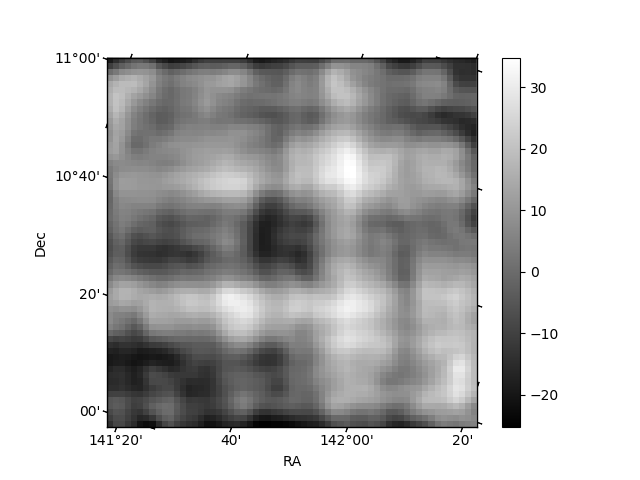
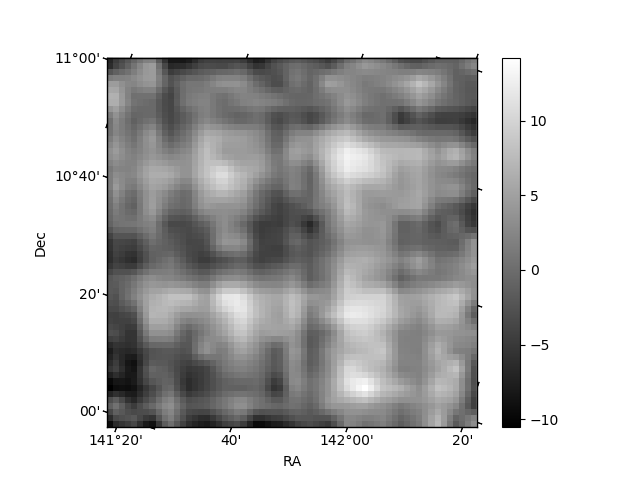
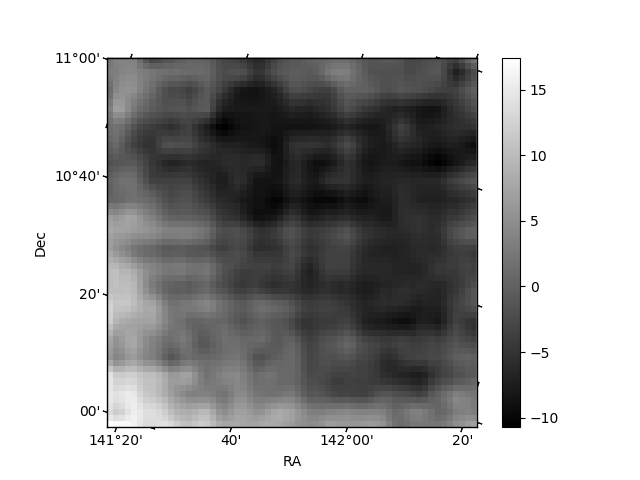
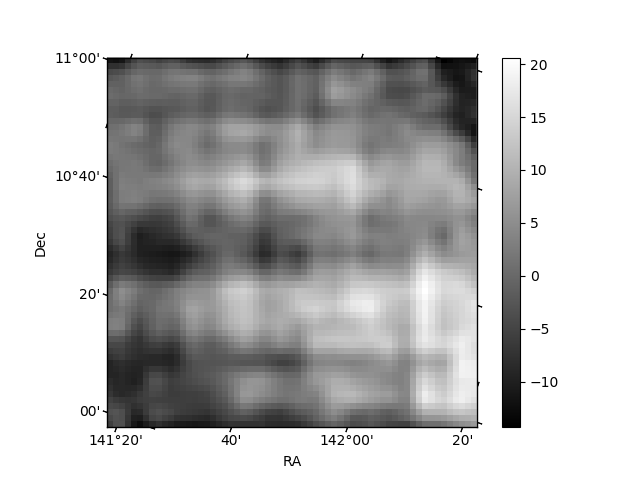
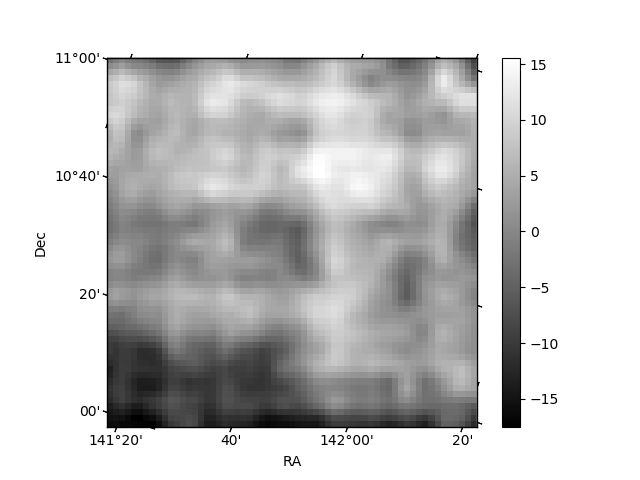
Histogram calculated using DETX and DETY for each event in the final _common_clean file
| Quadrant A | 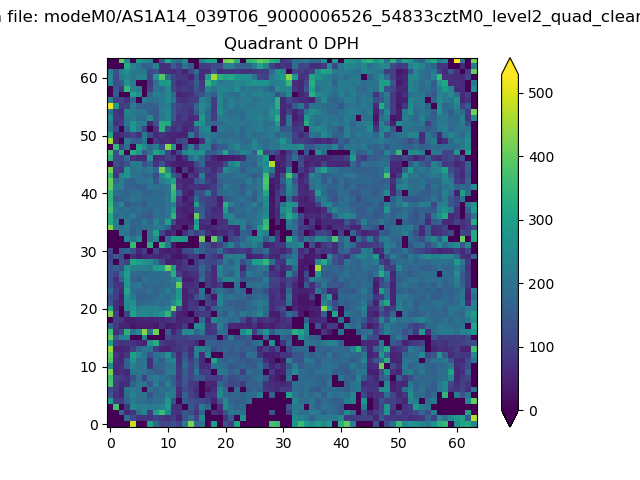 |
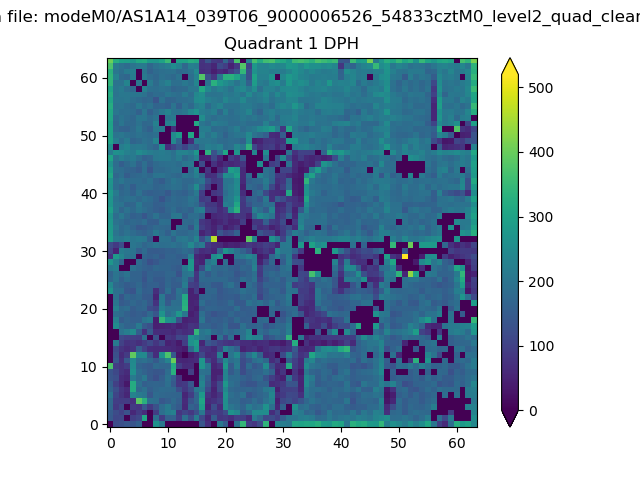 |
Quadrant B |
|---|---|---|---|
| Quadrant D | 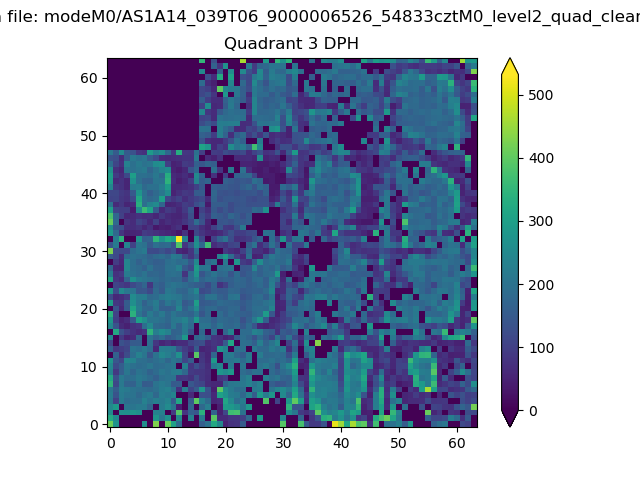 |
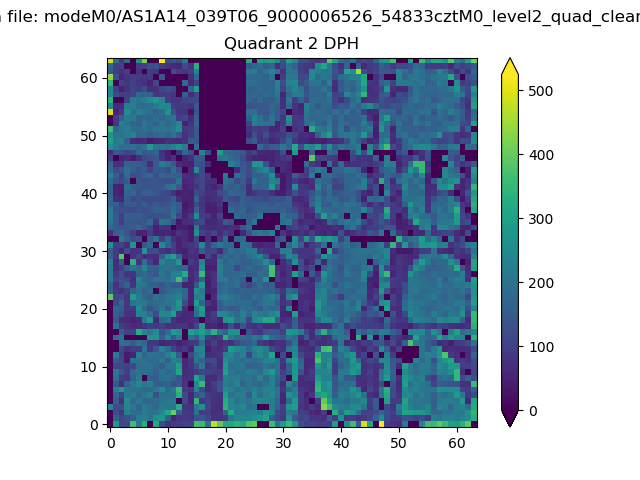 |
Quadrant C |
| Plot type | Count rate plots | Images |
|---|---|---|
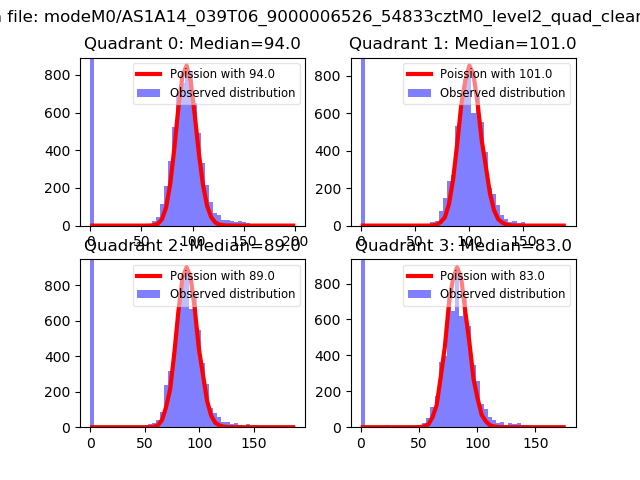
| Comparison with Poisson distribution Blue bars denote a histogram of data divided into 1 sec bins. Red curve is a Poisson curve with rate = median count rate of data. |
 |
 |
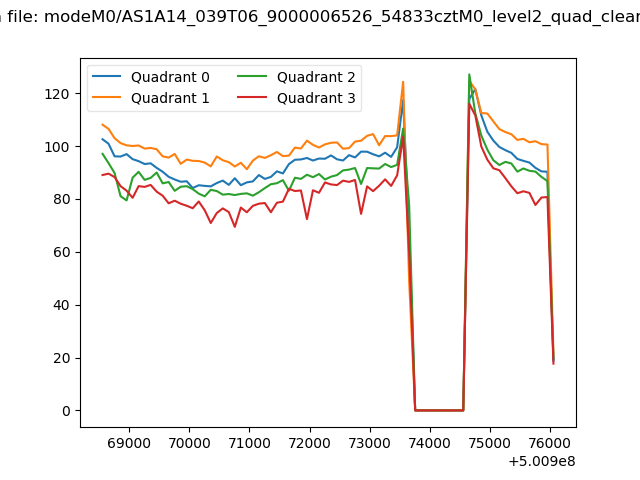
| Quadrant-wise count rates Data is divided into 100 sec bins |
 |
|
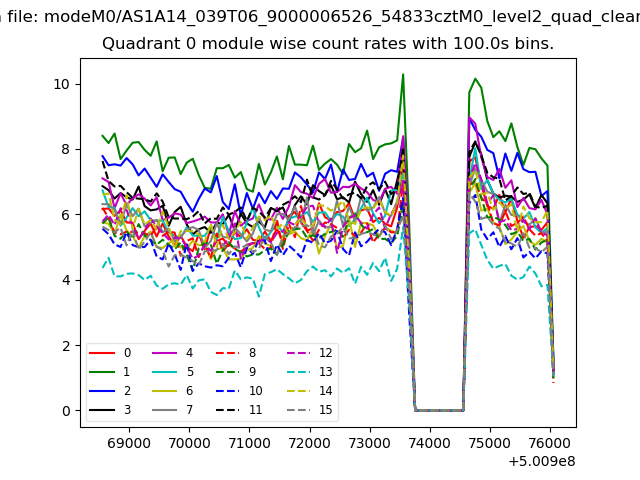
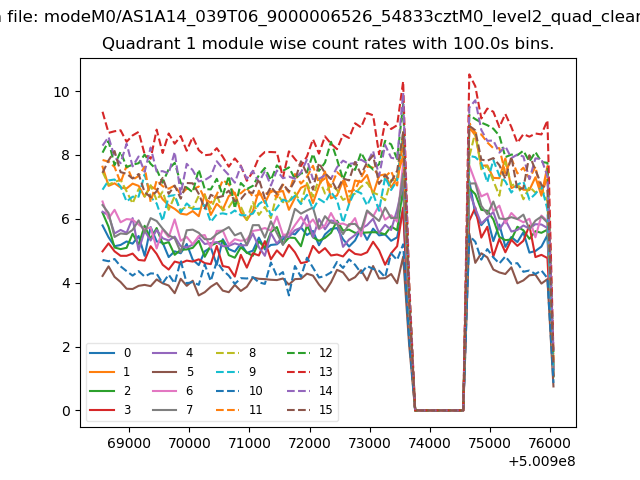
| Module-wise count rates for Quadrant A Data is divided into 100 sec bins |
 |
 |
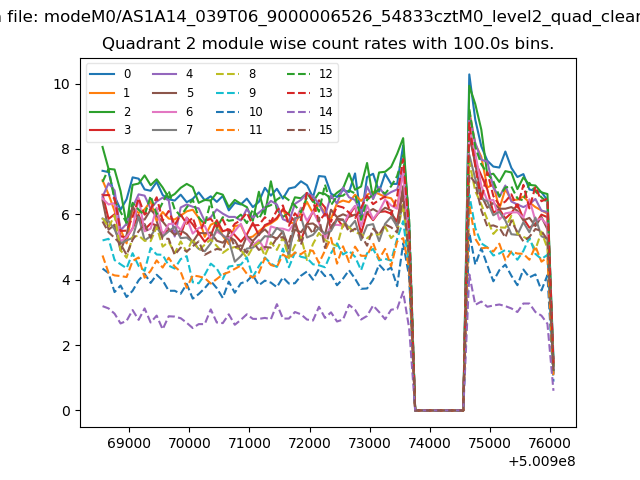
| Module-wise count rates for Quadrant B Data is divided into 100 sec bins |
 |
 |
| Module-wise count rates for Quadrant C Data is divided into 100 sec bins |
 |
 |
| Module-wise count rates for Quadrant D Data is divided into 100 sec bins |
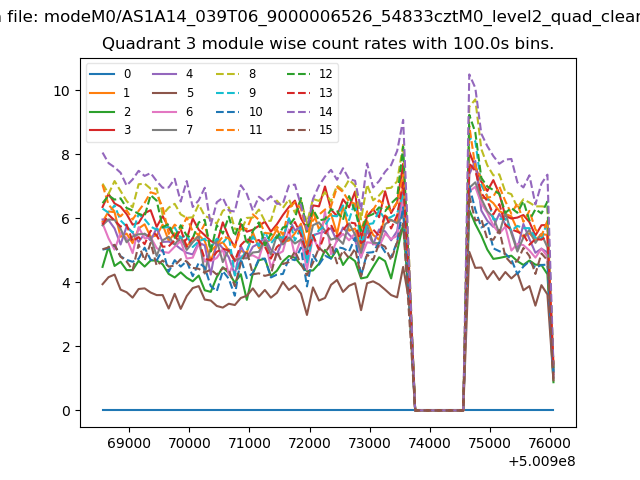 |
 |
| Parameter | Plot |
|---|---|
| CZT HV Monitor | 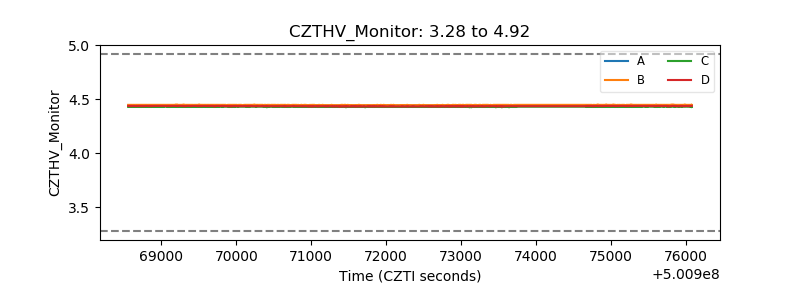 |
| D_VDD | 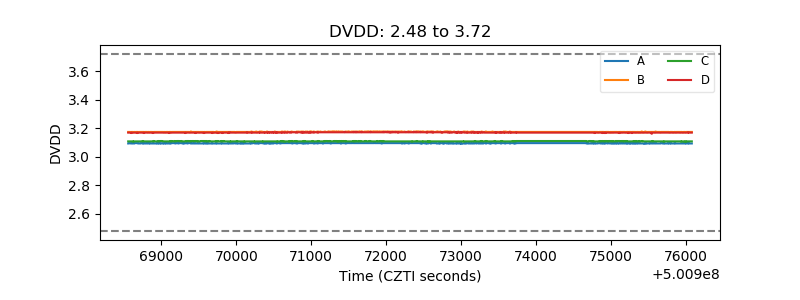 |
| Temperature 1 | 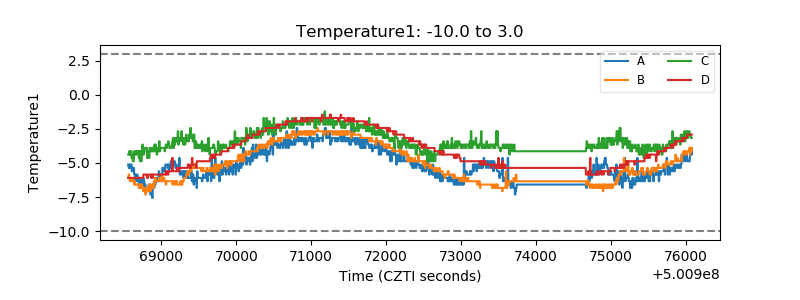 |
| Veto HV Monitor | 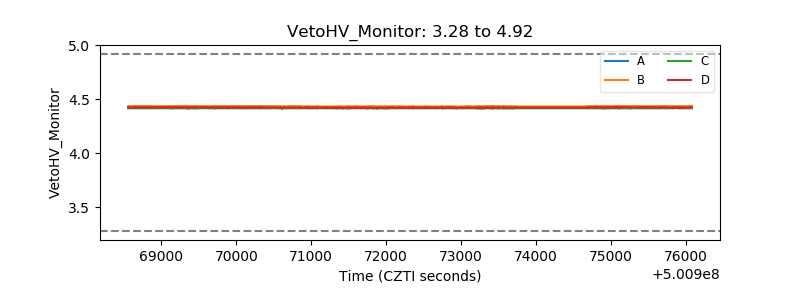 |
| Veto LLD |  |
| Alpha Counter | 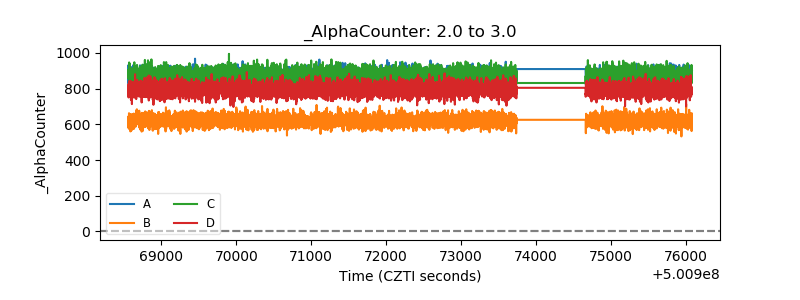 |
| _CPM_Rate | 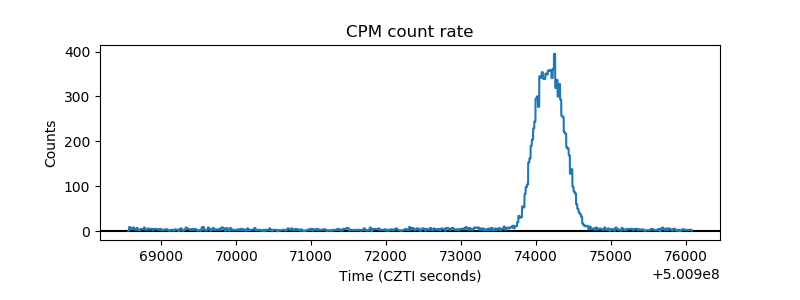 |
| CZT Counter | 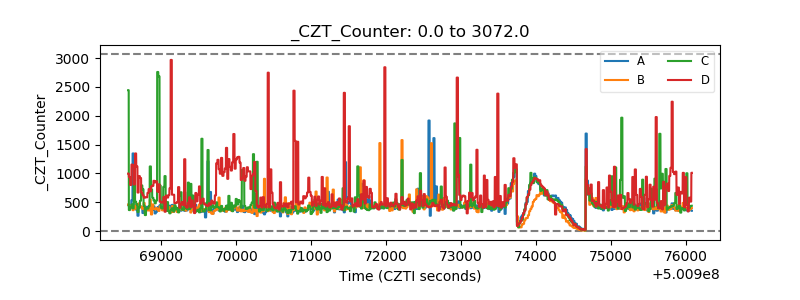 |
| +2.5 Volts monitor |  |
| +5 Volts monitor |  |
| _ROLL_ROT | 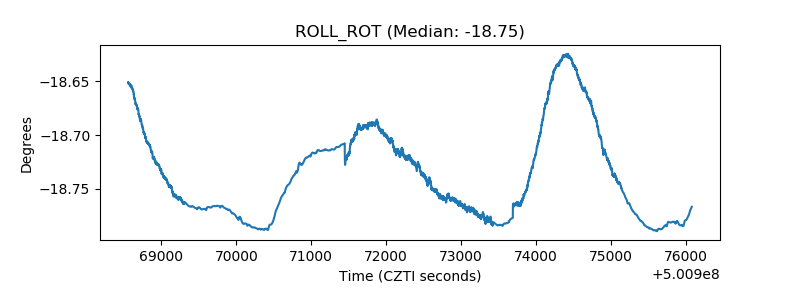 |
| _Roll_DEC | 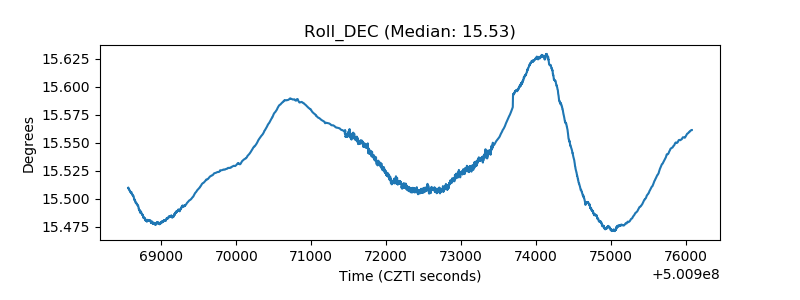 |
| _Roll_RA | 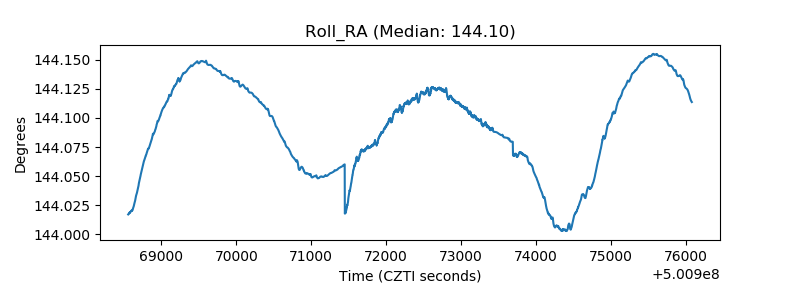 |
| Veto Counter | 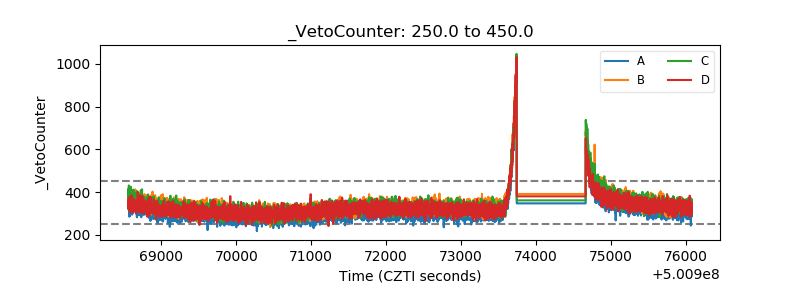 |