| Param | Original file | Final file |
|---|---|---|
| Filename | modeM0/AS1A14_039T06_9000006526_54834cztM0_level2.fits | modeM0/AS1A14_039T06_9000006526_54834cztM0_level2_quad_clean.evt |
| Size (bytes) | 382,124,160 | 87,949,440 |
| Size | 364.4 MB | 83.9 MB |
| Events in quadrant A | 2,715,548 | 580,251 |
| Events in quadrant B | 2,682,025 | 623,225 |
| Events in quadrant C | 3,066,941 | 552,777 |
| Events in quadrant D | 5,209,041 | 484,342 |
| Mode M9 | |||
|---|---|---|---|
| Quadrant | BADHDUFLAG | Total packets | Discarded packets |
| A | 0 | 11 | 0 |
| B | 0 | 11 | 0 |
| C | 0 | 11 | 0 |
| D | 0 | 11 | 0 |
| Mode M0 | |||
|---|---|---|---|
| Quadrant | BADHDUFLAG | Total packets | Discarded packets |
| A | 0 | 12704 | 1 |
| B | 0 | 12629 | 1 |
| C | 0 | 13544 | 1 |
| D | 0 | 19576 | 1 |
| Mode SS | |||
|---|---|---|---|
| Quadrant | BADHDUFLAG | Total packets | Discarded packets |
| A | 0 | 122 | 0 |
| B | 0 | 122 | 0 |
| C | 0 | 122 | 0 |
| D | 0 | 122 | 0 |
| Quadrant | Total seconds | Saturated seconds | Saturation percentage |
|---|---|---|---|
| A | 6054 | 114 | 1.883053% |
| B | 6054 | 94 | 1.552692% |
| C | 6055 | 102 | 1.684558% |
| D | 6054 | 629 | 10.389825% |
Noise dominated data is calculated using 1-second bins in cleaned event files. If a bin has >2000 counts, and if more than 50% of those come from <1% of pixels, then it is considered to be noise-dominated and hence unusable.
| Quadrant | # 1 sec bins | Bins with >0 counts | Bins with >2000 counts | High rate bins dominated by noise | Noise dominated (total time) | Noise dominated (detector-on time) | Marked lightcurve |
|---|---|---|---|---|---|---|---|
| A | 7079 | 6055 | 38 | 38 | 0.54% | 0.63% | 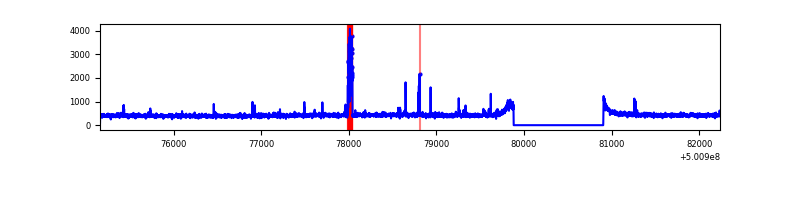 |
| B | 7079 | 6055 | 12 | 12 | 0.17% | 0.20% | 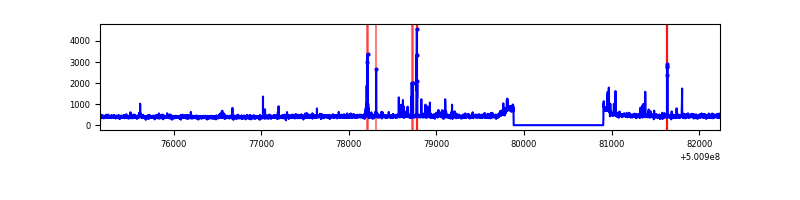 |
| C | 7080 | 6056 | 37 | 37 | 0.52% | 0.61% | 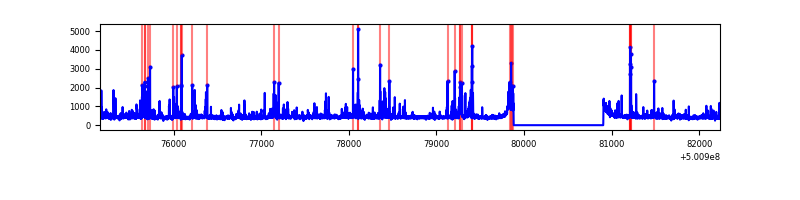 |
| D | 7079 | 6055 | 481 | 481 | 6.79% | 7.94% | 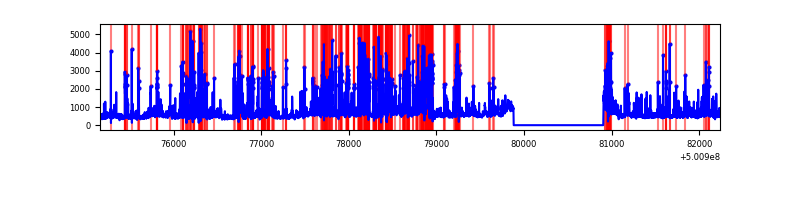 |
Top three noisy pixels from each quadrant. If the there are fewer than three noisy pixels in the level2.evt file, extra rows are filled as -1
| Pixel properties | Quadrant properties | ||||||
|---|---|---|---|---|---|---|---|
| Quadrant | DetID | PixID | Counts | Sigma | Mean | Median | Sigma |
| A | 5 | 241 | 127274 | 789.35 | 649 | 631 | 160.4 |
| A | 6 | 161 | 18969 | 114.3 | 649 | 631 | 160.4 |
| A | 13 | 248 | 18583 | 111.89 | 649 | 631 | 160.4 |
| B | 5 | 236 | 59488 | 427.36 | 635 | 610 | 137.8 |
| B | 10 | 247 | 53873 | 386.6 | 635 | 610 | 137.8 |
| B | 5 | 185 | 25471 | 180.45 | 635 | 610 | 137.8 |
| C | 13 | 3 | 275052 | 1590.35 | 625 | 620 | 172.6 |
| C | 12 | 252 | 118490 | 683.06 | 625 | 620 | 172.6 |
| C | 6 | 223 | 94434 | 543.65 | 625 | 620 | 172.6 |
| D | 11 | 176 | 1790155 | 10442.79 | 600 | 573 | 171.4 |
| D | 5 | 38 | 222246 | 1293.53 | 600 | 573 | 171.4 |
| D | 6 | 42 | 185444 | 1078.78 | 600 | 573 | 171.4 |
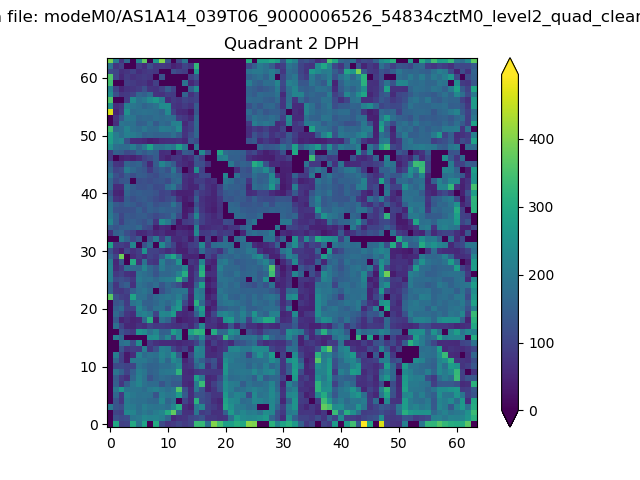
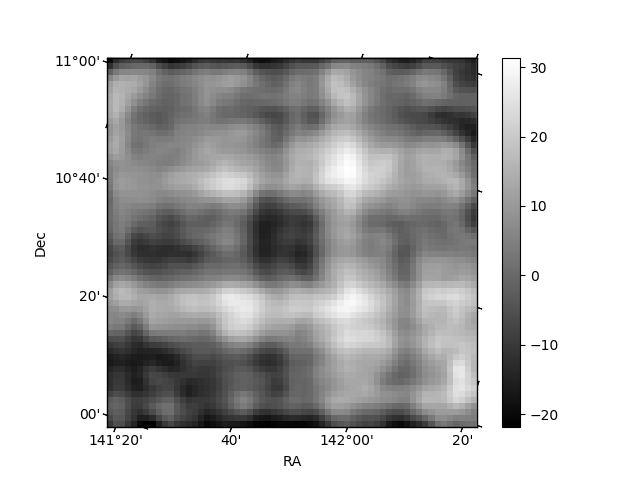
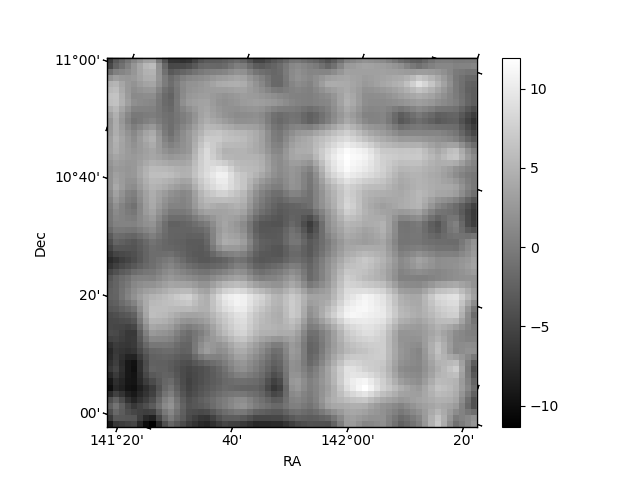
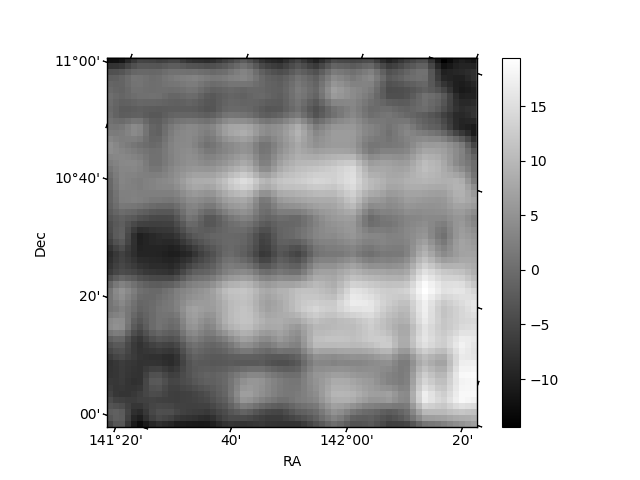
Histogram calculated using DETX and DETY for each event in the final _common_clean file
| Quadrant A | 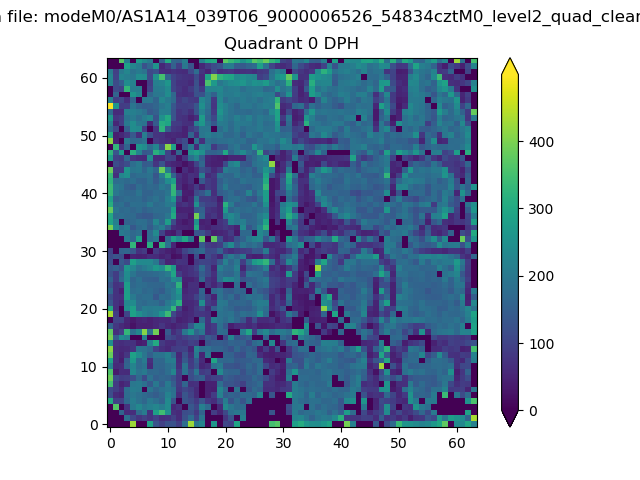 |
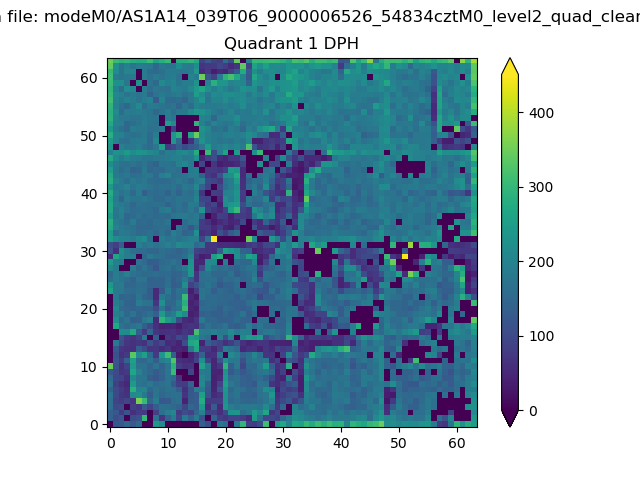 |
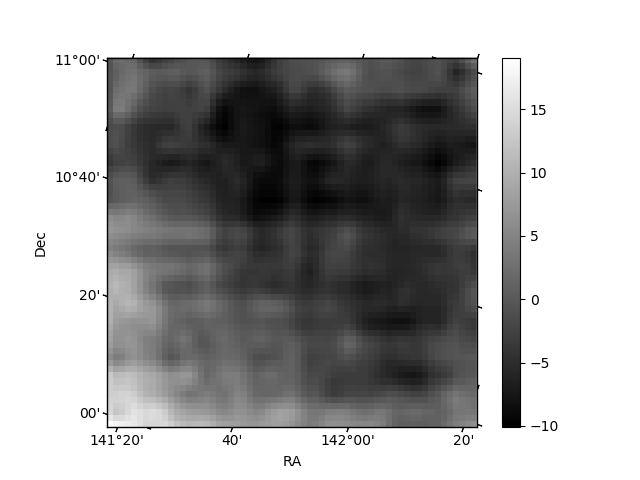
Quadrant B |
|---|---|---|---|
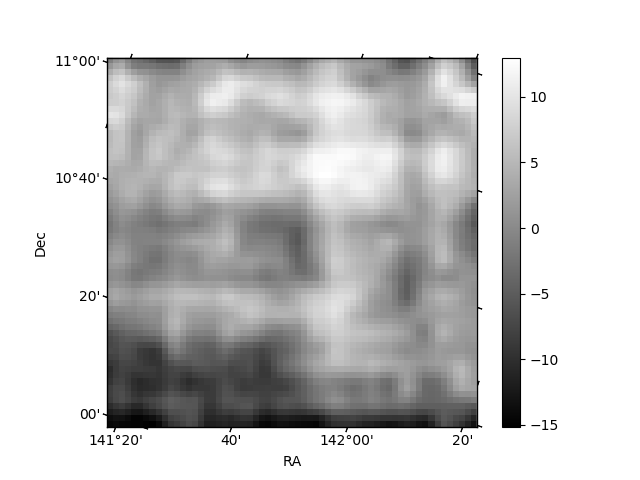
| Quadrant D | 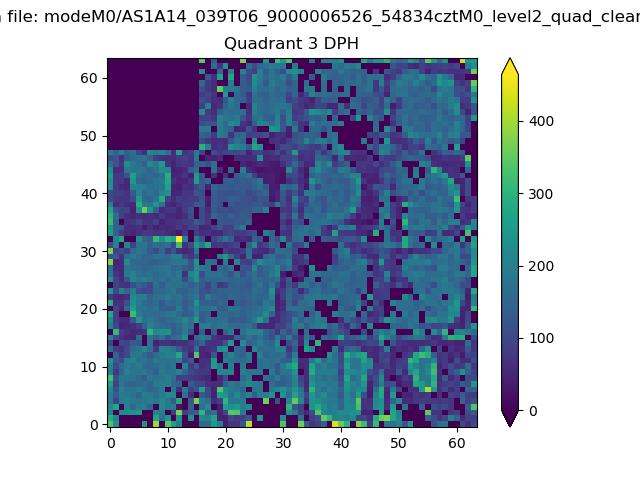 |
 |
Quadrant C |
| Plot type | Count rate plots | Images |
|---|---|---|
| Comparison with Poisson distribution Blue bars denote a histogram of data divided into 1 sec bins. Red curve is a Poisson curve with rate = median count rate of data. |
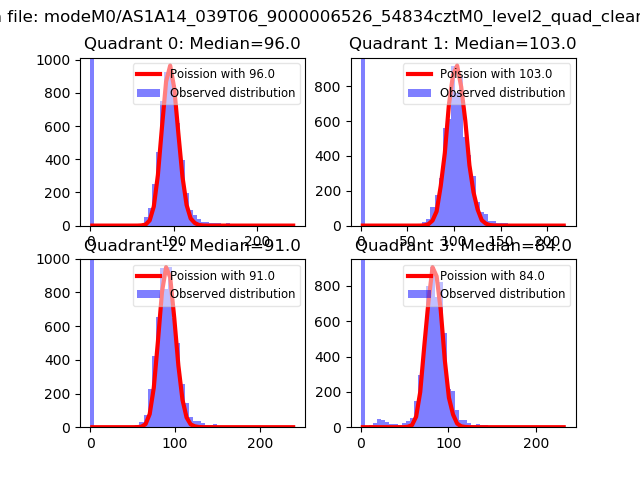 |
 |
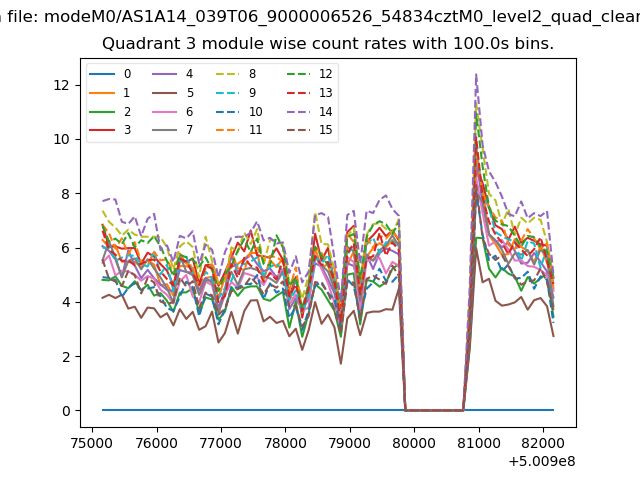
| Quadrant-wise count rates Data is divided into 100 sec bins |
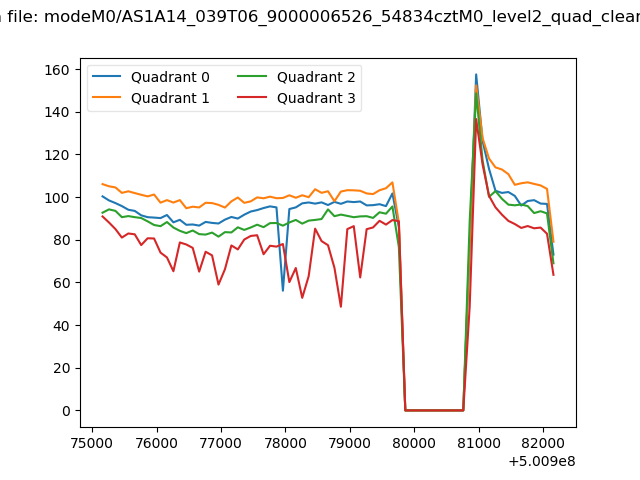 |
|
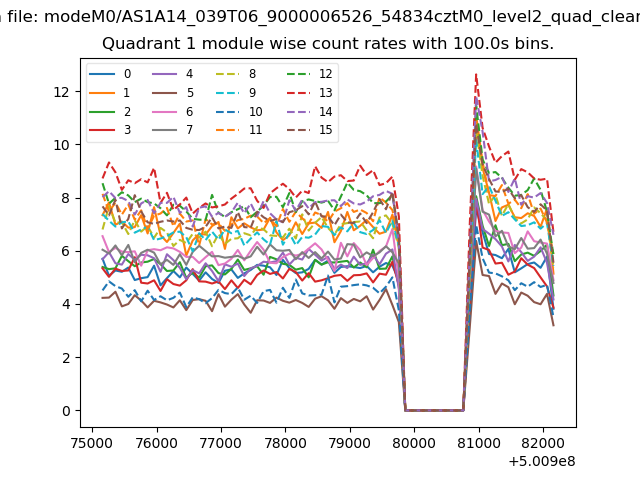
| Module-wise count rates for Quadrant A Data is divided into 100 sec bins |
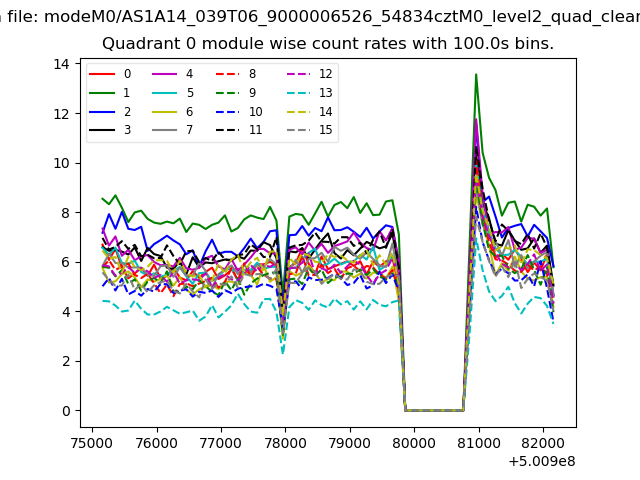 |
 |
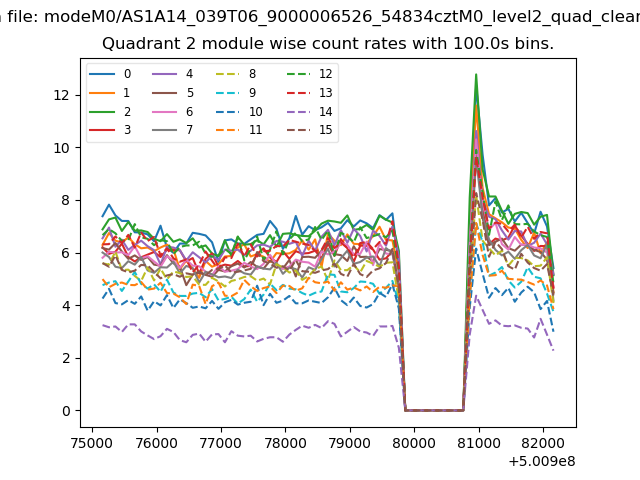
| Module-wise count rates for Quadrant B Data is divided into 100 sec bins |
 |
 |
| Module-wise count rates for Quadrant C Data is divided into 100 sec bins |
 |
 |
| Module-wise count rates for Quadrant D Data is divided into 100 sec bins |
 |
 |
| Parameter | Plot |
|---|---|
| CZT HV Monitor | 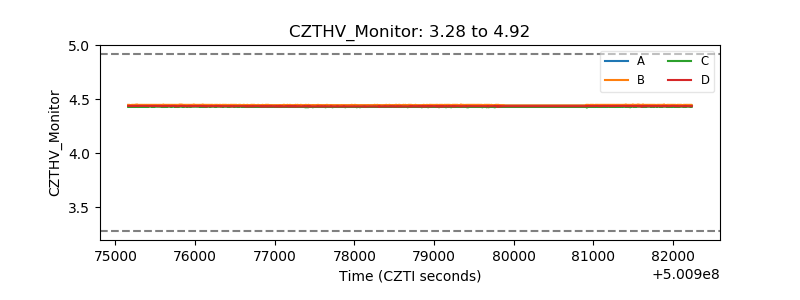 |
| D_VDD | 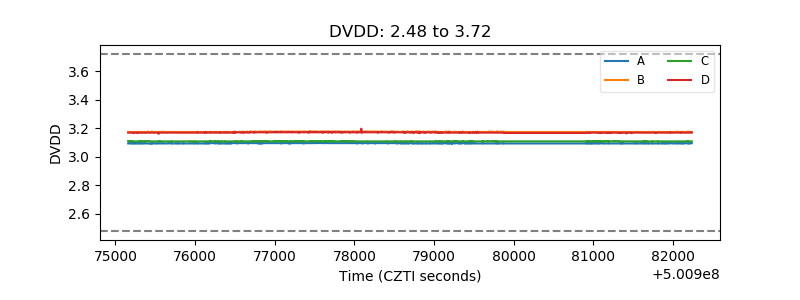 |
| Temperature 1 | 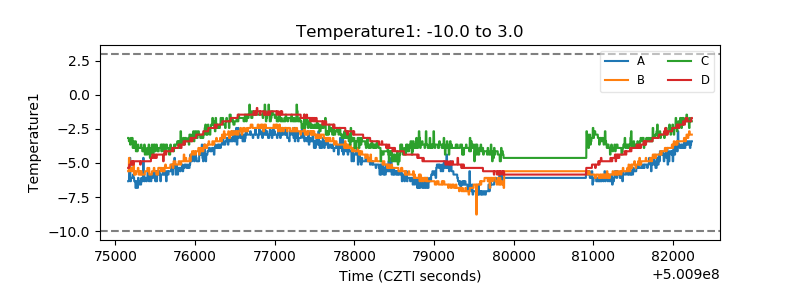 |
| Veto HV Monitor | 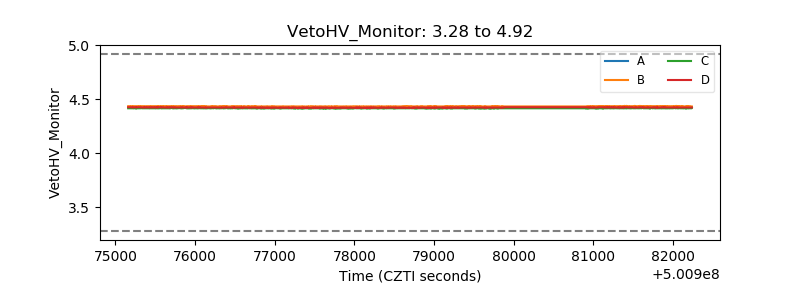 |
| Veto LLD | 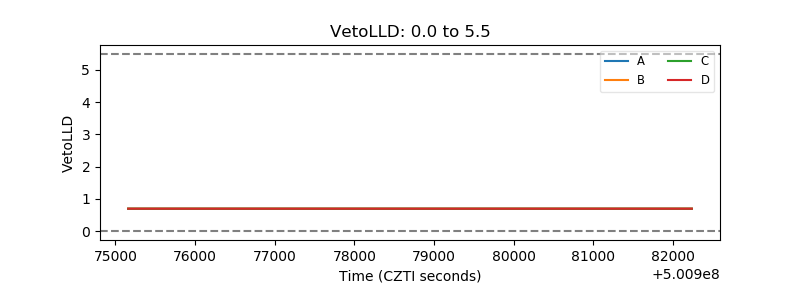 |
| Alpha Counter | 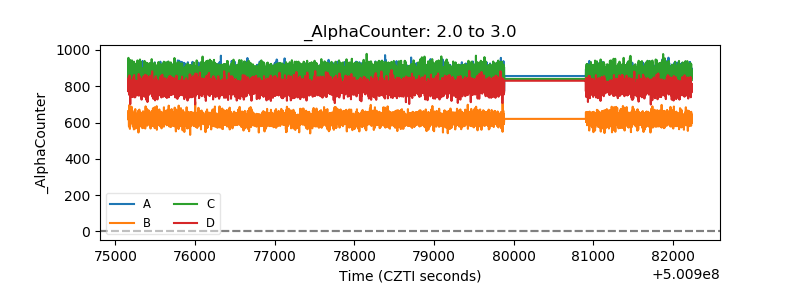 |
| _CPM_Rate | 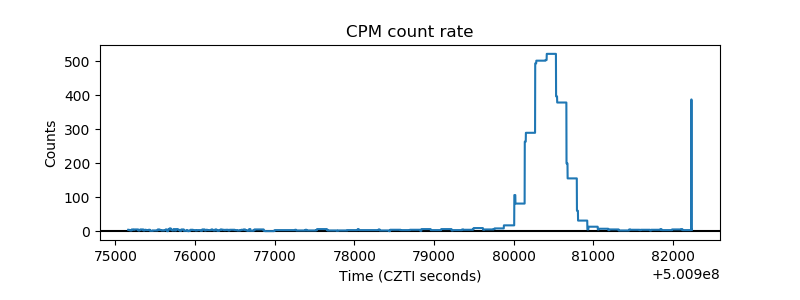 |
| CZT Counter | 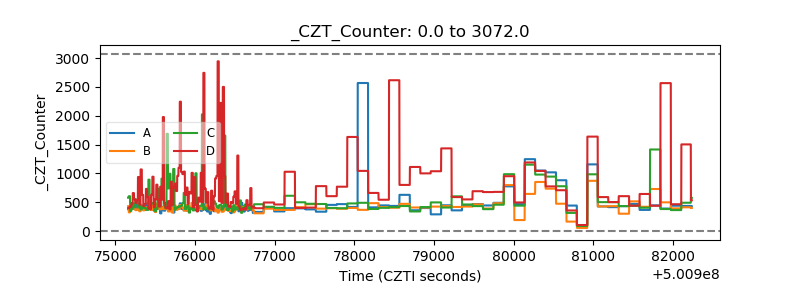 |
| +2.5 Volts monitor |  |
| +5 Volts monitor | 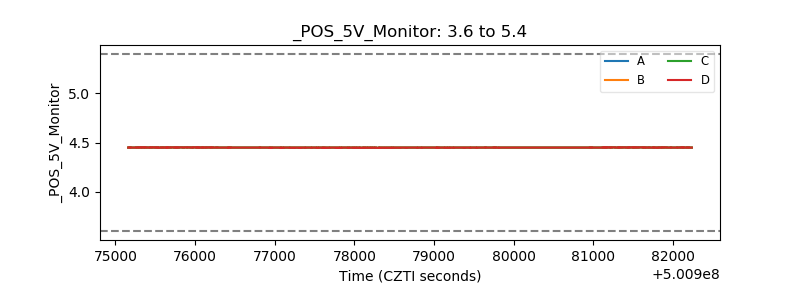 |
| _ROLL_ROT | 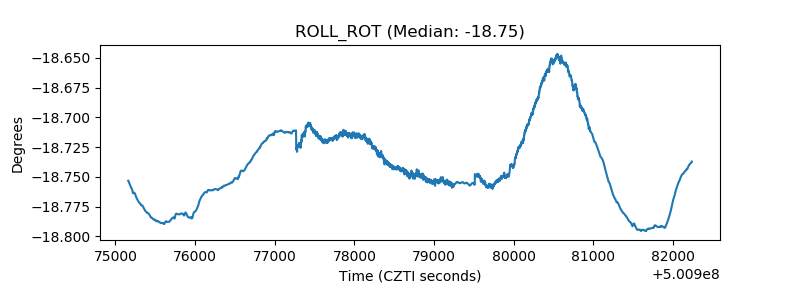 |
| _Roll_DEC | 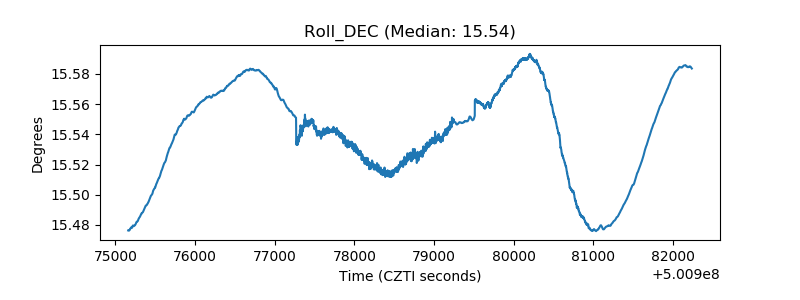 |
| _Roll_RA | 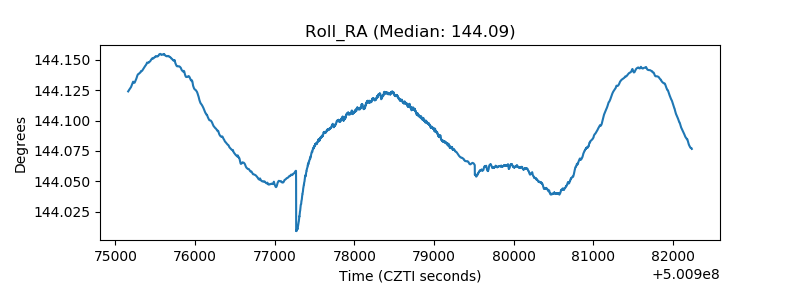 |
| Veto Counter | 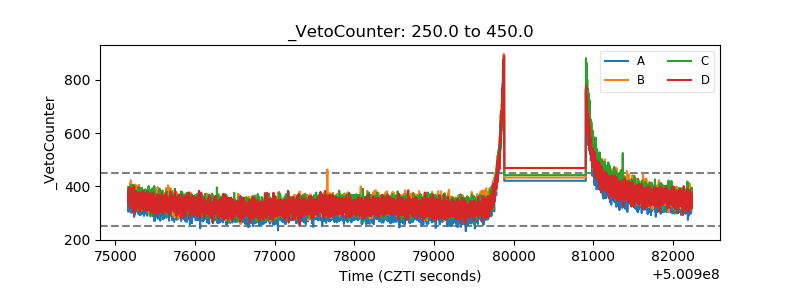 |