| Param | Original file | Final file |
|---|---|---|
| Filename | modeM0/AS1A14_039T06_9000006526_54837cztM0_level2.fits | modeM0/AS1A14_039T06_9000006526_54837cztM0_level2_quad_clean.evt |
| Size (bytes) | 496,897,920 | 96,500,160 |
| Size | 473.9 MB | 92.0 MB |
| Events in quadrant A | 3,146,193 | 649,447 |
| Events in quadrant B | 3,412,369 | 697,648 |
| Events in quadrant C | 3,914,782 | 600,264 |
| Events in quadrant D | 7,392,431 | 501,592 |
| Mode M9 | |||
|---|---|---|---|
| Quadrant | BADHDUFLAG | Total packets | Discarded packets |
| A | 0 | 13 | 0 |
| B | 0 | 13 | 0 |
| C | 0 | 14 | 0 |
| D | 0 | 14 | 0 |
| Mode M0 | |||
|---|---|---|---|
| Quadrant | BADHDUFLAG | Total packets | Discarded packets |
| A | 0 | 14306 | 2 |
| B | 0 | 15060 | 2 |
| C | 0 | 16548 | 2 |
| D | 0 | 26611 | 2 |
| Mode SS | |||
|---|---|---|---|
| Quadrant | BADHDUFLAG | Total packets | Discarded packets |
| A | 0 | 138 | 0 |
| B | 0 | 138 | 0 |
| C | 0 | 138 | 0 |
| D | 0 | 138 | 0 |
| Quadrant | Total seconds | Saturated seconds | Saturation percentage |
|---|---|---|---|
| A | 6786 | 157 | 2.313587% |
| B | 6786 | 169 | 2.490421% |
| C | 6786 | 328 | 4.833481% |
| D | 6786 | 1210 | 17.830828% |
Noise dominated data is calculated using 1-second bins in cleaned event files. If a bin has >2000 counts, and if more than 50% of those come from <1% of pixels, then it is considered to be noise-dominated and hence unusable.
| Quadrant | # 1 sec bins | Bins with >0 counts | Bins with >2000 counts | High rate bins dominated by noise | Noise dominated (total time) | Noise dominated (detector-on time) | Marked lightcurve |
|---|---|---|---|---|---|---|---|
| A | 7831 | 6788 | 17 | 17 | 0.22% | 0.25% | 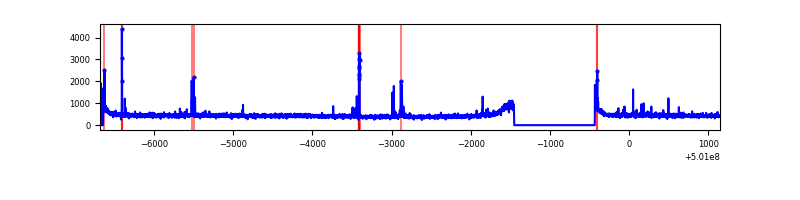 |
| B | 7831 | 6788 | 23 | 23 | 0.29% | 0.34% | 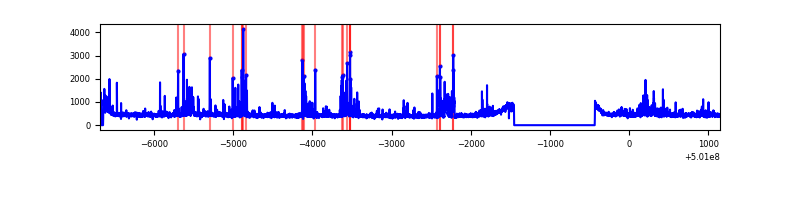 |
| C | 7831 | 6787 | 171 | 171 | 2.18% | 2.52% | 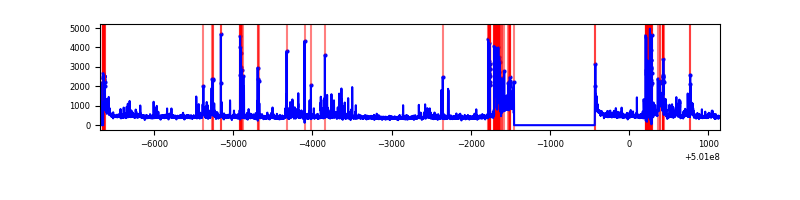 |
| D | 7831 | 6788 | 1067 | 1067 | 13.63% | 15.72% | 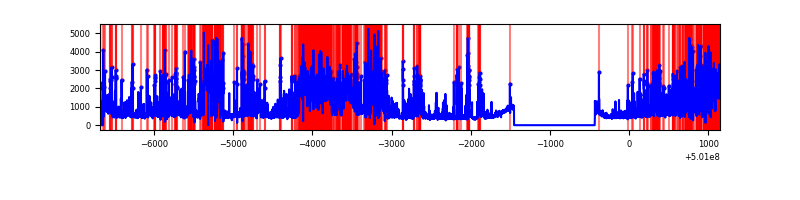 |
Top three noisy pixels from each quadrant. If the there are fewer than three noisy pixels in the level2.evt file, extra rows are filled as -1
| Pixel properties | Quadrant properties | ||||||
|---|---|---|---|---|---|---|---|
| Quadrant | DetID | PixID | Counts | Sigma | Mean | Median | Sigma |
| A | 13 | 248 | 78896 | 417.99 | 756 | 734 | 187.0 |
| A | 4 | 3 | 38002 | 199.3 | 756 | 734 | 187.0 |
| A | 3 | 14 | 21795 | 112.63 | 756 | 734 | 187.0 |
| B | 5 | 185 | 198691 | 1241.31 | 739 | 711 | 159.5 |
| B | 5 | 236 | 127109 | 792.5 | 739 | 711 | 159.5 |
| B | 10 | 247 | 126754 | 790.27 | 739 | 711 | 159.5 |
| C | 12 | 252 | 506184 | 2573.13 | 718 | 713 | 196.4 |
| C | 12 | 2 | 197854 | 1003.56 | 718 | 713 | 196.4 |
| C | 14 | 254 | 145745 | 738.29 | 718 | 713 | 196.4 |
| D | 11 | 176 | 1849939 | 9578.42 | 685 | 655 | 193.1 |
| D | 2 | 172 | 670411 | 3469.02 | 685 | 655 | 193.1 |
| D | 11 | 129 | 665629 | 3444.25 | 685 | 655 | 193.1 |
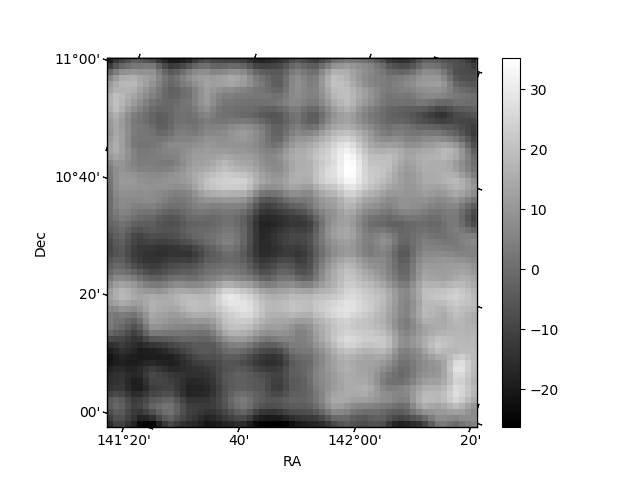
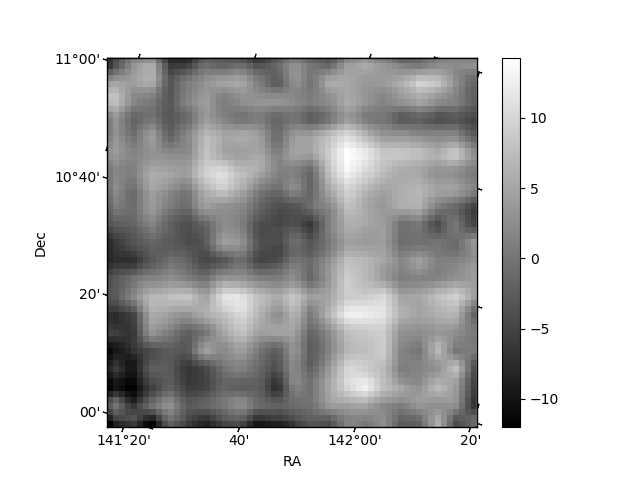
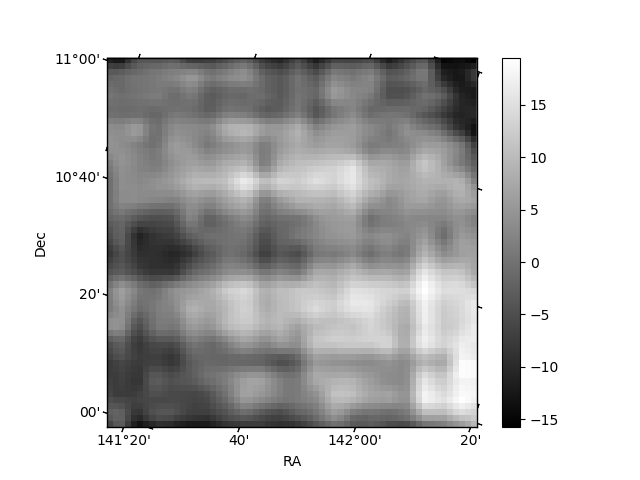
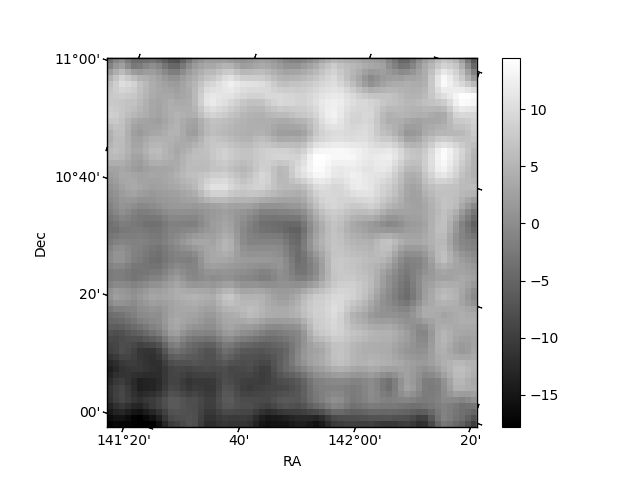
Histogram calculated using DETX and DETY for each event in the final _common_clean file
| Quadrant A | 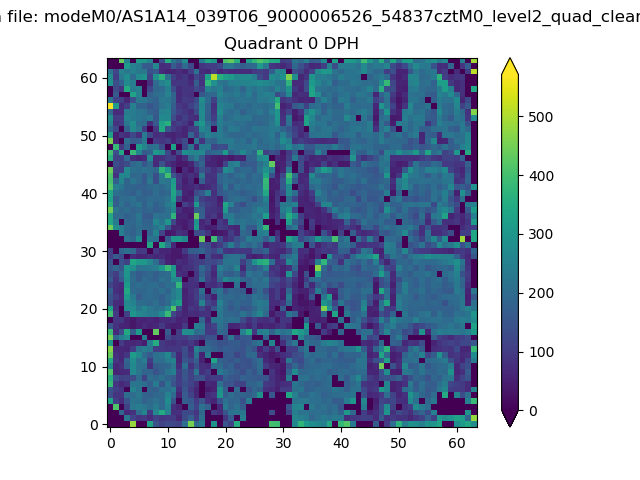 |
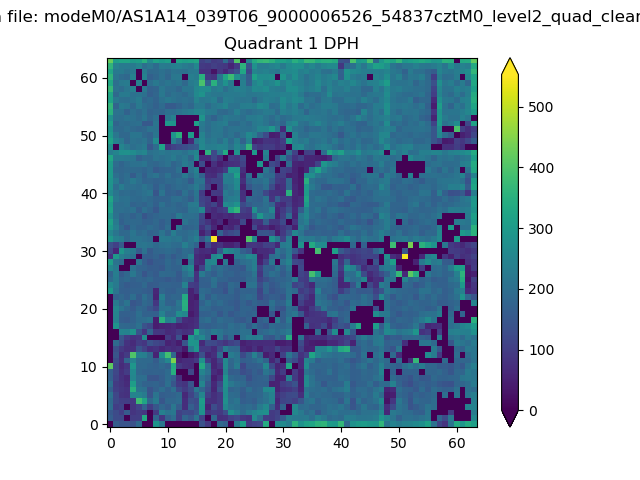 |
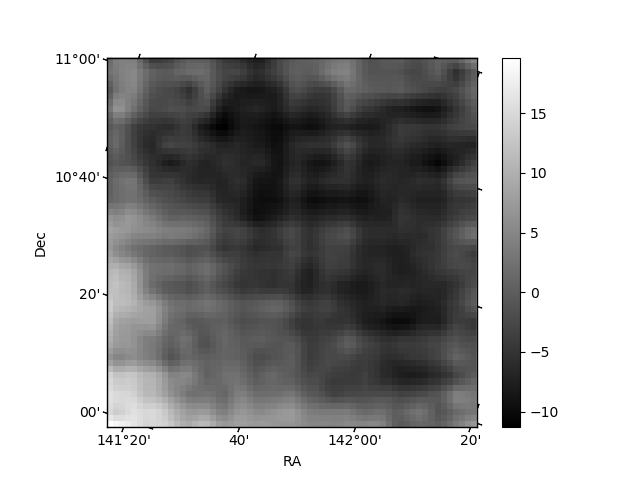
Quadrant B |
|---|---|---|---|
| Quadrant D | 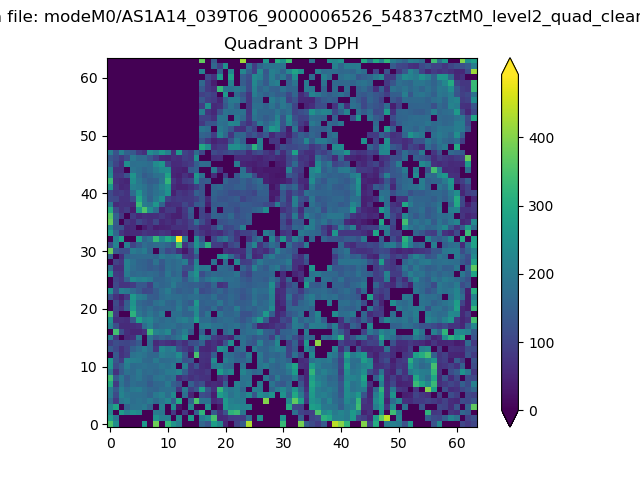 |
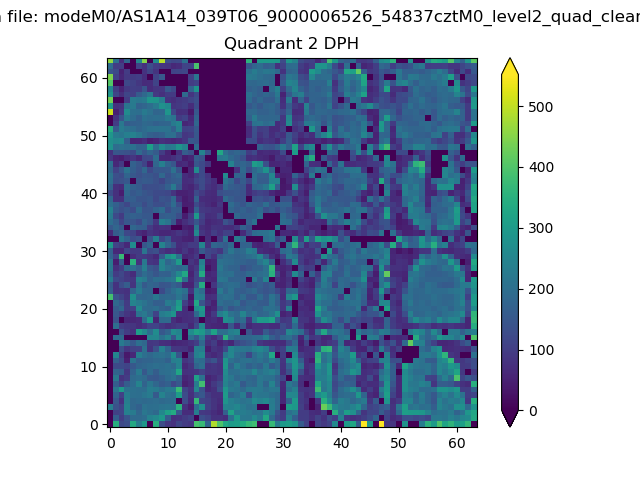 |
Quadrant C |
| Plot type | Count rate plots | Images |
|---|---|---|
| Comparison with Poisson distribution Blue bars denote a histogram of data divided into 1 sec bins. Red curve is a Poisson curve with rate = median count rate of data. |
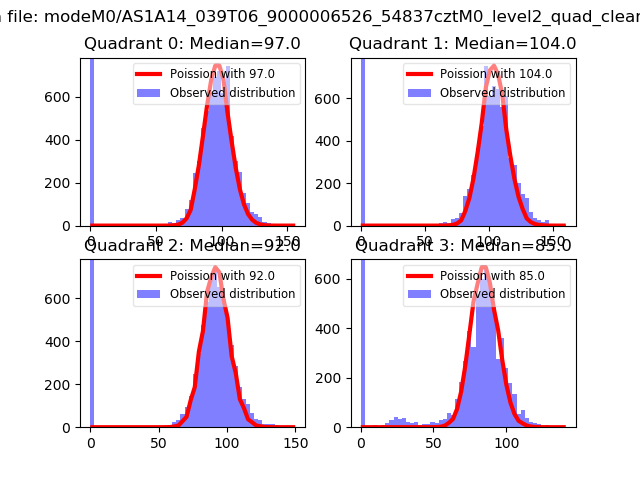 |
 |
| Quadrant-wise count rates Data is divided into 100 sec bins |
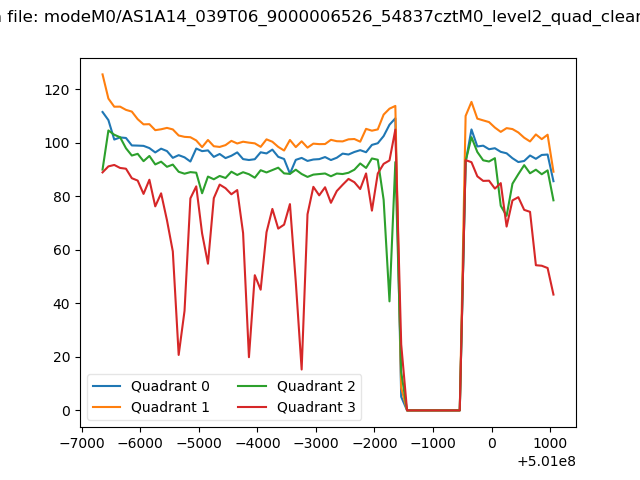 |
|
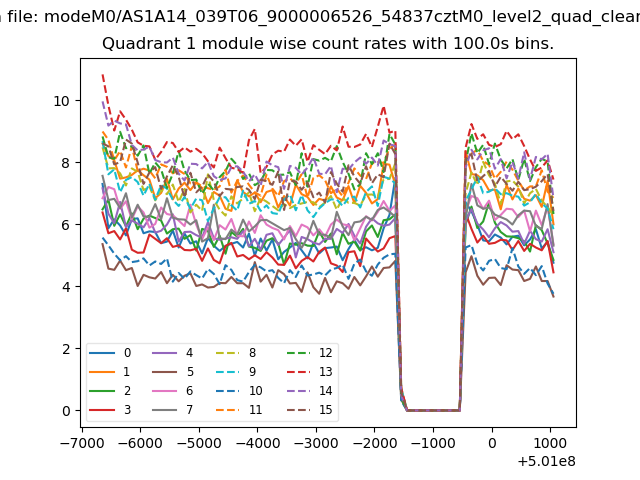
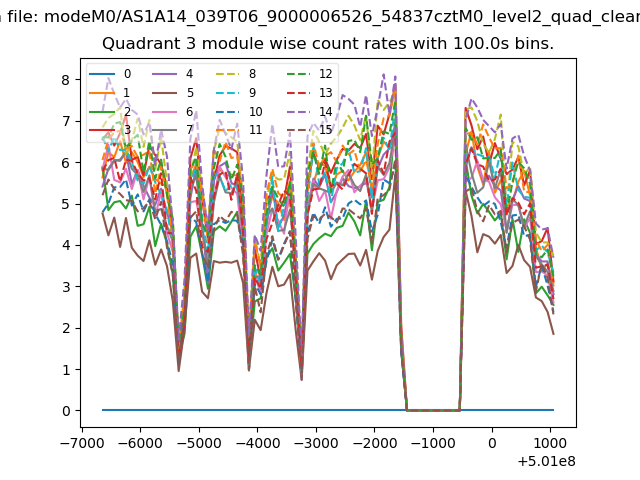
| Module-wise count rates for Quadrant A Data is divided into 100 sec bins |
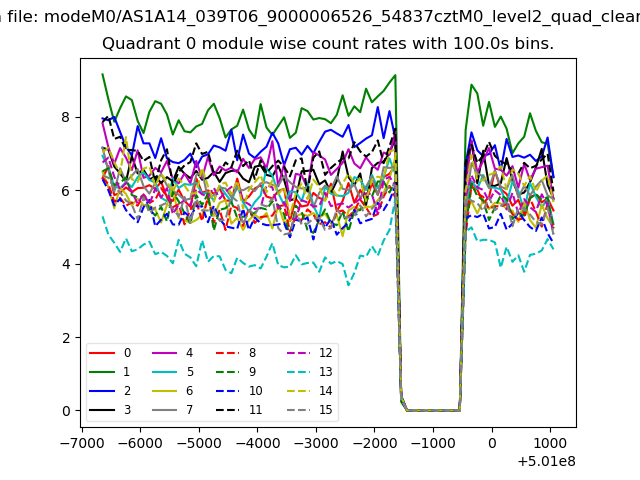 |
 |
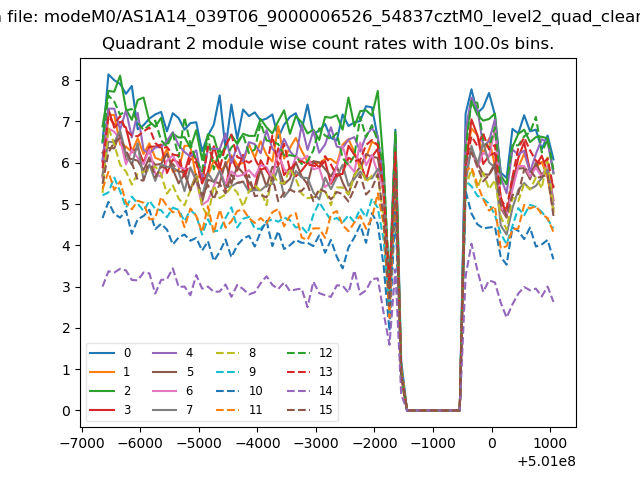
| Module-wise count rates for Quadrant B Data is divided into 100 sec bins |
 |
 |
| Module-wise count rates for Quadrant C Data is divided into 100 sec bins |
 |
 |
| Module-wise count rates for Quadrant D Data is divided into 100 sec bins |
 |
 |
| Parameter | Plot |
|---|---|
| CZT HV Monitor | 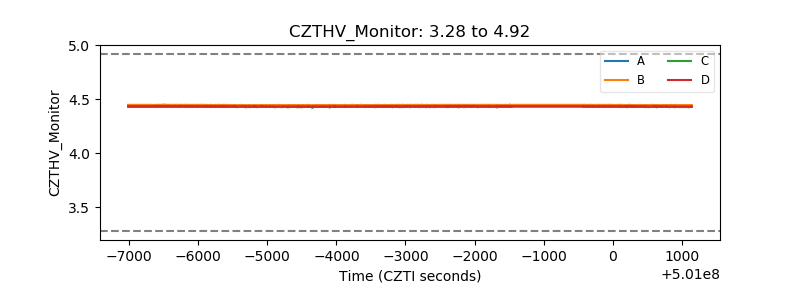 |
| D_VDD | 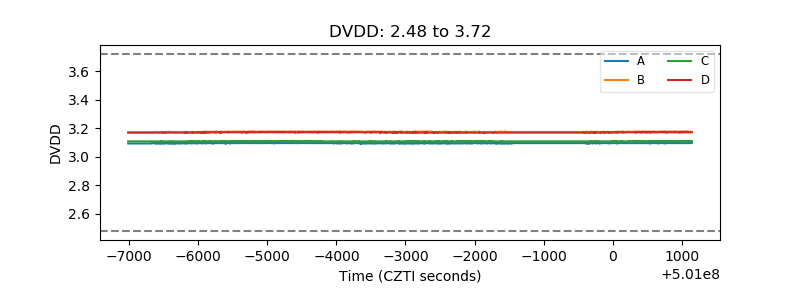 |
| Temperature 1 | 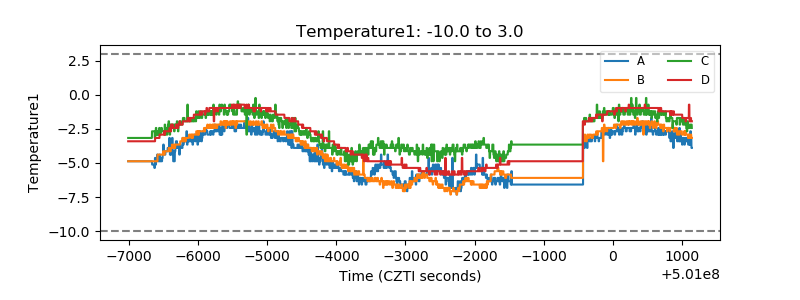 |
| Veto HV Monitor | 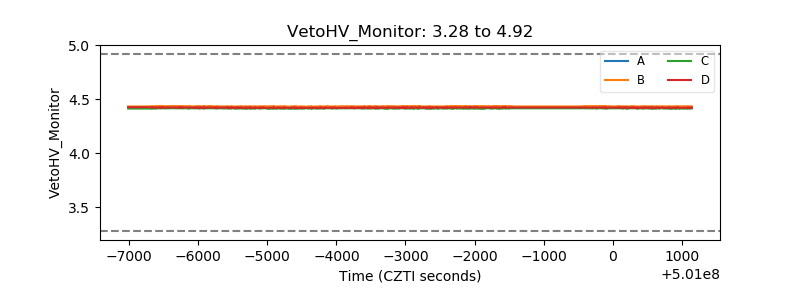 |
| Veto LLD | 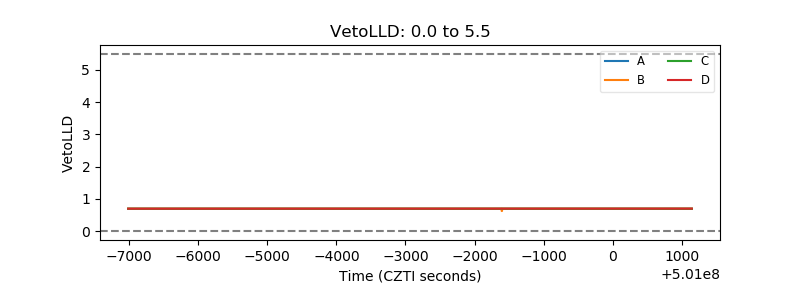 |
| Alpha Counter | 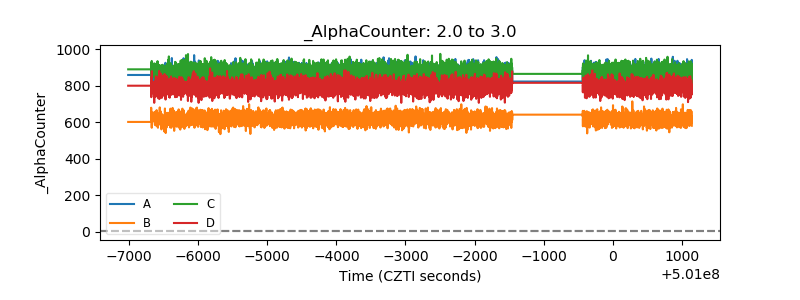 |
| _CPM_Rate | 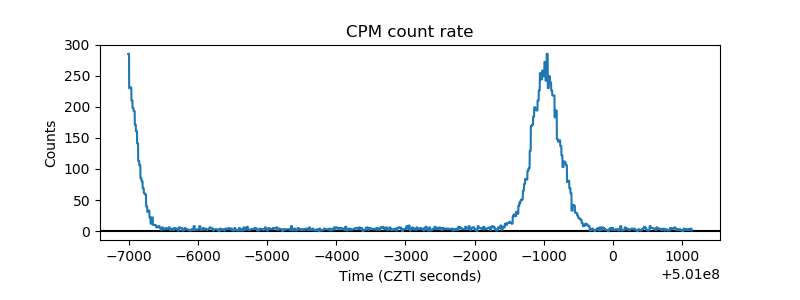 |
| CZT Counter |  |
| +2.5 Volts monitor | 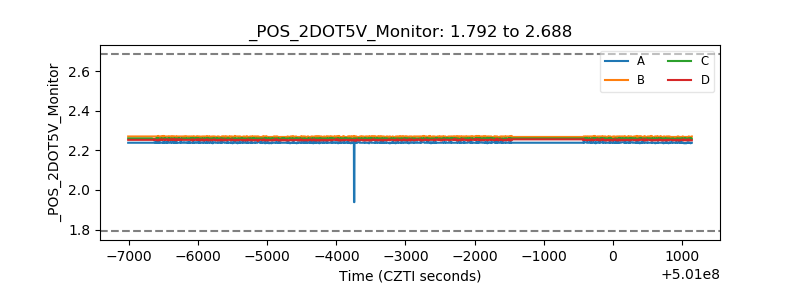 |
| +5 Volts monitor | 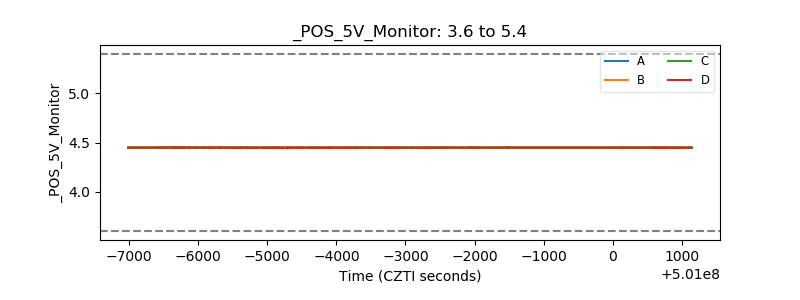 |
| _ROLL_ROT | 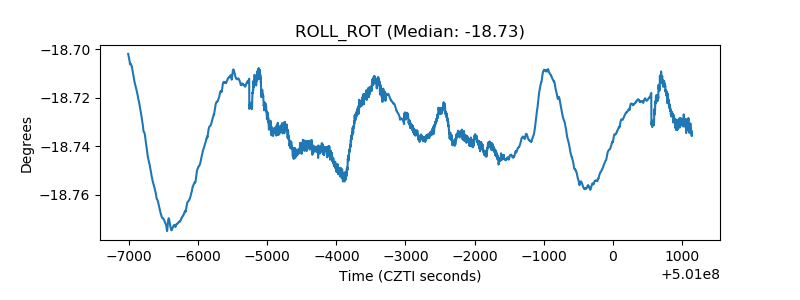 |
| _Roll_DEC | 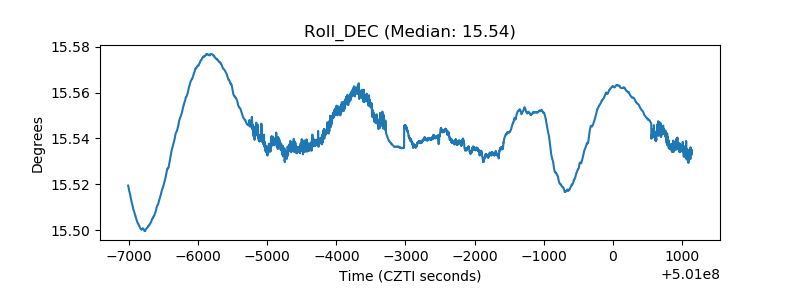 |
| _Roll_RA | 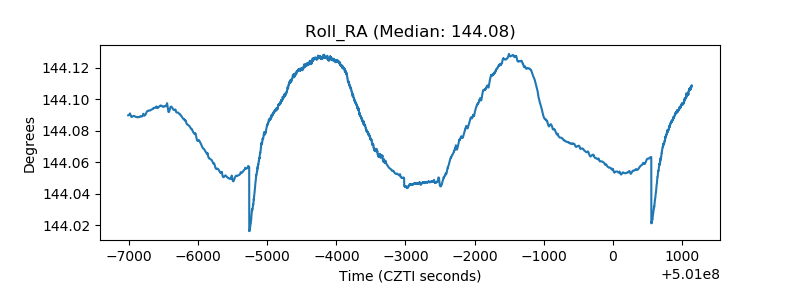 |
| Veto Counter | 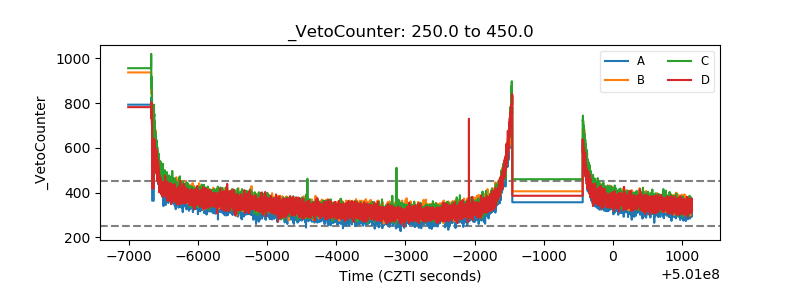 |