| Param | Original file | Final file |
|---|---|---|
| Filename | modeM0/AS1A14_039T06_9000006526_54838cztM0_level2.fits | modeM0/AS1A14_039T06_9000006526_54838cztM0_level2_quad_clean.evt |
| Size (bytes) | 494,222,400 | 96,347,520 |
| Size | 471.3 MB | 91.9 MB |
| Events in quadrant A | 3,373,205 | 639,719 |
| Events in quadrant B | 3,417,680 | 687,092 |
| Events in quadrant C | 3,759,726 | 604,617 |
| Events in quadrant D | 7,213,198 | 509,769 |
| Mode M9 | |||
|---|---|---|---|
| Quadrant | BADHDUFLAG | Total packets | Discarded packets |
| A | 0 | 10 | 0 |
| B | 0 | 11 | 0 |
| C | 0 | 11 | 0 |
| D | 0 | 11 | 0 |
| Mode M0 | |||
|---|---|---|---|
| Quadrant | BADHDUFLAG | Total packets | Discarded packets |
| A | 0 | 15215 | 2 |
| B | 0 | 15191 | 3 |
| C | 0 | 16220 | 2 |
| D | 0 | 26155 | 2 |
| Mode SS | |||
|---|---|---|---|
| Quadrant | BADHDUFLAG | Total packets | Discarded packets |
| A | 0 | 140 | 0 |
| B | 0 | 140 | 0 |
| C | 0 | 140 | 0 |
| D | 0 | 140 | 0 |
| Quadrant | Total seconds | Saturated seconds | Saturation percentage |
|---|---|---|---|
| A | 6828 | 194 | 2.841242% |
| B | 6827 | 154 | 2.255749% |
| C | 6827 | 225 | 3.295738% |
| D | 6827 | 1081 | 15.834188% |
Noise dominated data is calculated using 1-second bins in cleaned event files. If a bin has >2000 counts, and if more than 50% of those come from <1% of pixels, then it is considered to be noise-dominated and hence unusable.
| Quadrant | # 1 sec bins | Bins with >0 counts | Bins with >2000 counts | High rate bins dominated by noise | Noise dominated (total time) | Noise dominated (detector-on time) | Marked lightcurve |
|---|---|---|---|---|---|---|---|
| A | 7698 | 6829 | 66 | 66 | 0.86% | 0.97% | 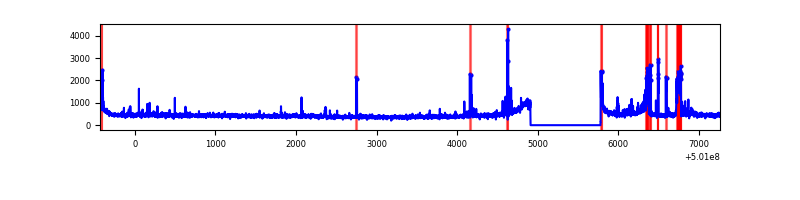 |
| B | 7697 | 6828 | 27 | 27 | 0.35% | 0.40% | 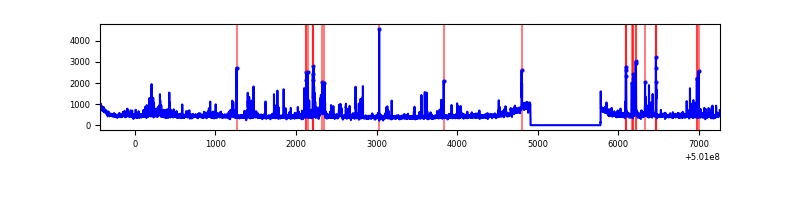 |
| C | 7697 | 6828 | 109 | 109 | 1.42% | 1.60% | 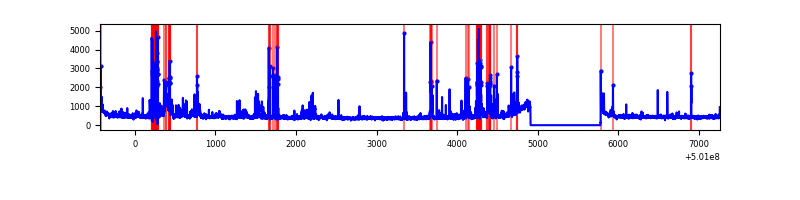 |
| D | 7697 | 6828 | 881 | 881 | 11.45% | 12.90% | 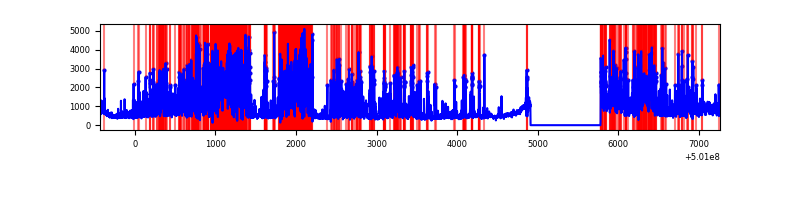 |
Top three noisy pixels from each quadrant. If the there are fewer than three noisy pixels in the level2.evt file, extra rows are filled as -1
| Pixel properties | Quadrant properties | ||||||
|---|---|---|---|---|---|---|---|
| Quadrant | DetID | PixID | Counts | Sigma | Mean | Median | Sigma |
| A | 12 | 17 | 233495 | 1260.73 | 748 | 728 | 184.6 |
| A | 8 | 206 | 46821 | 249.65 | 748 | 728 | 184.6 |
| A | 12 | 194 | 34672 | 183.85 | 748 | 728 | 184.6 |
| B | 5 | 185 | 164483 | 1028.49 | 735 | 709 | 159.2 |
| B | 5 | 236 | 113730 | 709.77 | 735 | 709 | 159.2 |
| B | 10 | 247 | 65285 | 405.53 | 735 | 709 | 159.2 |
| C | 12 | 252 | 261059 | 1314.51 | 726 | 720 | 198.0 |
| C | 13 | 3 | 244523 | 1231.02 | 726 | 720 | 198.0 |
| C | 12 | 2 | 181081 | 910.69 | 726 | 720 | 198.0 |
| D | 11 | 176 | 2052919 | 10563.97 | 686 | 656 | 194.3 |
| D | 3 | 12 | 1179846 | 6069.85 | 686 | 656 | 194.3 |
| D | 15 | 94 | 222837 | 1143.67 | 686 | 656 | 194.3 |
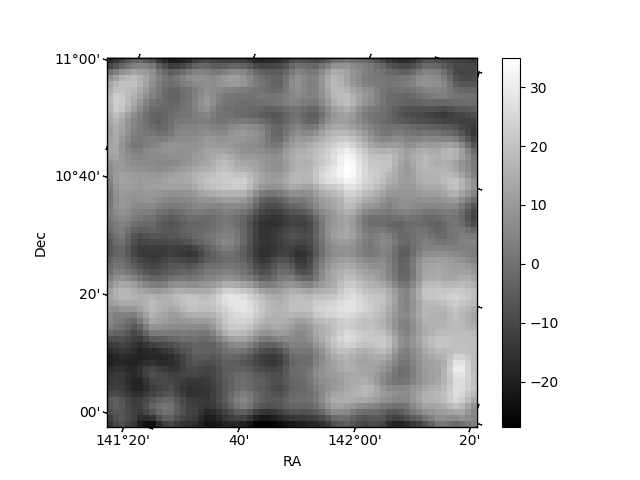
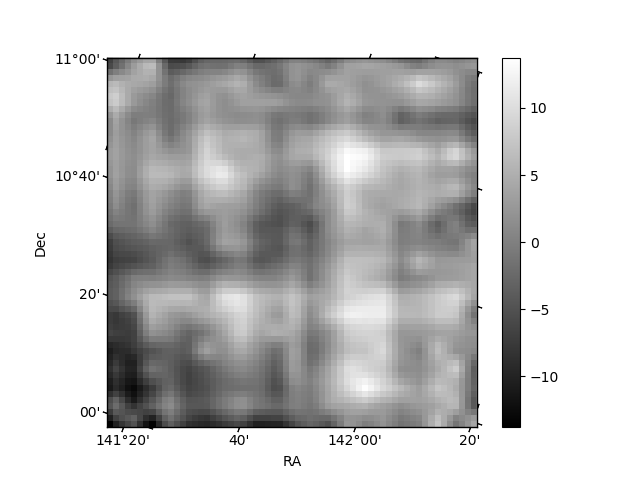
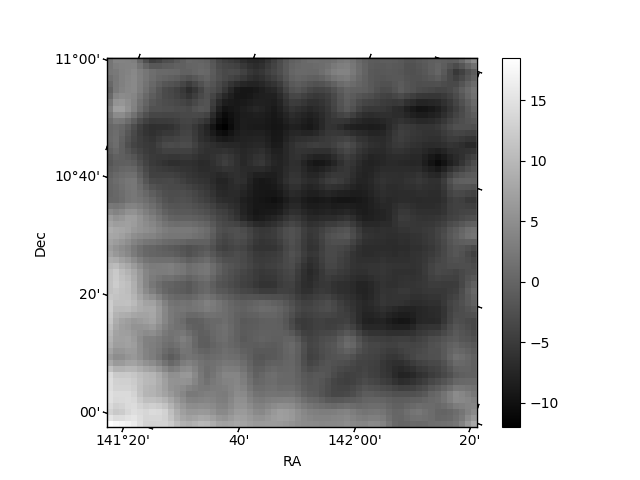
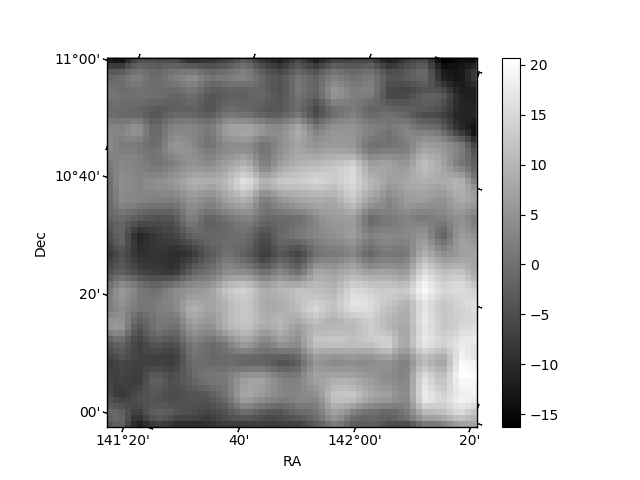
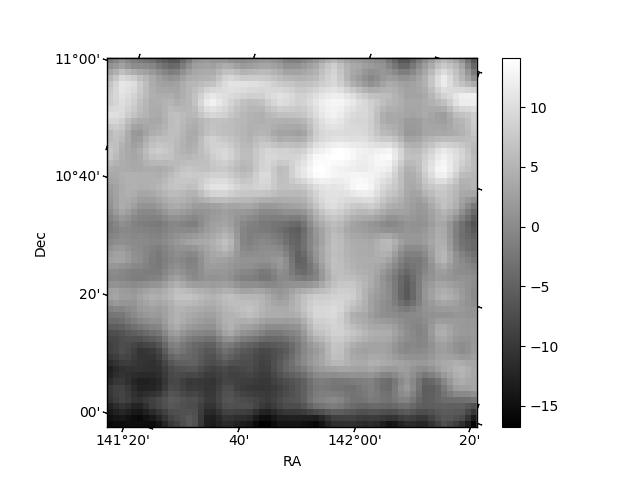
Histogram calculated using DETX and DETY for each event in the final _common_clean file
| Quadrant A | 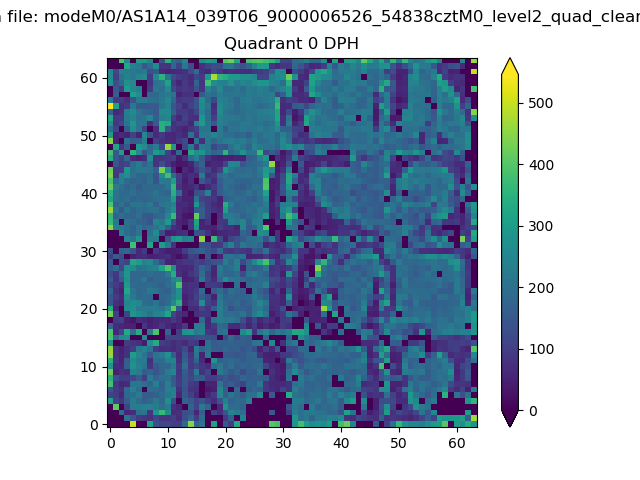 |
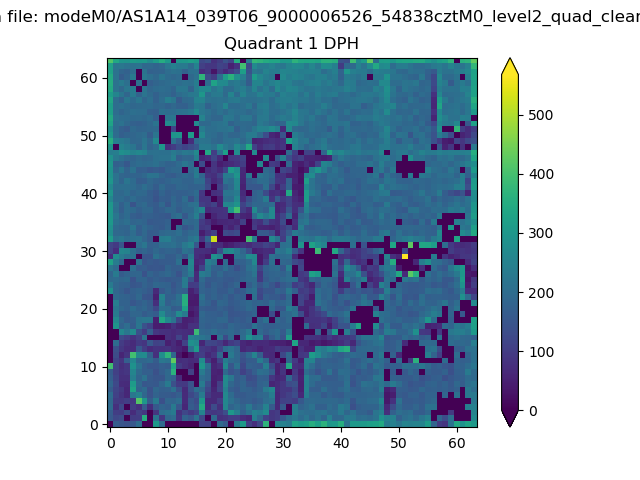 |
Quadrant B |
|---|---|---|---|
| Quadrant D | 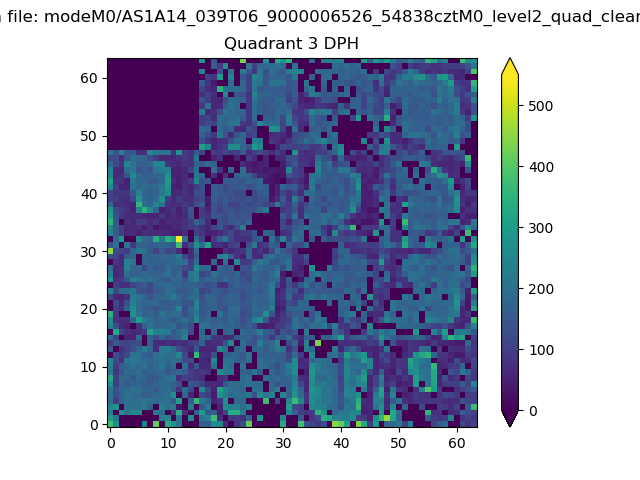 |
 |
Quadrant C |
| Plot type | Count rate plots | Images |
|---|---|---|
| Comparison with Poisson distribution Blue bars denote a histogram of data divided into 1 sec bins. Red curve is a Poisson curve with rate = median count rate of data. |
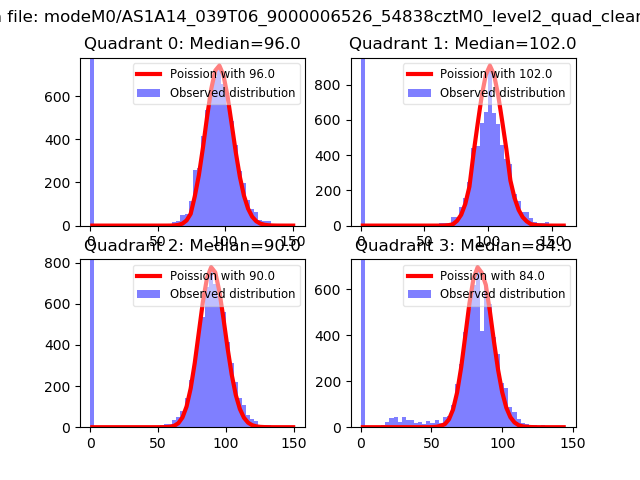 |
 |
| Quadrant-wise count rates Data is divided into 100 sec bins |
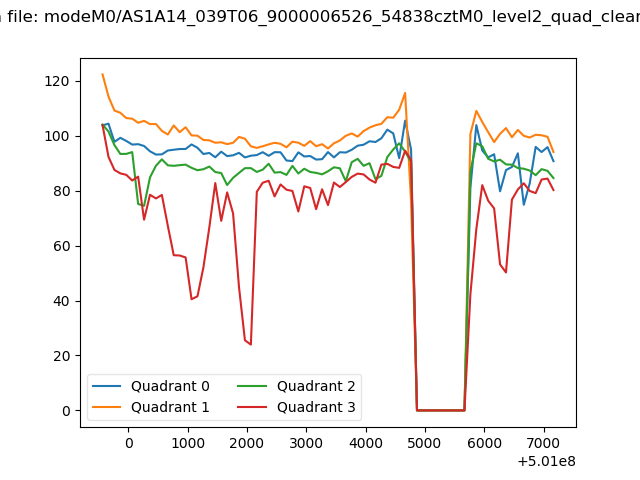 |
|
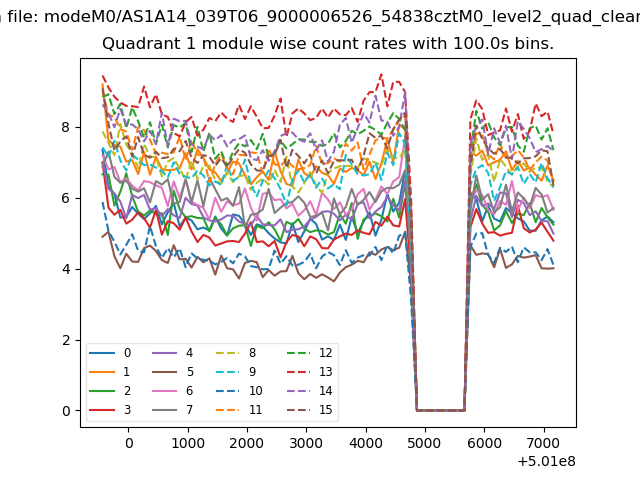
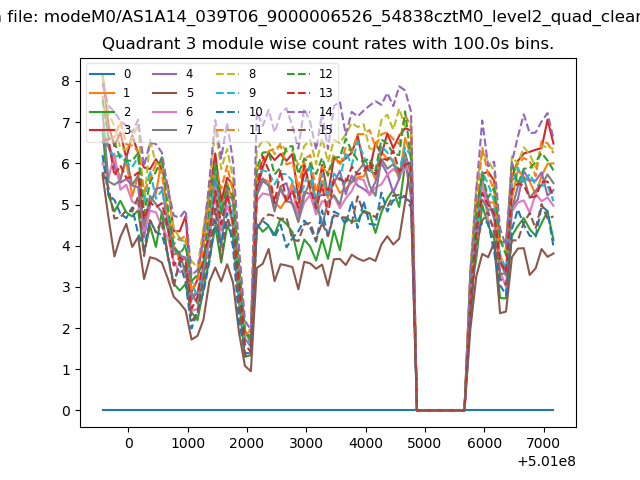
| Module-wise count rates for Quadrant A Data is divided into 100 sec bins |
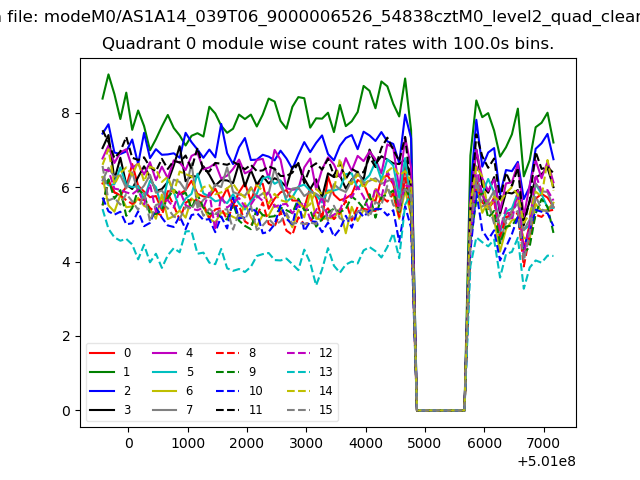 |
 |
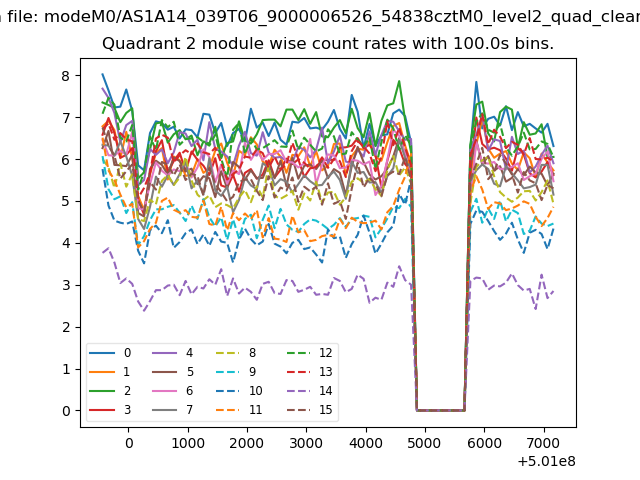
| Module-wise count rates for Quadrant B Data is divided into 100 sec bins |
 |
 |
| Module-wise count rates for Quadrant C Data is divided into 100 sec bins |
 |
 |
| Module-wise count rates for Quadrant D Data is divided into 100 sec bins |
 |
 |
| Parameter | Plot |
|---|---|
| CZT HV Monitor | 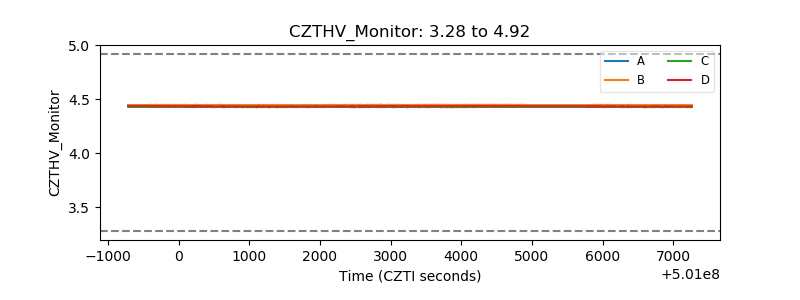 |
| D_VDD | 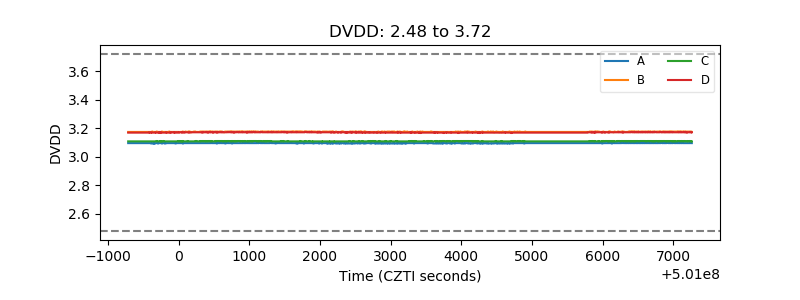 |
| Temperature 1 | 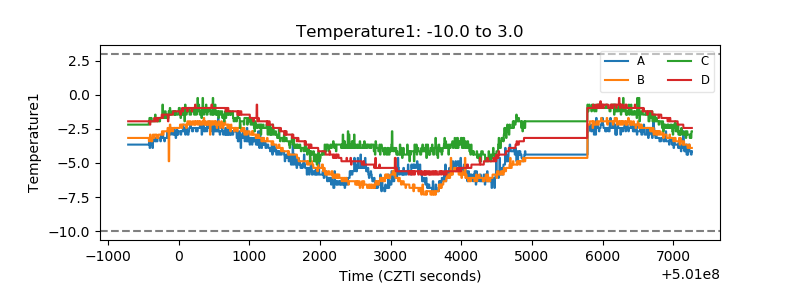 |
| Veto HV Monitor | 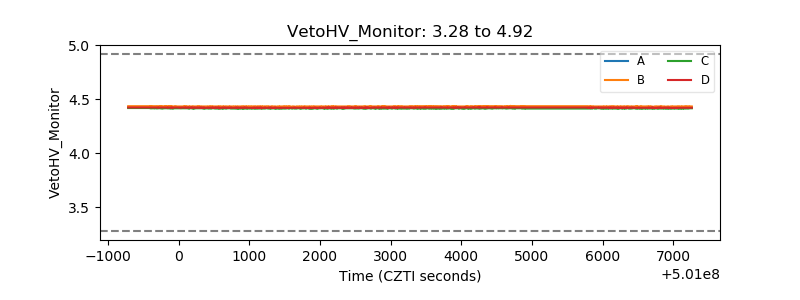 |
| Veto LLD | 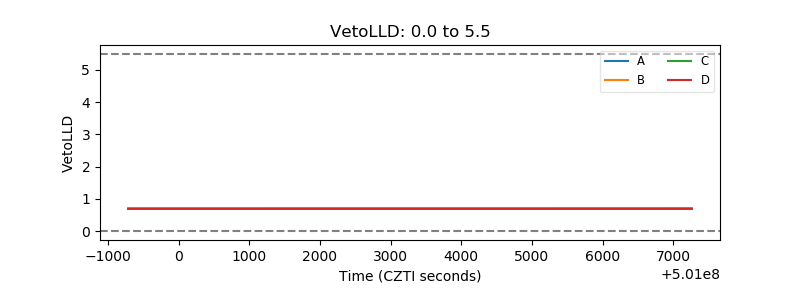 |
| Alpha Counter | 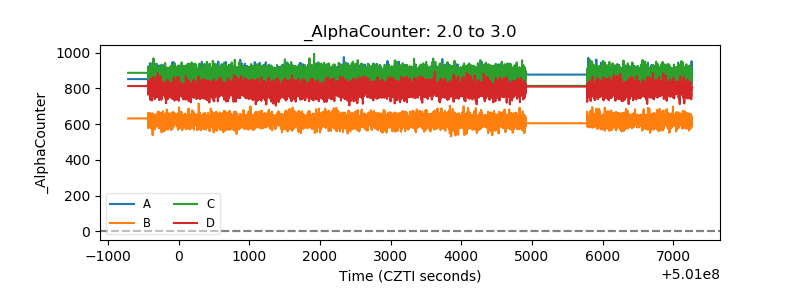 |
| _CPM_Rate | 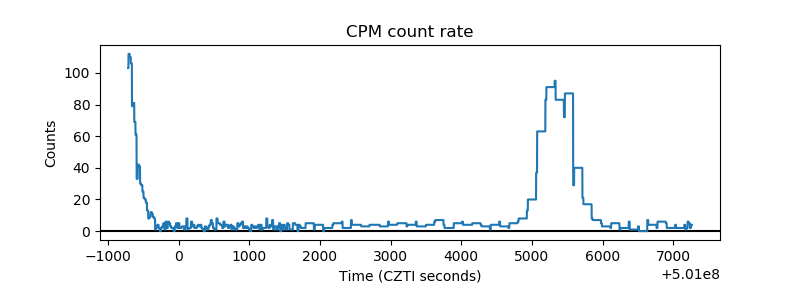 |
| CZT Counter | 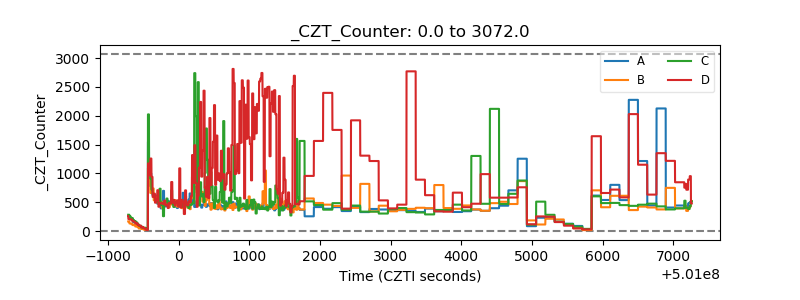 |
| +2.5 Volts monitor |  |
| +5 Volts monitor |  |
| _ROLL_ROT | 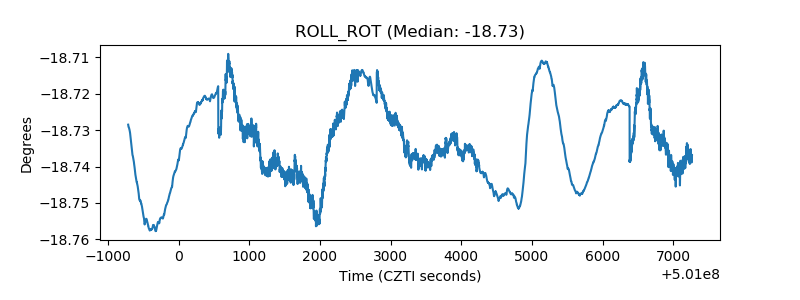 |
| _Roll_DEC | 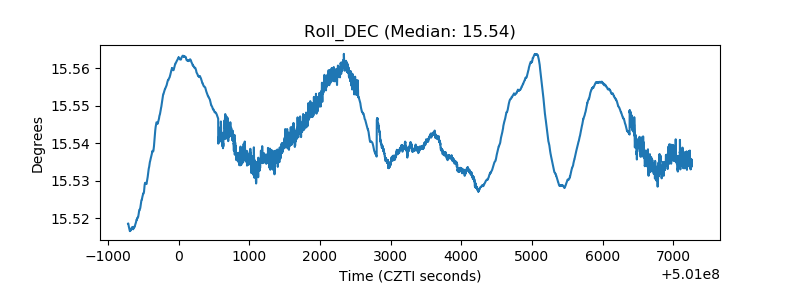 |
| _Roll_RA | 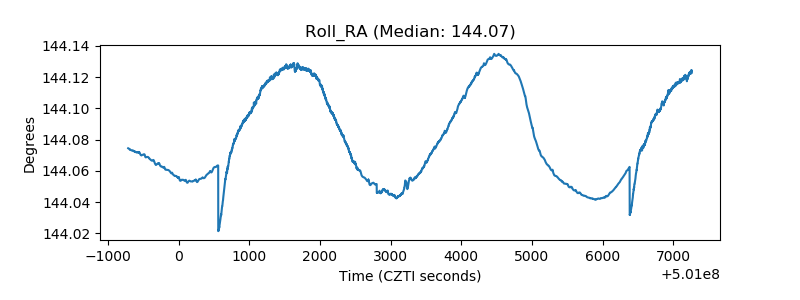 |
| Veto Counter | 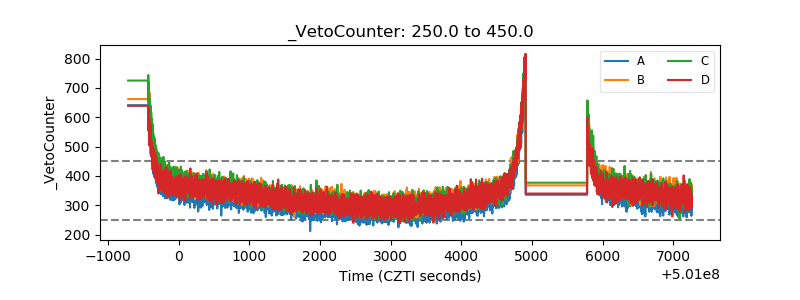 |