| Param | Original file | Final file |
|---|---|---|
| Filename | modeM0/AS1A14_039T06_9000006526_54839cztM0_level2.fits | modeM0/AS1A14_039T06_9000006526_54839cztM0_level2_quad_clean.evt |
| Size (bytes) | 458,769,600 | 103,982,400 |
| Size | 437.5 MB | 99.2 MB |
| Events in quadrant A | 3,587,756 | 680,185 |
| Events in quadrant B | 3,705,277 | 725,846 |
| Events in quadrant C | 3,995,765 | 641,463 |
| Events in quadrant D | 5,128,412 | 595,134 |
| Mode M9 | |||
|---|---|---|---|
| Quadrant | BADHDUFLAG | Total packets | Discarded packets |
| A | 0 | 4 | 0 |
| B | 0 | 4 | 0 |
| C | 0 | 4 | 0 |
| D | 0 | 4 | 0 |
| Mode M0 | |||
|---|---|---|---|
| Quadrant | BADHDUFLAG | Total packets | Discarded packets |
| A | 0 | 16144 | 1 |
| B | 0 | 16359 | 2 |
| C | 0 | 17201 | 1 |
| D | 0 | 20487 | 1 |
| Mode SS | |||
|---|---|---|---|
| Quadrant | BADHDUFLAG | Total packets | Discarded packets |
| A | 0 | 148 | 0 |
| B | 0 | 148 | 0 |
| C | 0 | 148 | 0 |
| D | 0 | 148 | 0 |
| Quadrant | Total seconds | Saturated seconds | Saturation percentage |
|---|---|---|---|
| A | 7265 | 194 | 2.670337% |
| B | 7265 | 187 | 2.573985% |
| C | 7265 | 258 | 3.551273% |
| D | 7265 | 400 | 5.505850% |
Noise dominated data is calculated using 1-second bins in cleaned event files. If a bin has >2000 counts, and if more than 50% of those come from <1% of pixels, then it is considered to be noise-dominated and hence unusable.
| Quadrant | # 1 sec bins | Bins with >0 counts | Bins with >2000 counts | High rate bins dominated by noise | Noise dominated (total time) | Noise dominated (detector-on time) | Marked lightcurve |
|---|---|---|---|---|---|---|---|
| A | 7705 | 7266 | 70 | 70 | 0.91% | 0.96% | 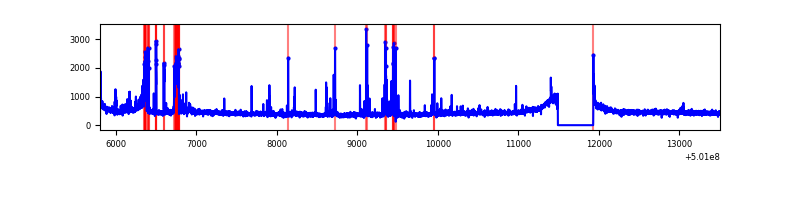 |
| B | 7705 | 7266 | 32 | 32 | 0.42% | 0.44% | 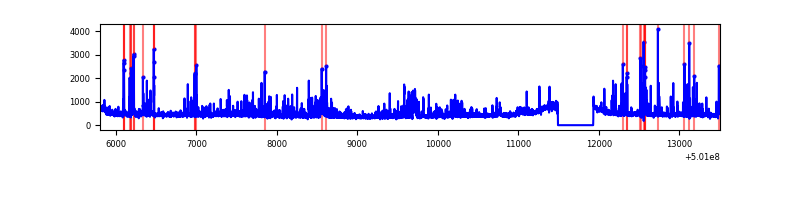 |
| C | 7705 | 7266 | 154 | 154 | 2.00% | 2.12% | 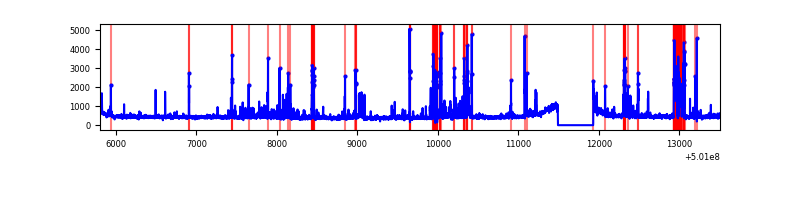 |
| D | 7705 | 7266 | 264 | 264 | 3.43% | 3.63% | 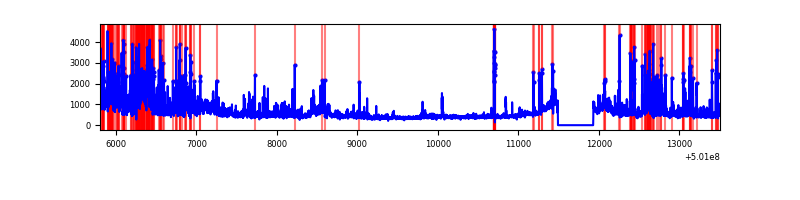 |
Top three noisy pixels from each quadrant. If the there are fewer than three noisy pixels in the level2.evt file, extra rows are filled as -1
| Pixel properties | Quadrant properties | ||||||
|---|---|---|---|---|---|---|---|
| Quadrant | DetID | PixID | Counts | Sigma | Mean | Median | Sigma |
| A | 12 | 17 | 234254 | 1198.93 | 791 | 770 | 194.7 |
| A | 8 | 206 | 115227 | 587.73 | 791 | 770 | 194.7 |
| A | 12 | 194 | 35046 | 176.01 | 791 | 770 | 194.7 |
| B | 5 | 236 | 201221 | 1183.05 | 780 | 751 | 169.5 |
| B | 10 | 247 | 166093 | 975.75 | 780 | 751 | 169.5 |
| B | 5 | 185 | 105883 | 620.42 | 780 | 751 | 169.5 |
| C | 4 | 5 | 253217 | 1208.65 | 768 | 762 | 208.9 |
| C | 12 | 252 | 172180 | 820.68 | 768 | 762 | 208.9 |
| C | 6 | 223 | 171710 | 818.43 | 768 | 762 | 208.9 |
| D | 15 | 94 | 399151 | 1831.54 | 761 | 727 | 217.5 |
| D | 3 | 12 | 367177 | 1684.55 | 761 | 727 | 217.5 |
| D | 11 | 176 | 295989 | 1357.31 | 761 | 727 | 217.5 |
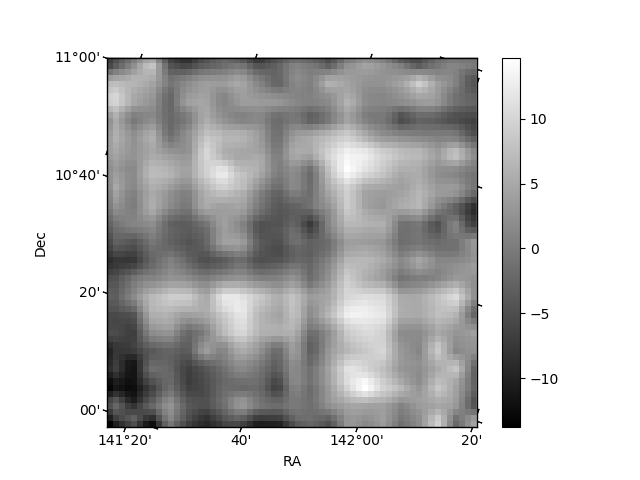
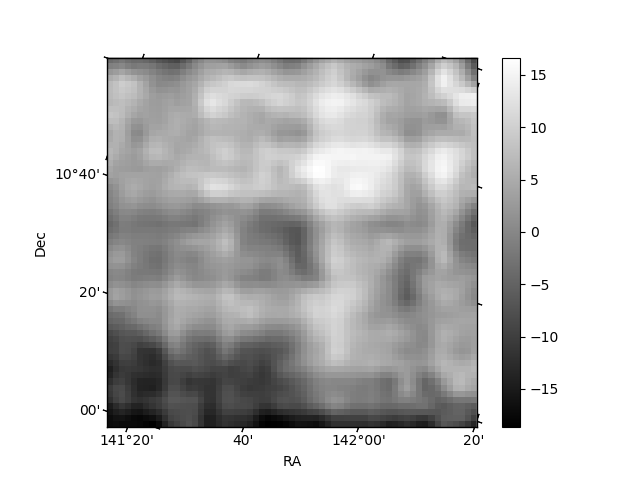
Histogram calculated using DETX and DETY for each event in the final _common_clean file
| Quadrant A | 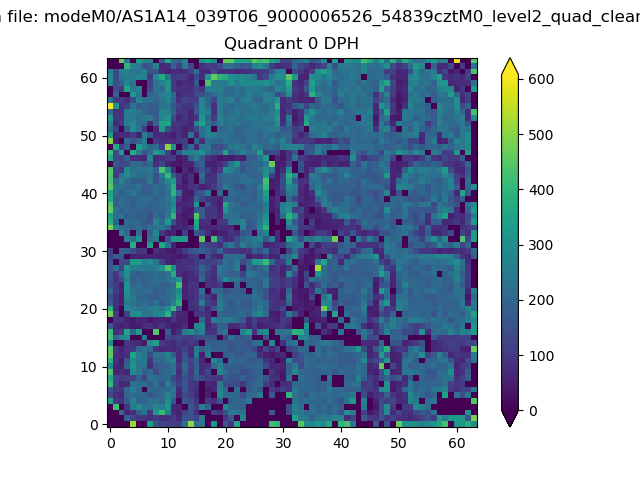 |
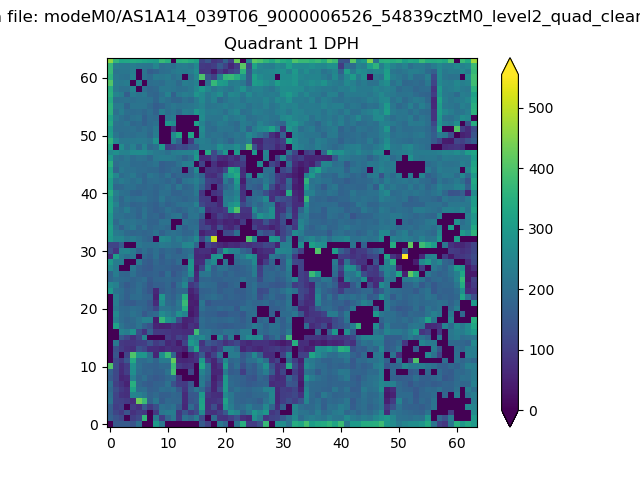 |
Quadrant B |
|---|---|---|---|
| Quadrant D | 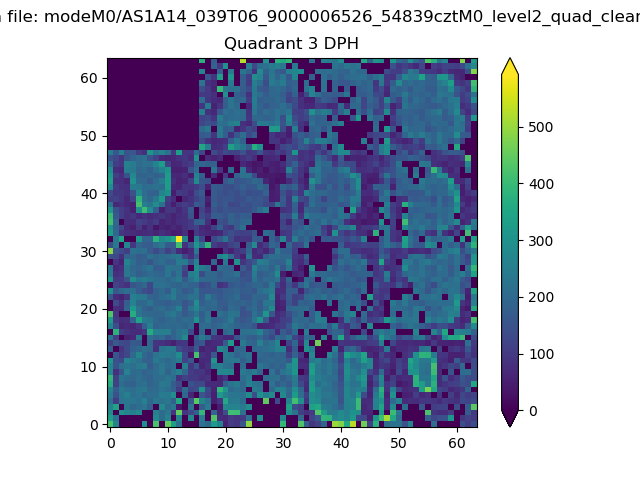 |
 |
Quadrant C |
| Plot type | Count rate plots | Images |
|---|---|---|
| Comparison with Poisson distribution Blue bars denote a histogram of data divided into 1 sec bins. Red curve is a Poisson curve with rate = median count rate of data. |
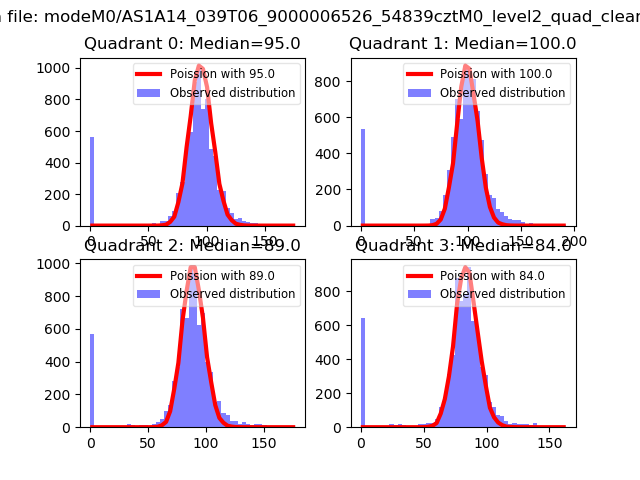 |
 |
| Quadrant-wise count rates Data is divided into 100 sec bins |
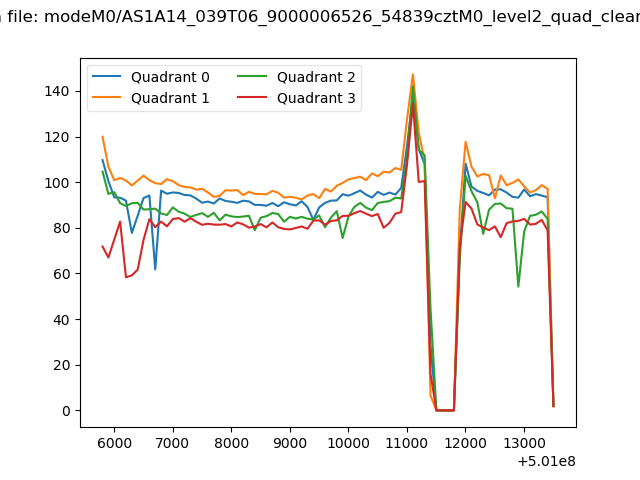 |
|
| Module-wise count rates for Quadrant A Data is divided into 100 sec bins |
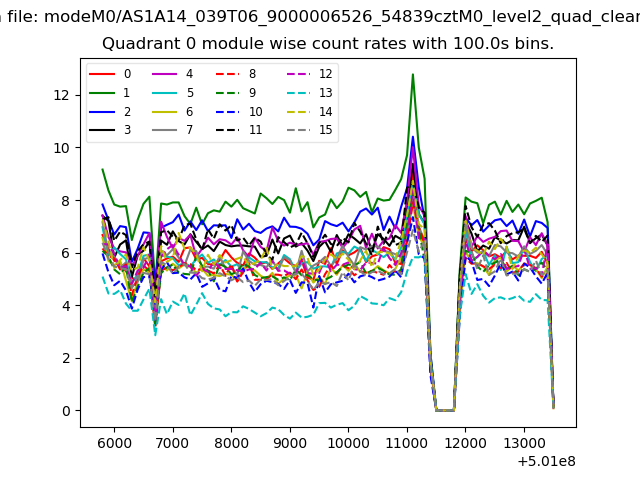 |
 |
| Module-wise count rates for Quadrant B Data is divided into 100 sec bins |
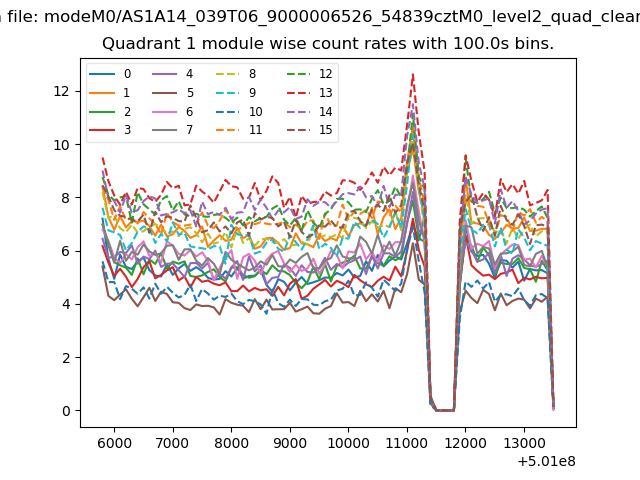 |
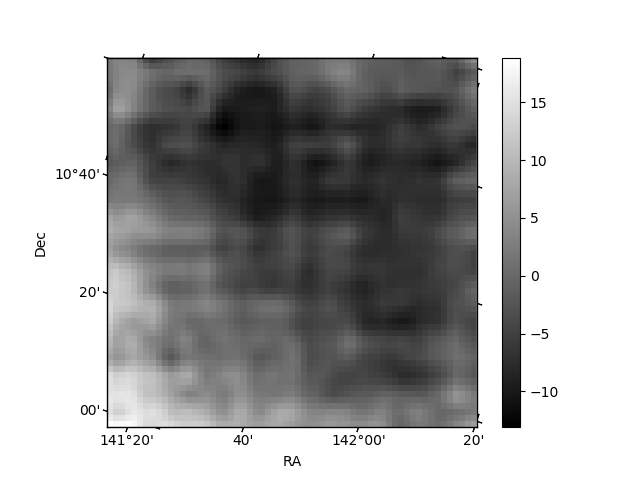 |
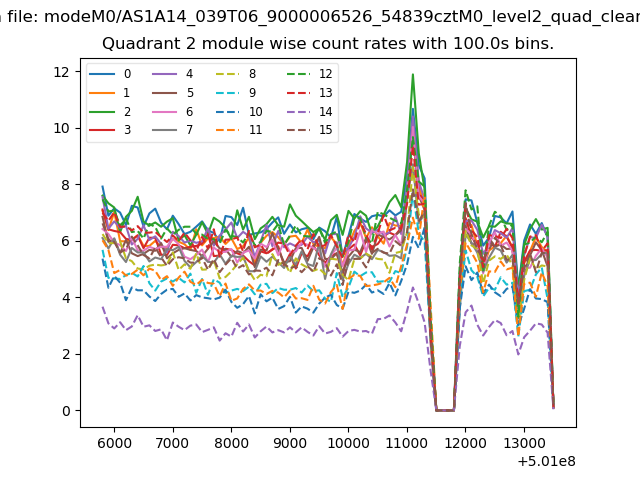
| Module-wise count rates for Quadrant C Data is divided into 100 sec bins |
 |
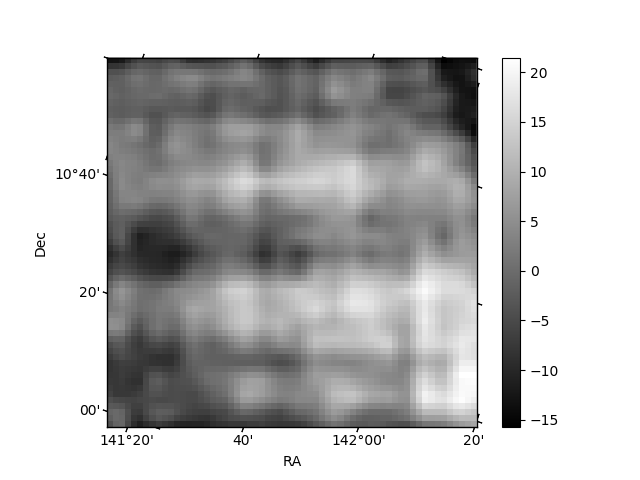 |
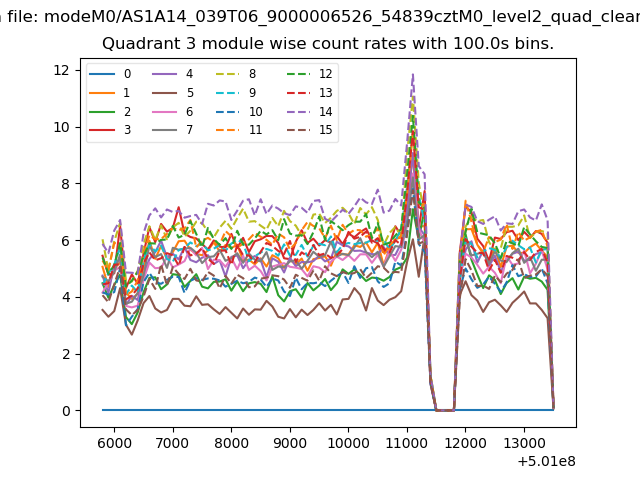
| Module-wise count rates for Quadrant D Data is divided into 100 sec bins |
 |
 |
| Parameter | Plot |
|---|---|
| CZT HV Monitor | 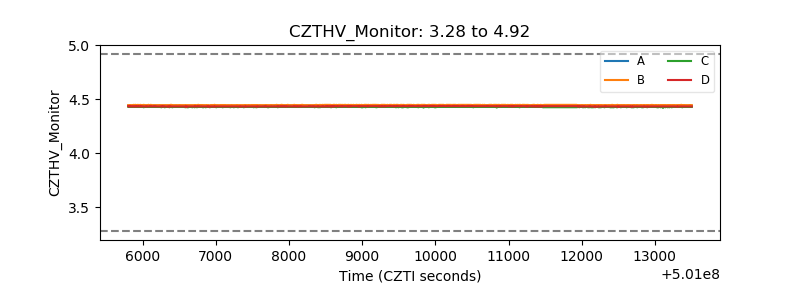 |
| D_VDD | 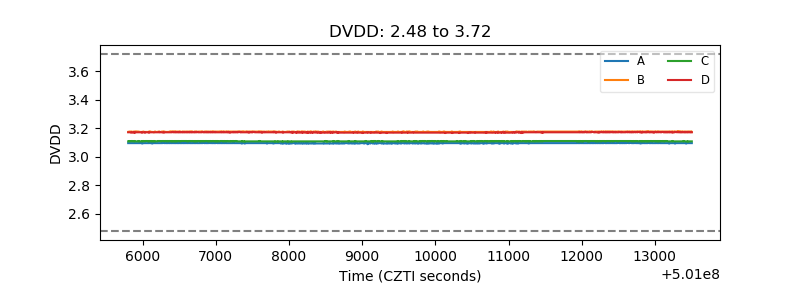 |
| Temperature 1 | 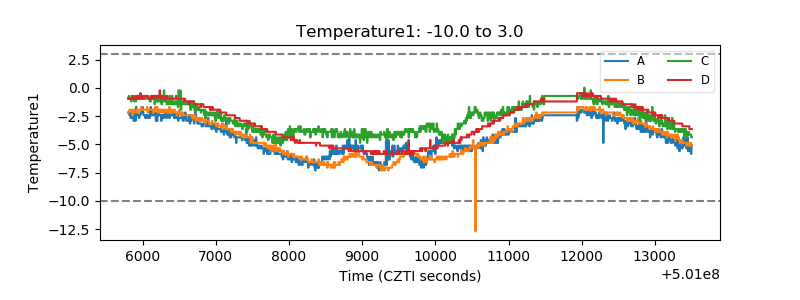 |
| Veto HV Monitor | 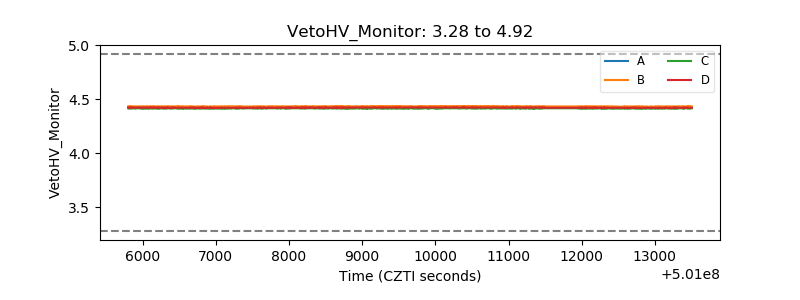 |
| Veto LLD | 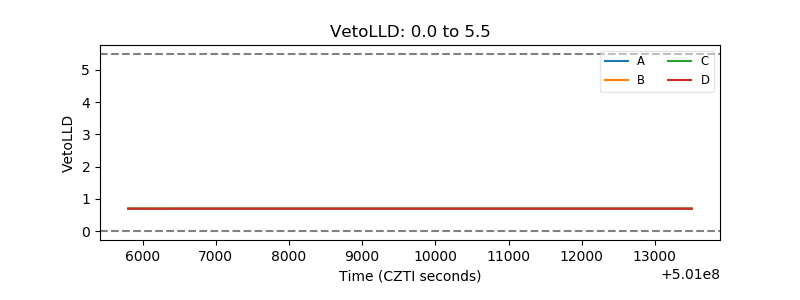 |
| Alpha Counter | 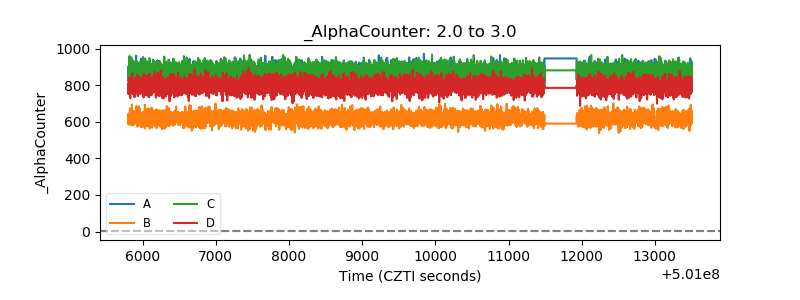 |
| _CPM_Rate | 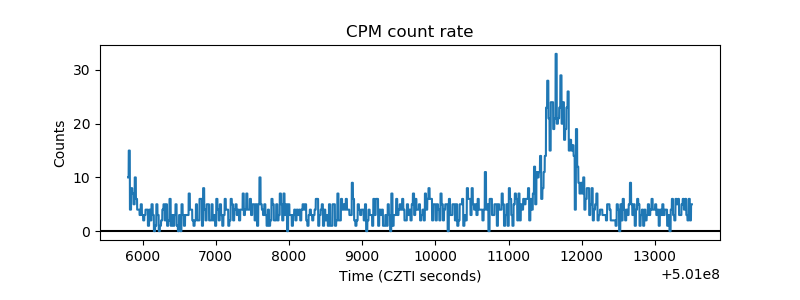 |
| CZT Counter | 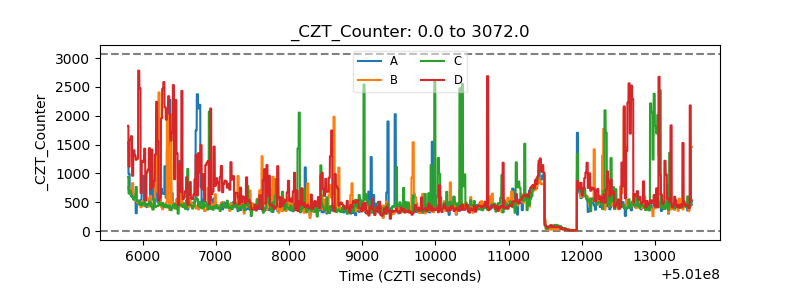 |
| +2.5 Volts monitor |  |
| +5 Volts monitor |  |
| _ROLL_ROT | 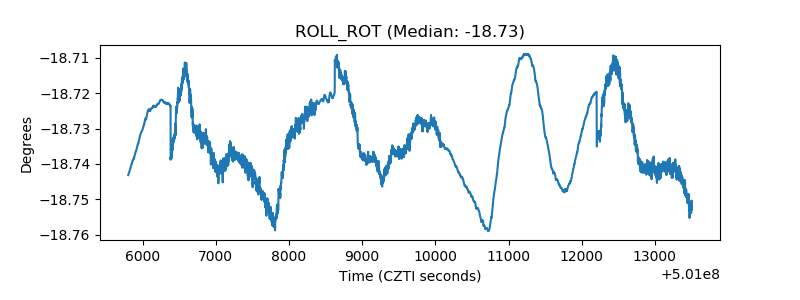 |
| _Roll_DEC | 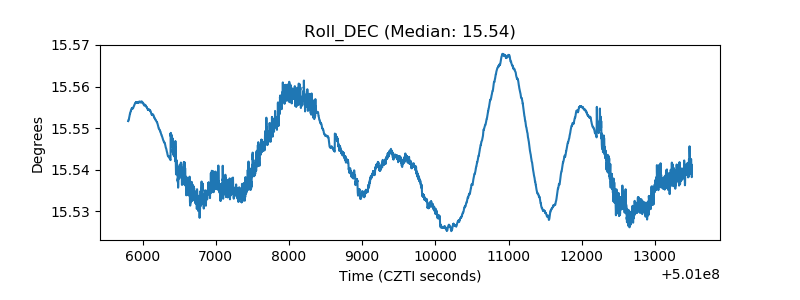 |
| _Roll_RA |  |
| Veto Counter | 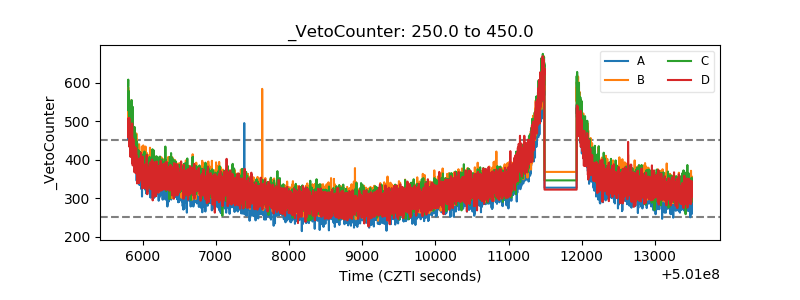 |