| Param | Original file | Final file |
|---|---|---|
| Filename | modeM0/AS1A14_039T06_9000006526_54841cztM0_level2.fits | modeM0/AS1A14_039T06_9000006526_54841cztM0_level2_quad_clean.evt |
| Size (bytes) | 517,063,680 | 123,082,560 |
| Size | 493.1 MB | 117.4 MB |
| Events in quadrant A | 3,896,581 | 808,122 |
| Events in quadrant B | 4,827,794 | 850,261 |
| Events in quadrant C | 4,802,045 | 760,357 |
| Events in quadrant D | 4,944,350 | 710,291 |
| Mode M0 | |||
|---|---|---|---|
| Quadrant | BADHDUFLAG | Total packets | Discarded packets |
| A | 0 | 18169 | 0 |
| B | 0 | 20631 | 0 |
| C | 0 | 20654 | 0 |
| D | 0 | 21235 | 0 |
| Mode SS | |||
|---|---|---|---|
| Quadrant | BADHDUFLAG | Total packets | Discarded packets |
| A | 0 | 172 | 0 |
| B | 0 | 172 | 0 |
| C | 0 | 172 | 0 |
| D | 0 | 172 | 0 |
| Quadrant | Total seconds | Saturated seconds | Saturation percentage |
|---|---|---|---|
| A | 8611 | 46 | 0.534200% |
| B | 8611 | 221 | 2.566485% |
| C | 8611 | 156 | 1.811636% |
| D | 8611 | 285 | 3.309720% |
Noise dominated data is calculated using 1-second bins in cleaned event files. If a bin has >2000 counts, and if more than 50% of those come from <1% of pixels, then it is considered to be noise-dominated and hence unusable.
| Quadrant | # 1 sec bins | Bins with >0 counts | Bins with >2000 counts | High rate bins dominated by noise | Noise dominated (total time) | Noise dominated (detector-on time) | Marked lightcurve |
|---|---|---|---|---|---|---|---|
| A | 8611 | 8611 | 22 | 22 | 0.26% | 0.26% | 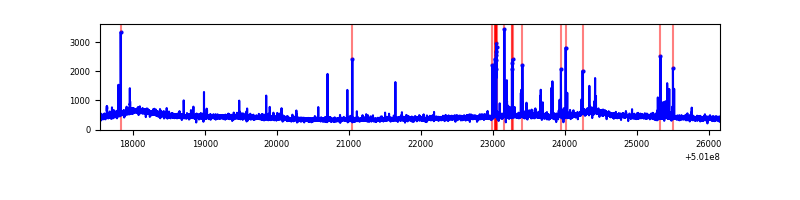 |
| B | 8611 | 8611 | 176 | 176 | 2.04% | 2.04% | 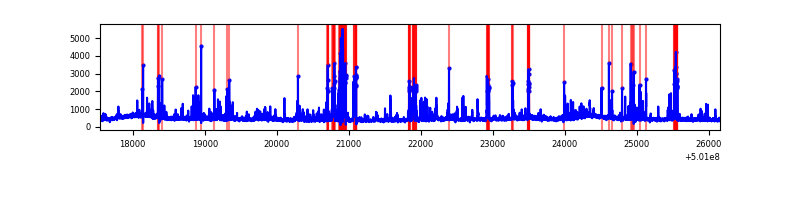 |
| C | 8611 | 8611 | 120 | 120 | 1.39% | 1.39% | 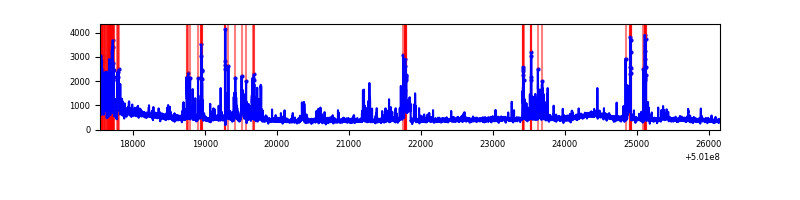 |
| D | 8611 | 8611 | 234 | 234 | 2.72% | 2.72% | 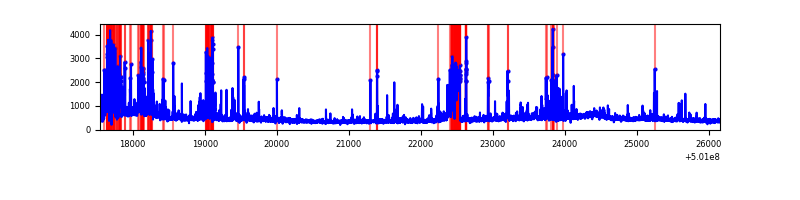 |
Top three noisy pixels from each quadrant. If the there are fewer than three noisy pixels in the level2.evt file, extra rows are filled as -1
| Pixel properties | Quadrant properties | ||||||
|---|---|---|---|---|---|---|---|
| Quadrant | DetID | PixID | Counts | Sigma | Mean | Median | Sigma |
| A | 8 | 206 | 71968 | 307.82 | 929 | 906 | 230.9 |
| A | 13 | 248 | 70062 | 299.57 | 929 | 906 | 230.9 |
| A | 4 | 3 | 55353 | 235.85 | 929 | 906 | 230.9 |
| B | 5 | 185 | 553147 | 2847.03 | 906 | 873 | 194.0 |
| B | 2 | 249 | 380926 | 1959.21 | 906 | 873 | 194.0 |
| B | 10 | 247 | 146331 | 749.85 | 906 | 873 | 194.0 |
| C | 12 | 252 | 418952 | 1718.67 | 899 | 891 | 243.2 |
| C | 15 | 209 | 350058 | 1435.44 | 899 | 891 | 243.2 |
| C | 4 | 5 | 256704 | 1051.66 | 899 | 891 | 243.2 |
| D | 3 | 12 | 340370 | 1342.33 | 893 | 854 | 252.9 |
| D | 15 | 42 | 259334 | 1021.94 | 893 | 854 | 252.9 |
| D | 15 | 250 | 257685 | 1015.42 | 893 | 854 | 252.9 |
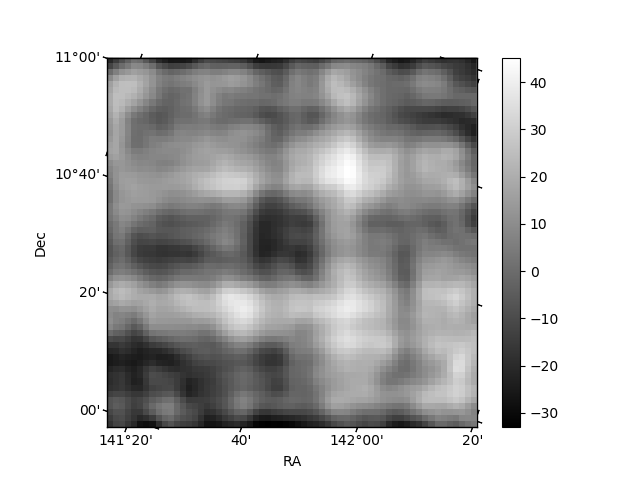
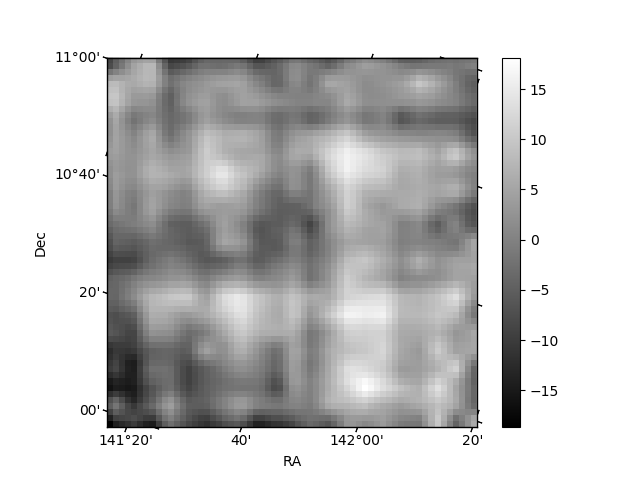
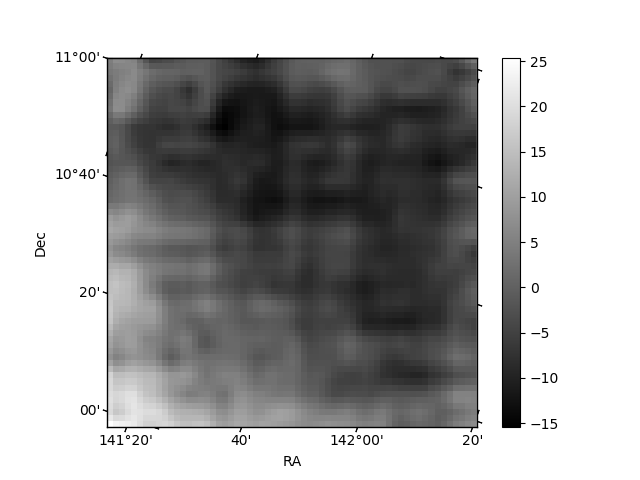
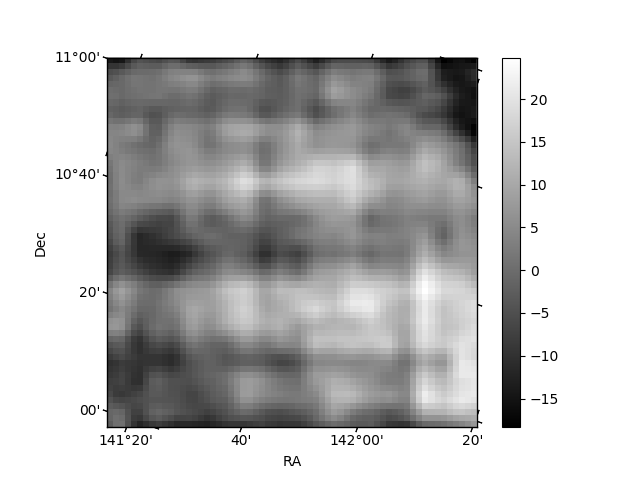
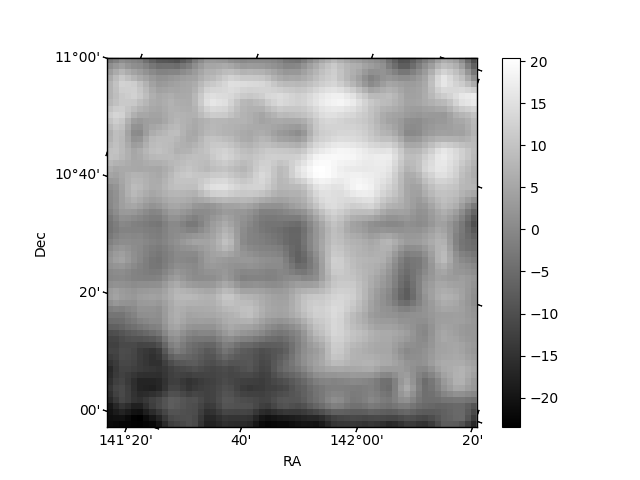
Histogram calculated using DETX and DETY for each event in the final _common_clean file
| Quadrant A | 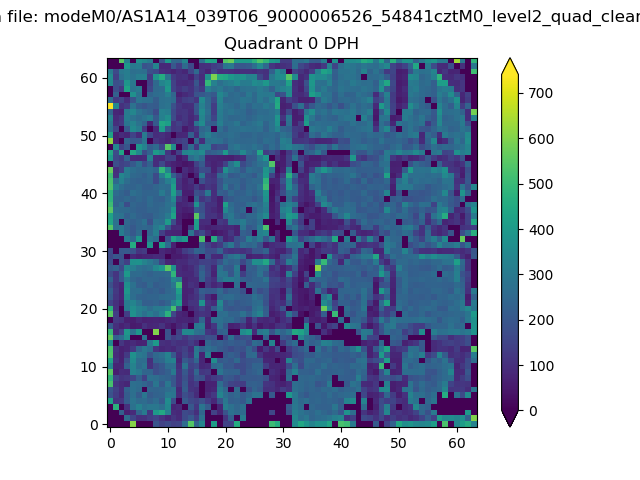 |
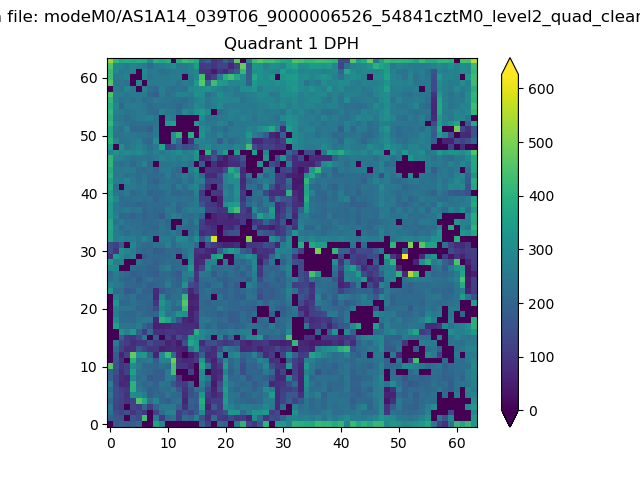 |
Quadrant B |
|---|---|---|---|
| Quadrant D | 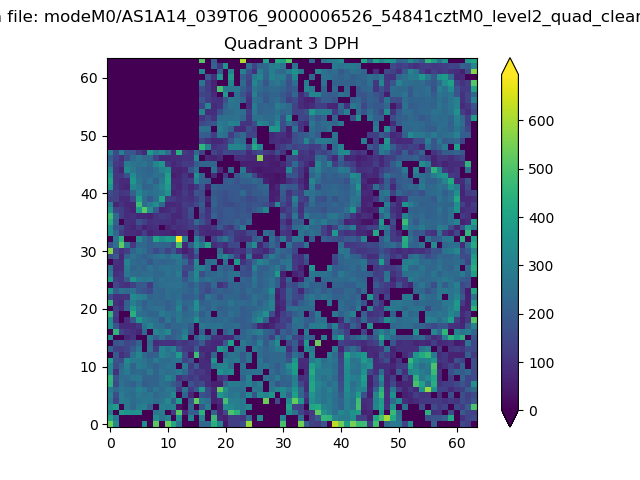 |
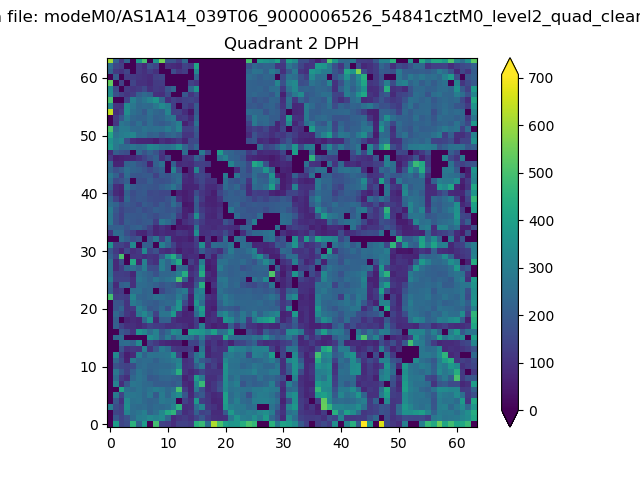 |
Quadrant C |
| Plot type | Count rate plots | Images |
|---|---|---|
| Comparison with Poisson distribution Blue bars denote a histogram of data divided into 1 sec bins. Red curve is a Poisson curve with rate = median count rate of data. |
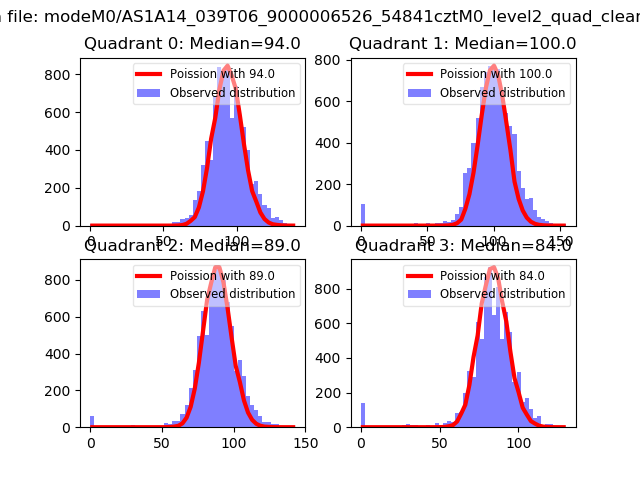 |
 |
| Quadrant-wise count rates Data is divided into 100 sec bins |
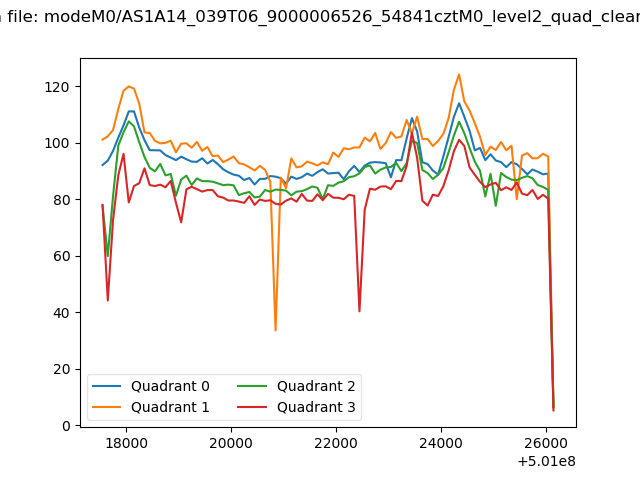 |
|
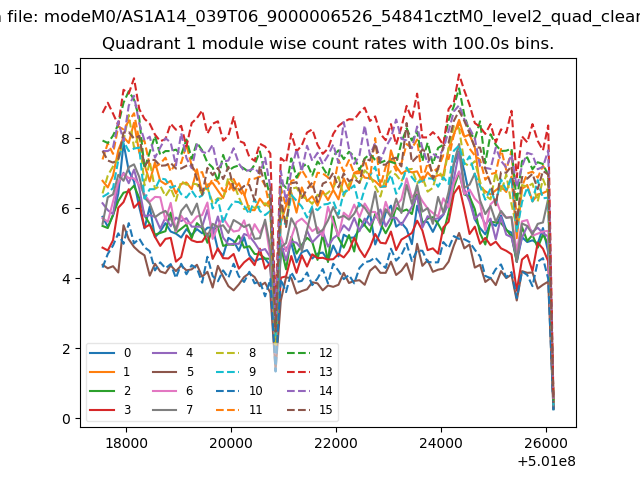
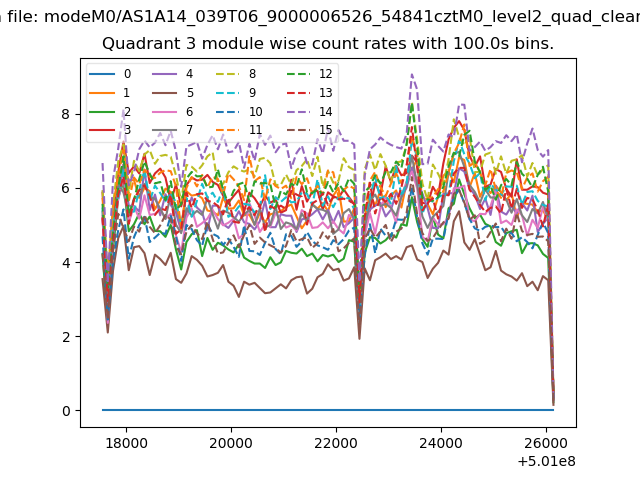
| Module-wise count rates for Quadrant A Data is divided into 100 sec bins |
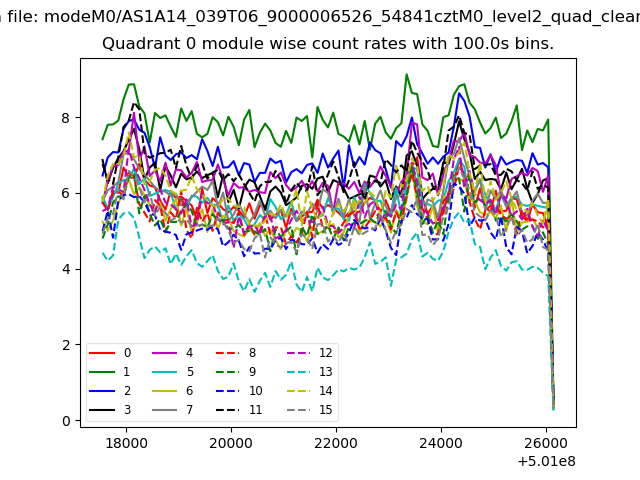 |
 |
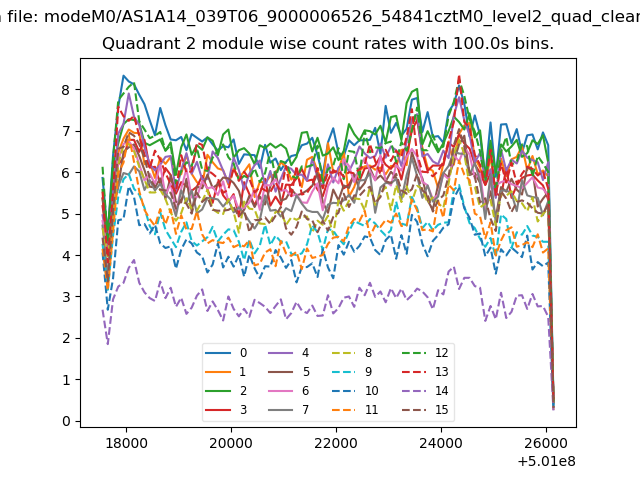
| Module-wise count rates for Quadrant B Data is divided into 100 sec bins |
 |
 |
| Module-wise count rates for Quadrant C Data is divided into 100 sec bins |
 |
 |
| Module-wise count rates for Quadrant D Data is divided into 100 sec bins |
 |
 |
| Parameter | Plot |
|---|---|
| CZT HV Monitor | 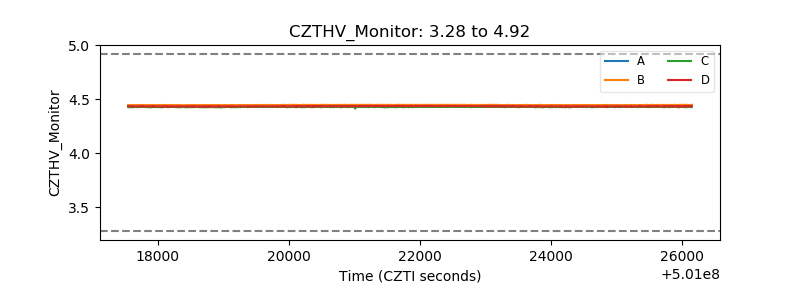 |
| D_VDD | 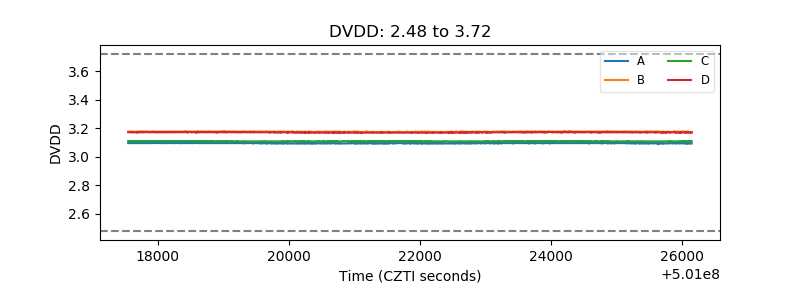 |
| Temperature 1 | 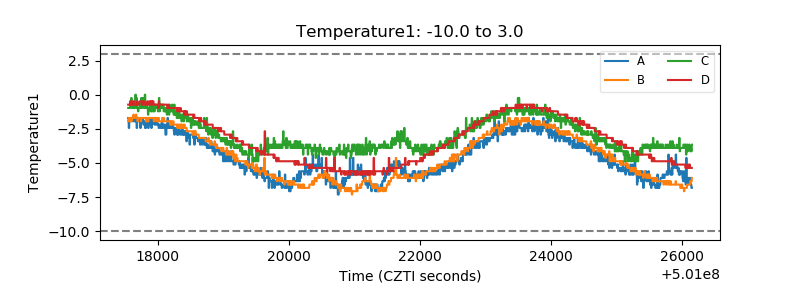 |
| Veto HV Monitor | 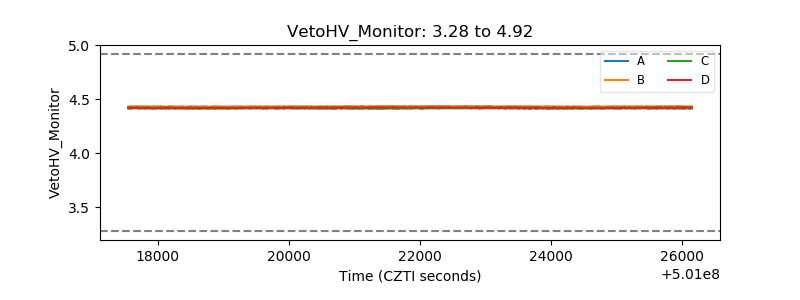 |
| Veto LLD | 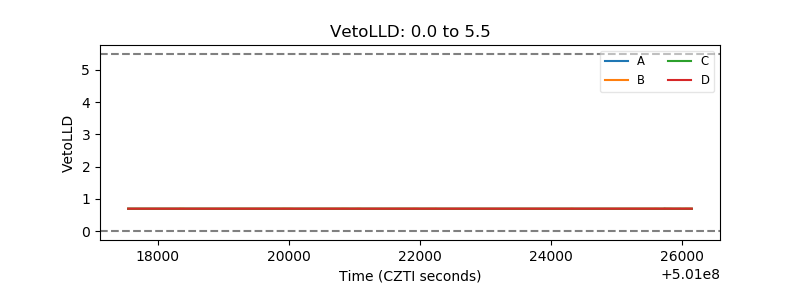 |
| Alpha Counter | 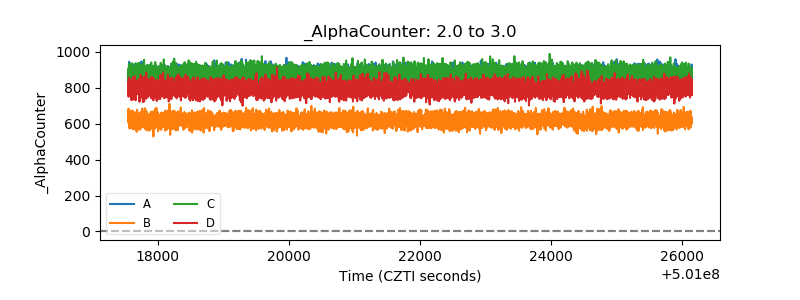 |
| _CPM_Rate | 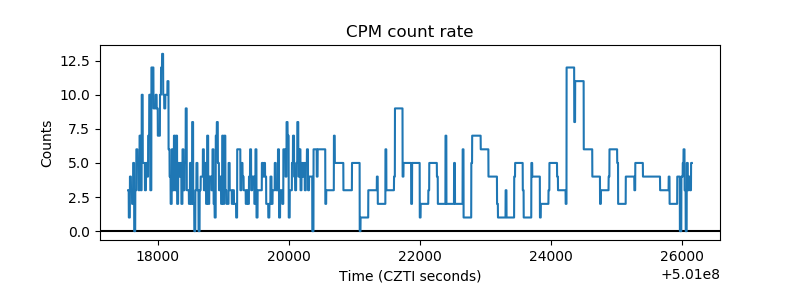 |
| CZT Counter | 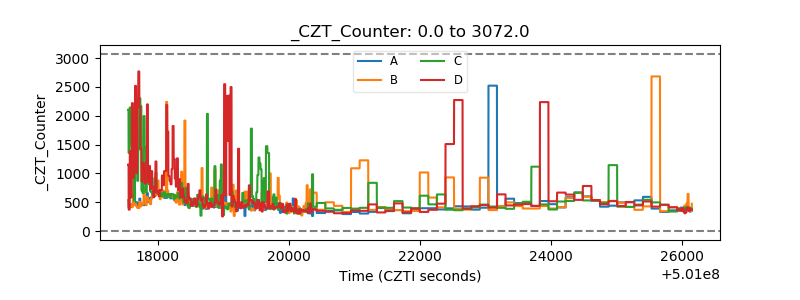 |
| +2.5 Volts monitor |  |
| +5 Volts monitor |  |
| _ROLL_ROT | 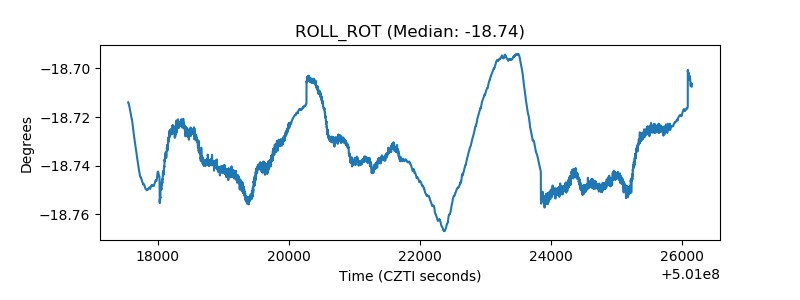 |
| _Roll_DEC | 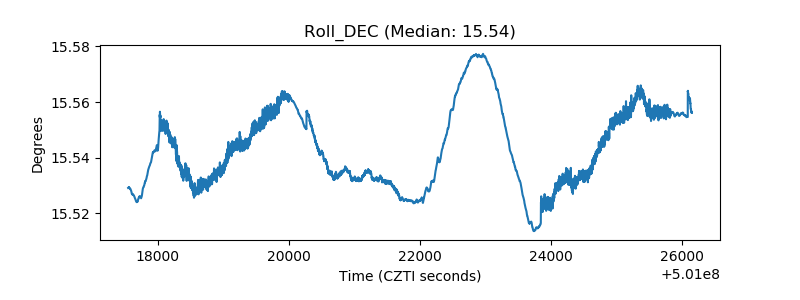 |
| _Roll_RA | 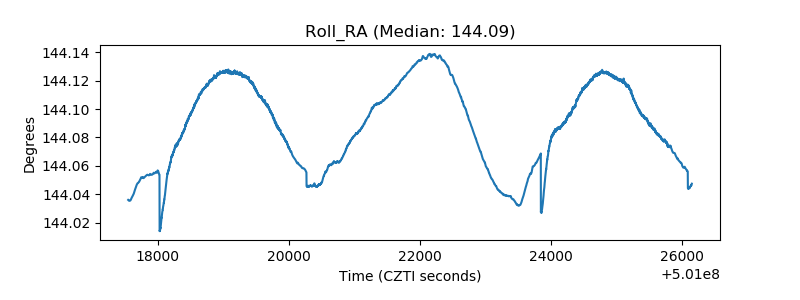 |
| Veto Counter | 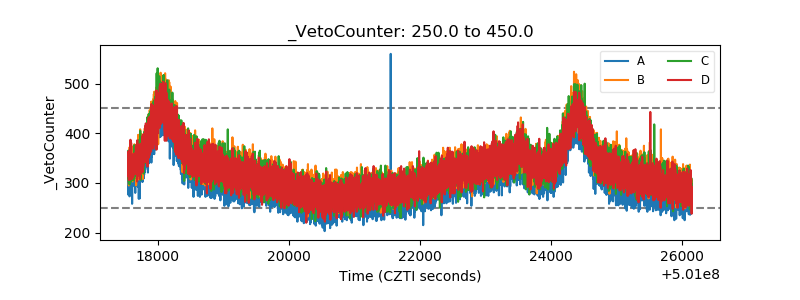 |