| Param | Original file | Final file |
|---|---|---|
| Filename | modeM0/AS1A14_039T06_9000006526_54844cztM0_level2.fits | modeM0/AS1A14_039T06_9000006526_54844cztM0_level2_quad_clean.evt |
| Size (bytes) | 682,067,520 | 176,958,720 |
| Size | 650.5 MB | 168.8 MB |
| Events in quadrant A | 5,893,170 | 1,148,456 |
| Events in quadrant B | 5,999,090 | 1,230,267 |
| Events in quadrant C | 6,143,022 | 1,088,720 |
| Events in quadrant D | 6,249,109 | 1,032,848 |
| Mode M0 | |||
|---|---|---|---|
| Quadrant | BADHDUFLAG | Total packets | Discarded packets |
| A | 0 | 27076 | 0 |
| B | 0 | 27380 | 0 |
| C | 0 | 27664 | 0 |
| D | 0 | 27858 | 0 |
| Mode SS | |||
|---|---|---|---|
| Quadrant | BADHDUFLAG | Total packets | Discarded packets |
| A | 0 | 248 | 0 |
| B | 0 | 248 | 0 |
| C | 0 | 248 | 0 |
| D | 0 | 248 | 0 |
| Quadrant | Total seconds | Saturated seconds | Saturation percentage |
|---|---|---|---|
| A | 12411 | 168 | 1.353638% |
| B | 12411 | 170 | 1.369753% |
| C | 12411 | 144 | 1.160261% |
| D | 12412 | 103 | 0.829842% |
Noise dominated data is calculated using 1-second bins in cleaned event files. If a bin has >2000 counts, and if more than 50% of those come from <1% of pixels, then it is considered to be noise-dominated and hence unusable.
| Quadrant | # 1 sec bins | Bins with >0 counts | Bins with >2000 counts | High rate bins dominated by noise | Noise dominated (total time) | Noise dominated (detector-on time) | Marked lightcurve |
|---|---|---|---|---|---|---|---|
| A | 12411 | 12411 | 95 | 95 | 0.77% | 0.77% | 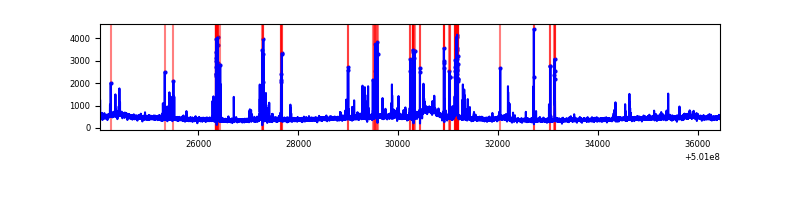 |
| B | 12411 | 12411 | 84 | 84 | 0.68% | 0.68% | 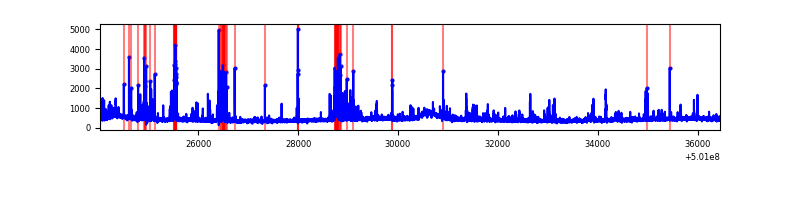 |
| C | 12411 | 12411 | 104 | 104 | 0.84% | 0.84% | 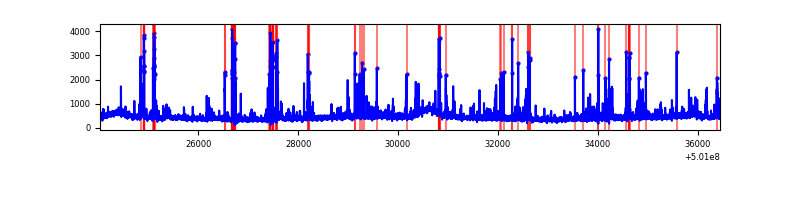 |
| D | 12412 | 12412 | 85 | 85 | 0.68% | 0.68% | 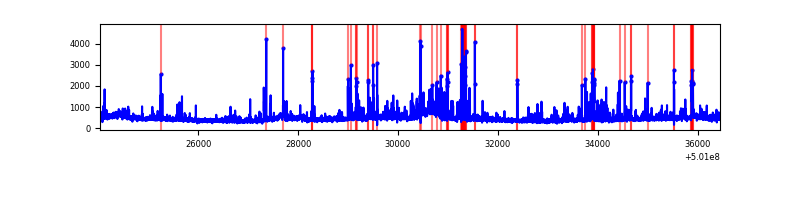 |
Top three noisy pixels from each quadrant. If the there are fewer than three noisy pixels in the level2.evt file, extra rows are filled as -1
| Pixel properties | Quadrant properties | ||||||
|---|---|---|---|---|---|---|---|
| Quadrant | DetID | PixID | Counts | Sigma | Mean | Median | Sigma |
| A | 13 | 248 | 350383 | 1081.75 | 1306 | 1279 | 322.7 |
| A | 8 | 206 | 225070 | 693.45 | 1306 | 1279 | 322.7 |
| A | 4 | 3 | 53845 | 162.88 | 1306 | 1279 | 322.7 |
| B | 5 | 185 | 520137 | 1858.6 | 1291 | 1244 | 279.2 |
| B | 10 | 247 | 151024 | 536.49 | 1291 | 1244 | 279.2 |
| B | 2 | 249 | 110012 | 389.59 | 1291 | 1244 | 279.2 |
| C | 12 | 252 | 344878 | 992.29 | 1269 | 1260 | 346.3 |
| C | 4 | 5 | 226555 | 650.6 | 1269 | 1260 | 346.3 |
| C | 15 | 209 | 177268 | 508.27 | 1269 | 1260 | 346.3 |
| D | 11 | 129 | 181586 | 504.58 | 1266 | 1214 | 357.5 |
| D | 2 | 31 | 153189 | 425.14 | 1266 | 1214 | 357.5 |
| D | 8 | 240 | 134486 | 372.82 | 1266 | 1214 | 357.5 |
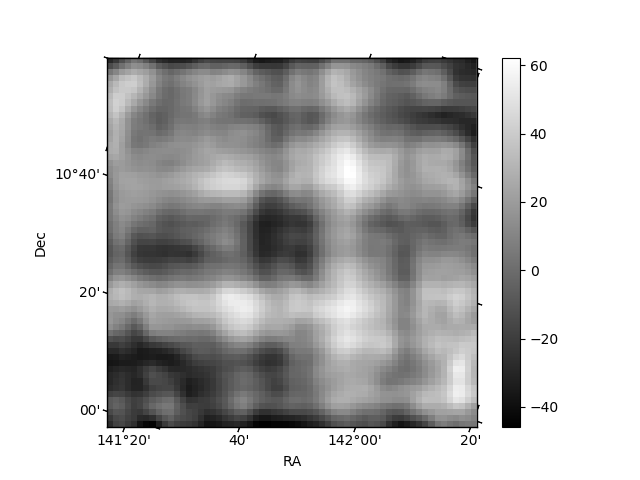
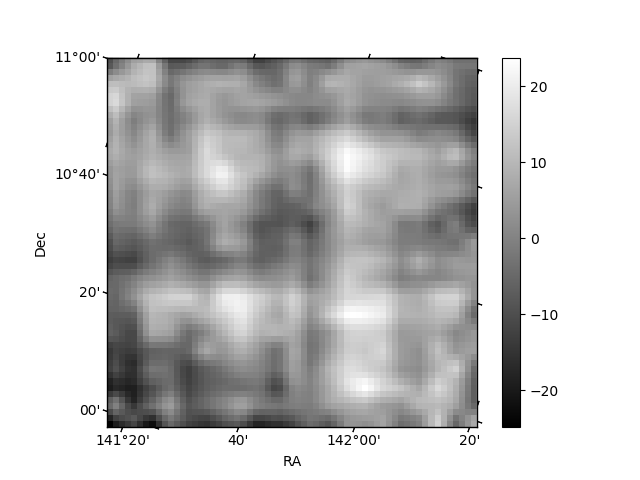
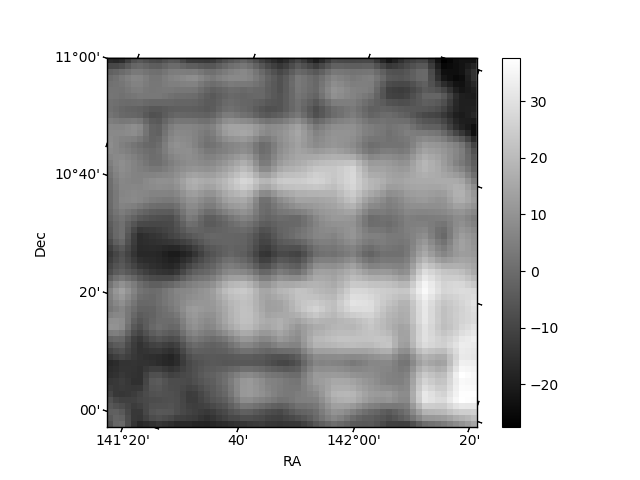
Histogram calculated using DETX and DETY for each event in the final _common_clean file
| Quadrant A | 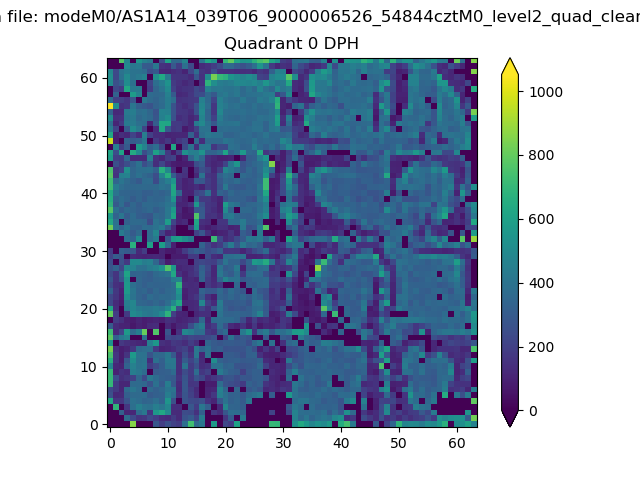 |
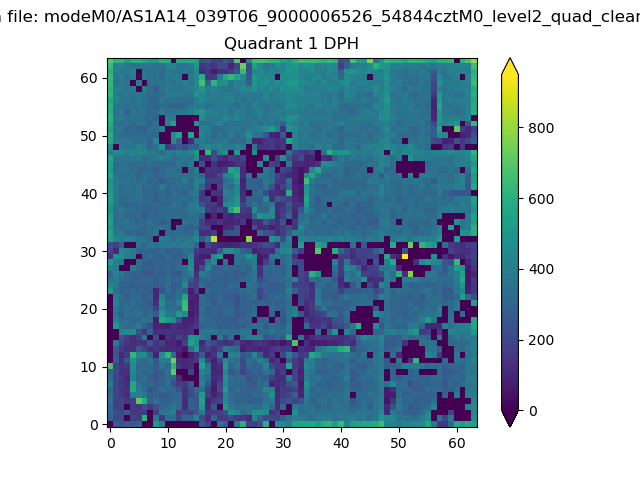 |
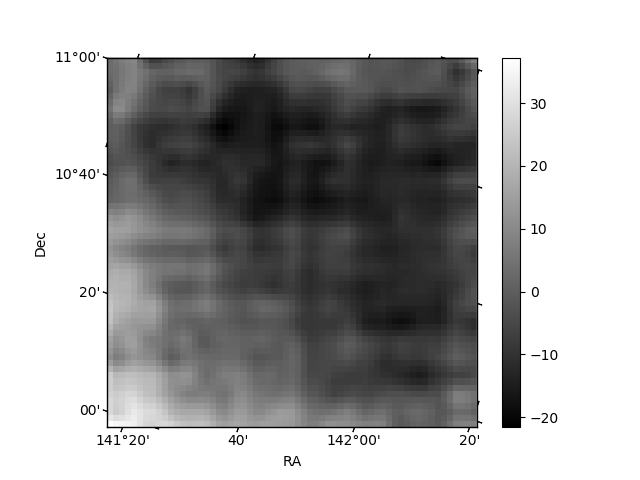
Quadrant B |
|---|---|---|---|
| Quadrant D | 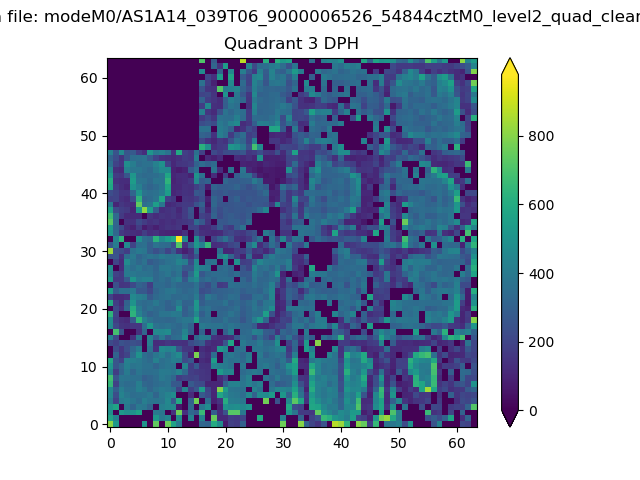 |
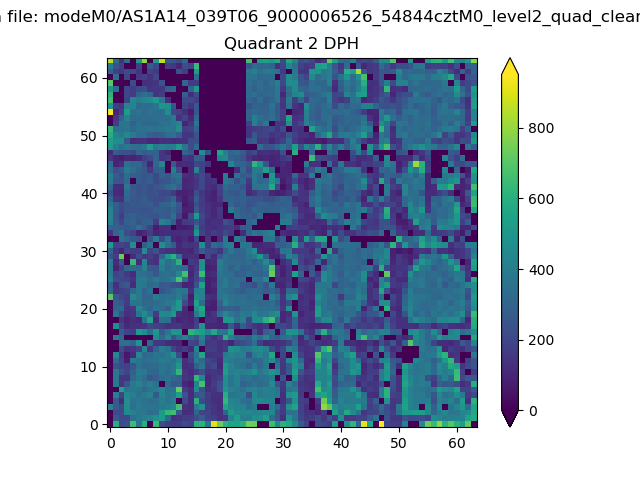 |
Quadrant C |
| Plot type | Count rate plots | Images |
|---|---|---|
| Comparison with Poisson distribution Blue bars denote a histogram of data divided into 1 sec bins. Red curve is a Poisson curve with rate = median count rate of data. |
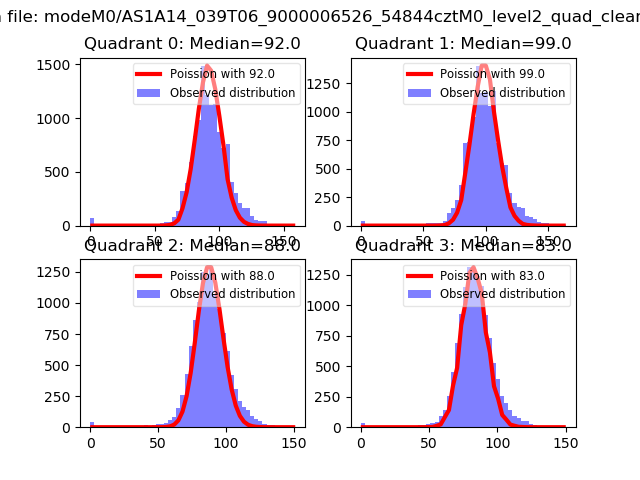 |
 |
| Quadrant-wise count rates Data is divided into 100 sec bins |
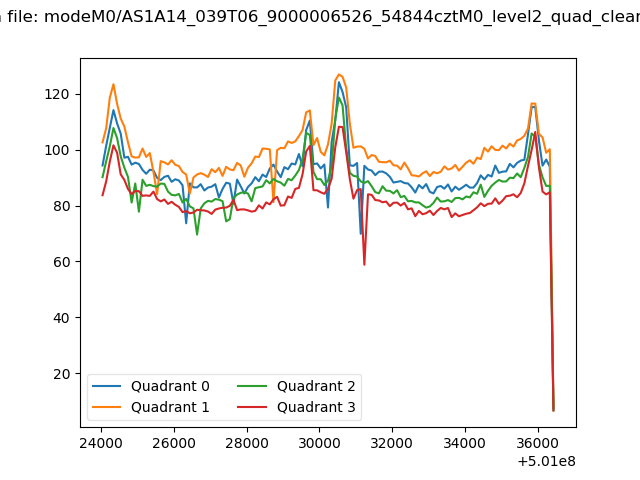 |
|
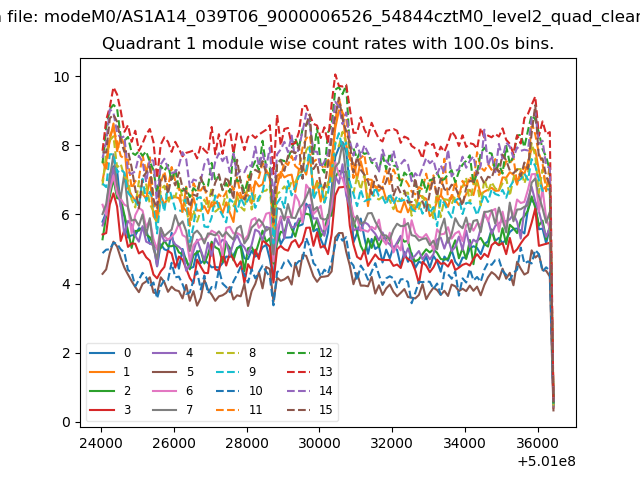
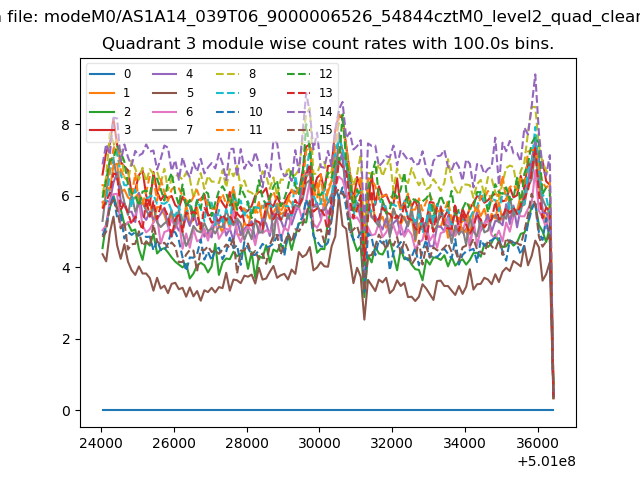
| Module-wise count rates for Quadrant A Data is divided into 100 sec bins |
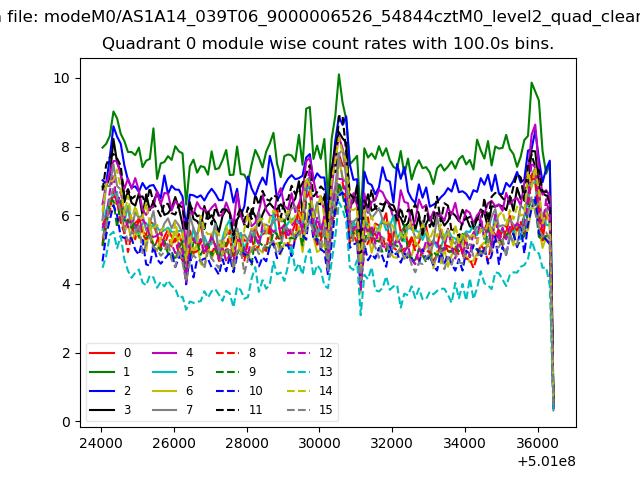 |
 |
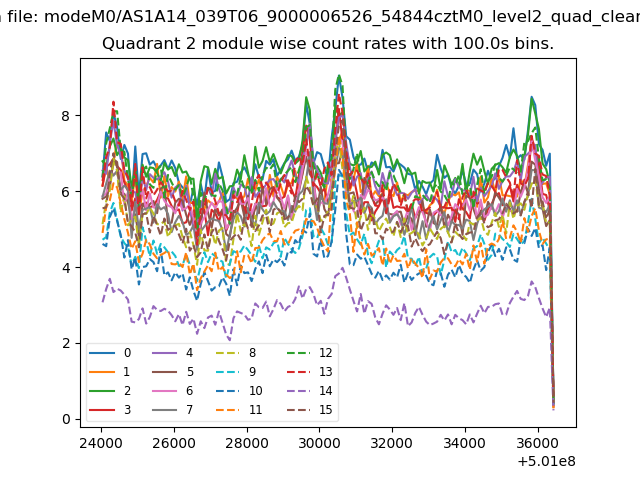
| Module-wise count rates for Quadrant B Data is divided into 100 sec bins |
 |
 |
| Module-wise count rates for Quadrant C Data is divided into 100 sec bins |
 |
 |
| Module-wise count rates for Quadrant D Data is divided into 100 sec bins |
 |
 |
| Parameter | Plot |
|---|---|
| CZT HV Monitor | 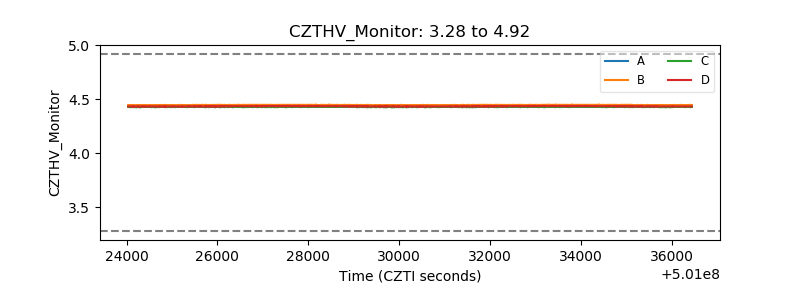 |
| D_VDD | 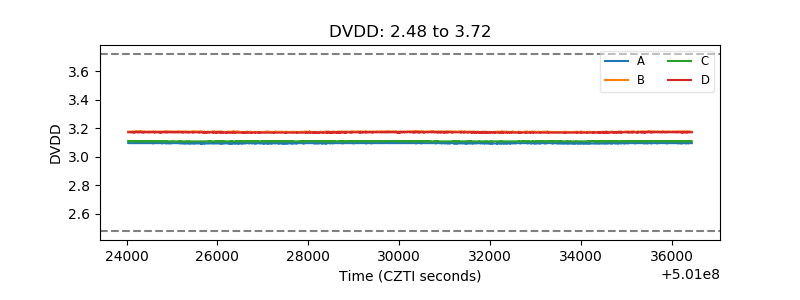 |
| Temperature 1 | 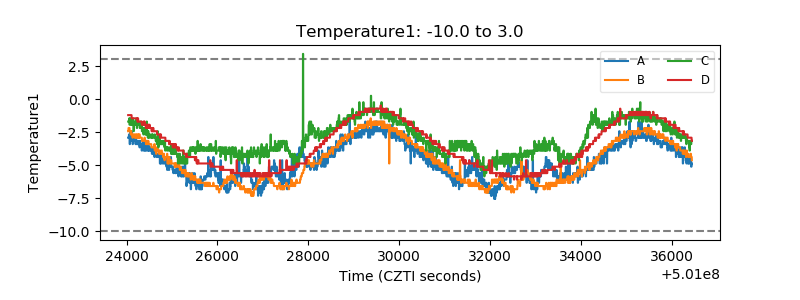 |
| Veto HV Monitor | 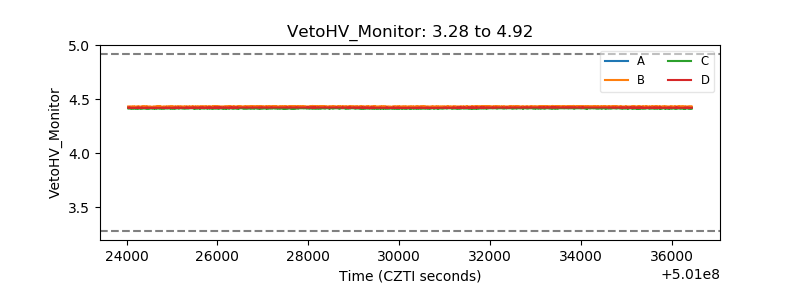 |
| Veto LLD | 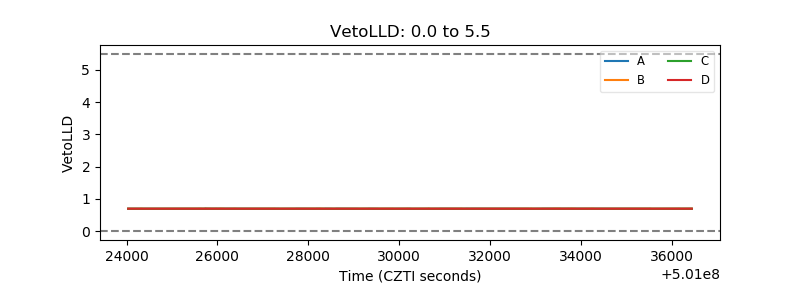 |
| Alpha Counter | 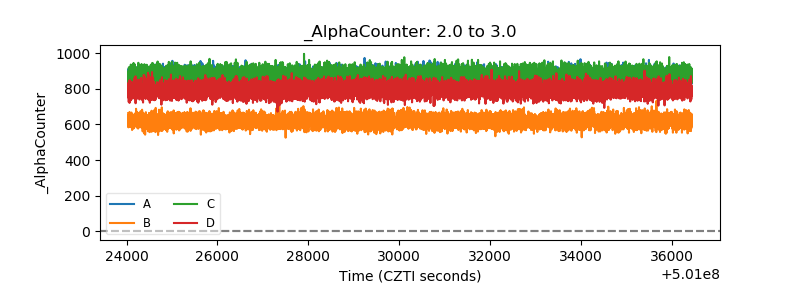 |
| _CPM_Rate | 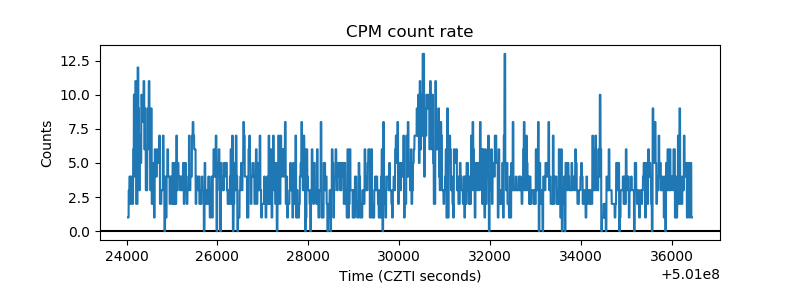 |
| CZT Counter | 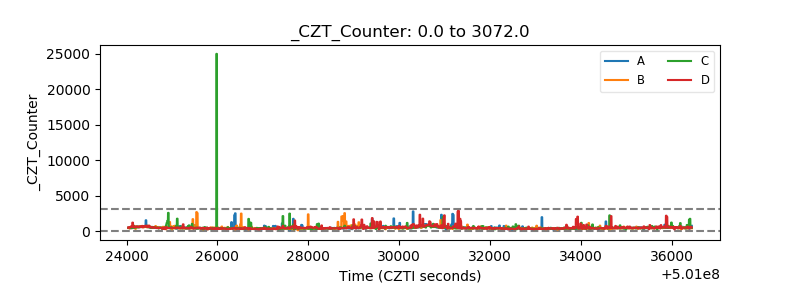 |
| +2.5 Volts monitor |  |
| +5 Volts monitor | 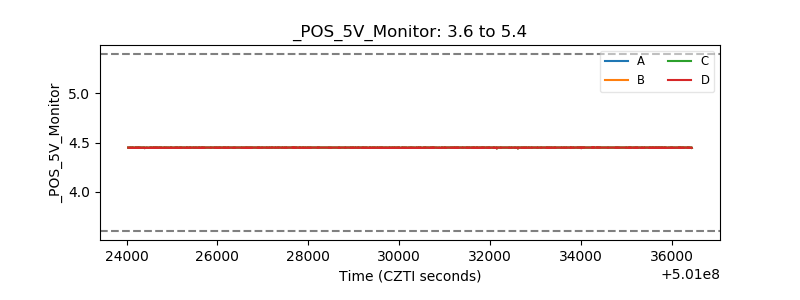 |
| _ROLL_ROT | 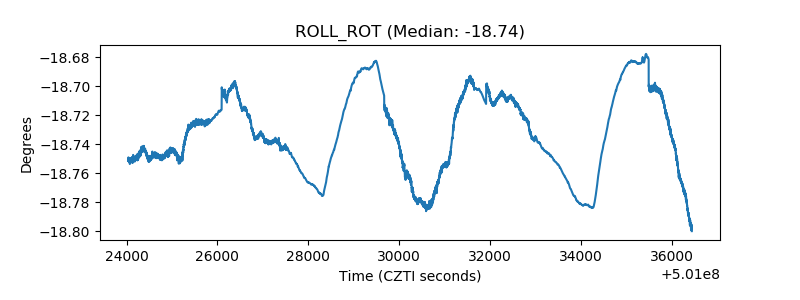 |
| _Roll_DEC | 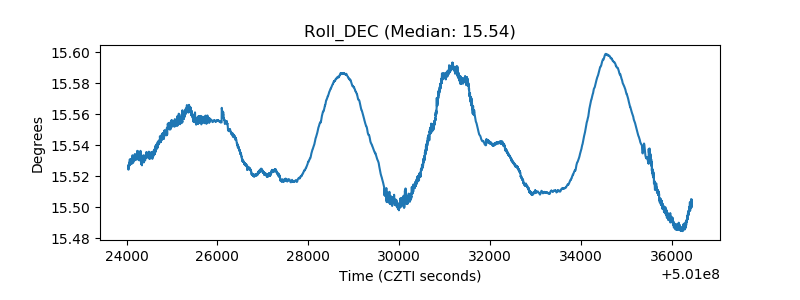 |
| _Roll_RA | 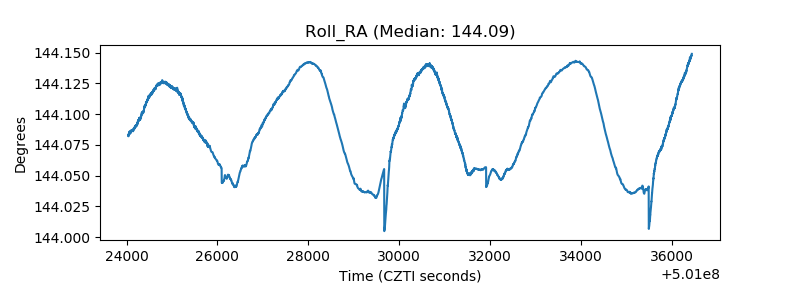 |
| Veto Counter | 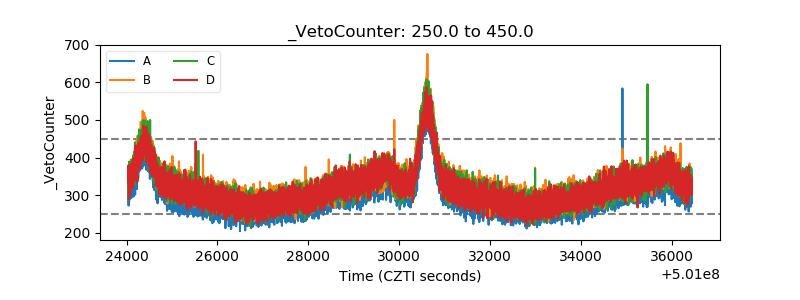 |