| Param | Original file | Final file |
|---|---|---|
| Filename | modeM0/AS1A14_039T06_9000006526_54845cztM0_level2.fits | modeM0/AS1A14_039T06_9000006526_54845cztM0_level2_quad_clean.evt |
| Size (bytes) | 802,491,840 | 192,588,480 |
| Size | 765.3 MB | 183.7 MB |
| Events in quadrant A | 6,427,346 | 1,261,601 |
| Events in quadrant B | 6,343,227 | 1,347,353 |
| Events in quadrant C | 8,492,340 | 1,139,410 |
| Events in quadrant D | 7,376,487 | 1,133,615 |
| Mode M9 | |||
|---|---|---|---|
| Quadrant | BADHDUFLAG | Total packets | Discarded packets |
| A | 0 | 16 | 0 |
| B | 0 | 16 | 0 |
| C | 0 | 16 | 0 |
| D | 0 | 16 | 0 |
| Mode M0 | |||
|---|---|---|---|
| Quadrant | BADHDUFLAG | Total packets | Discarded packets |
| A | 0 | 30087 | 64 |
| B | 0 | 29454 | 56 |
| C | 0 | 35764 | 75 |
| D | 0 | 32421 | 107 |
| Mode SS | |||
|---|---|---|---|
| Quadrant | BADHDUFLAG | Total packets | Discarded packets |
| A | 0 | 282 | 0 |
| B | 0 | 282 | 0 |
| C | 0 | 282 | 0 |
| D | 0 | 282 | 0 |
| Quadrant | Total seconds | Saturated seconds | Saturation percentage |
|---|---|---|---|
| A | 13741 | 259 | 1.884870% |
| B | 13743 | 201 | 1.462563% |
| C | 13738 | 671 | 4.884263% |
| D | 13738 | 258 | 1.878003% |
Noise dominated data is calculated using 1-second bins in cleaned event files. If a bin has >2000 counts, and if more than 50% of those come from <1% of pixels, then it is considered to be noise-dominated and hence unusable.
| Quadrant | # 1 sec bins | Bins with >0 counts | Bins with >2000 counts | High rate bins dominated by noise | Noise dominated (total time) | Noise dominated (detector-on time) | Marked lightcurve |
|---|---|---|---|---|---|---|---|
| A | 15333 | 13749 | 120 | 120 | 0.78% | 0.87% | 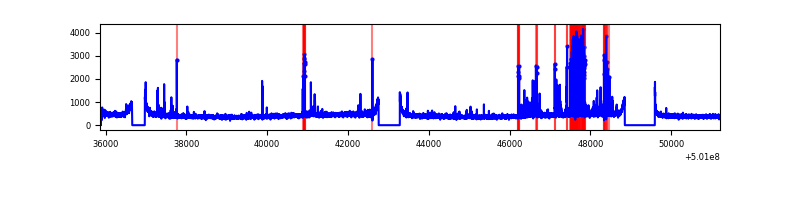 |
| B | 15340 | 13751 | 23 | 23 | 0.15% | 0.17% | 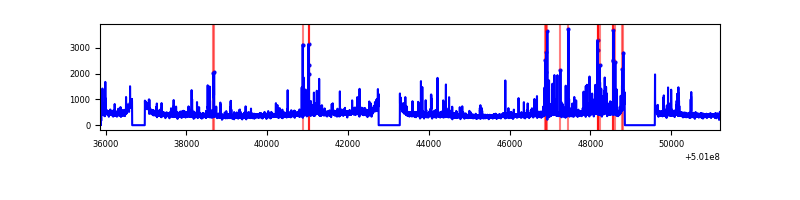 |
| C | 15331 | 13746 | 651 | 651 | 4.25% | 4.74% | 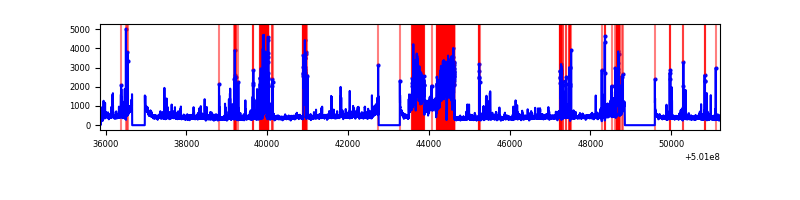 |
| D | 15338 | 13750 | 181 | 181 | 1.18% | 1.32% | 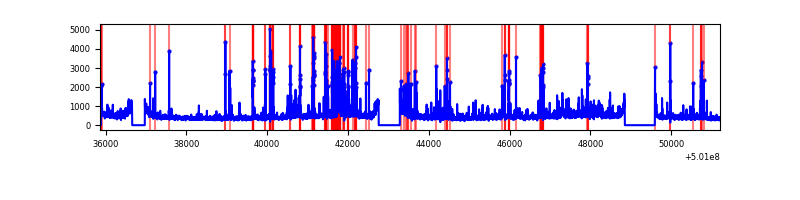 |
Top three noisy pixels from each quadrant. If the there are fewer than three noisy pixels in the level2.evt file, extra rows are filled as -1
| Pixel properties | Quadrant properties | ||||||
|---|---|---|---|---|---|---|---|
| Quadrant | DetID | PixID | Counts | Sigma | Mean | Median | Sigma |
| A | 13 | 248 | 514064 | 1421.21 | 1443 | 1408 | 360.7 |
| A | 8 | 206 | 139694 | 383.36 | 1443 | 1408 | 360.7 |
| A | 3 | 14 | 63093 | 171.01 | 1443 | 1408 | 360.7 |
| B | 5 | 185 | 169633 | 541.57 | 1426 | 1369 | 310.7 |
| B | 2 | 249 | 161432 | 515.18 | 1426 | 1369 | 310.7 |
| B | 7 | 0 | 105069 | 333.77 | 1426 | 1369 | 310.7 |
| C | 4 | 5 | 1575780 | 4159.15 | 1382 | 1371 | 378.5 |
| C | 12 | 252 | 512296 | 1349.72 | 1382 | 1371 | 378.5 |
| C | 12 | 250 | 211650 | 555.5 | 1382 | 1371 | 378.5 |
| D | 3 | 12 | 439602 | 1104.81 | 1392 | 1331 | 396.7 |
| D | 8 | 160 | 206079 | 516.14 | 1392 | 1331 | 396.7 |
| D | 14 | 52 | 180582 | 451.86 | 1392 | 1331 | 396.7 |
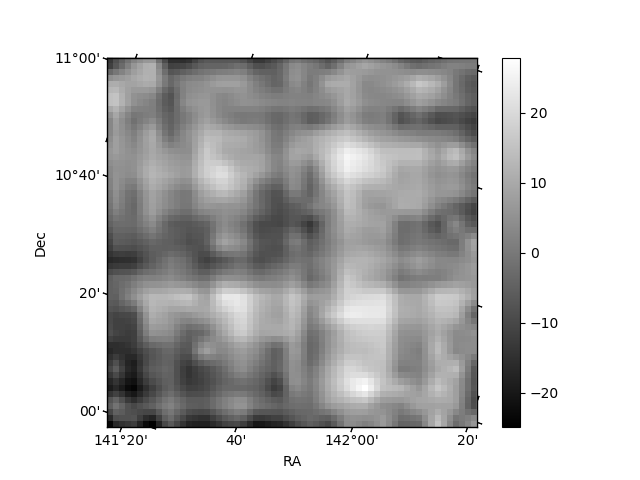
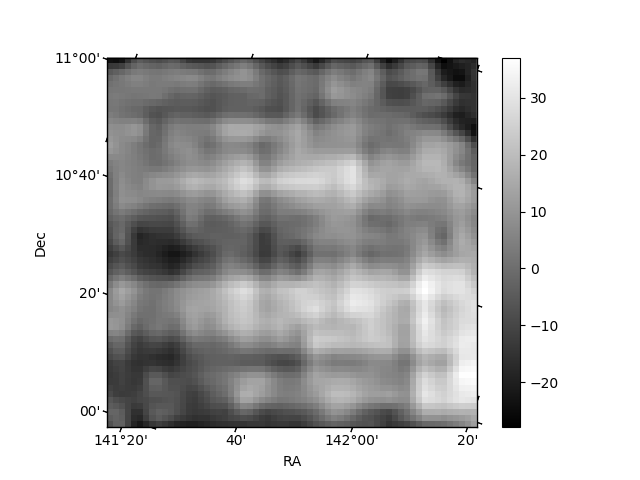
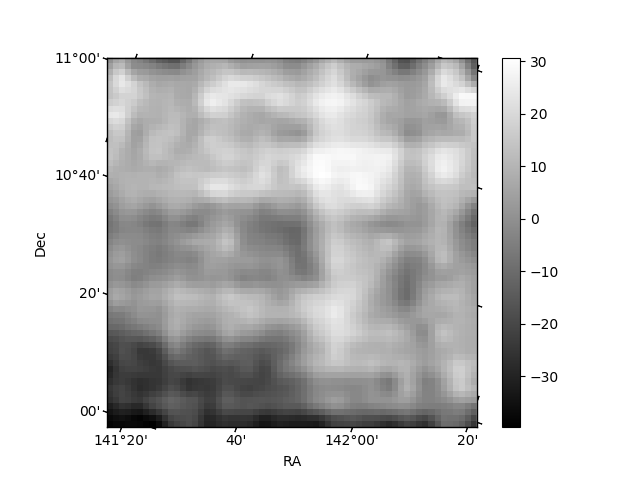
Histogram calculated using DETX and DETY for each event in the final _common_clean file
| Quadrant A | 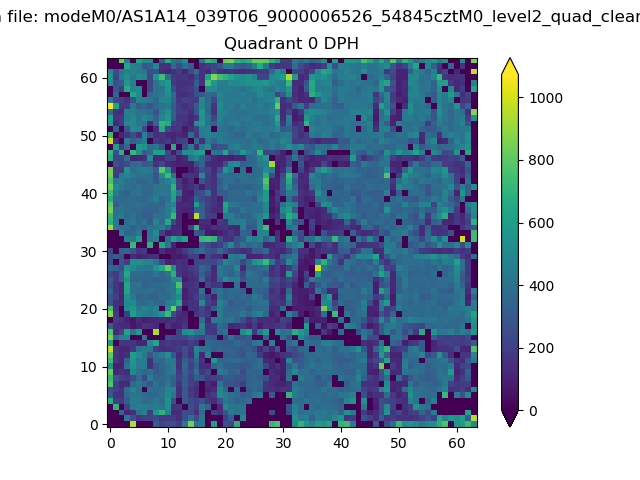 |
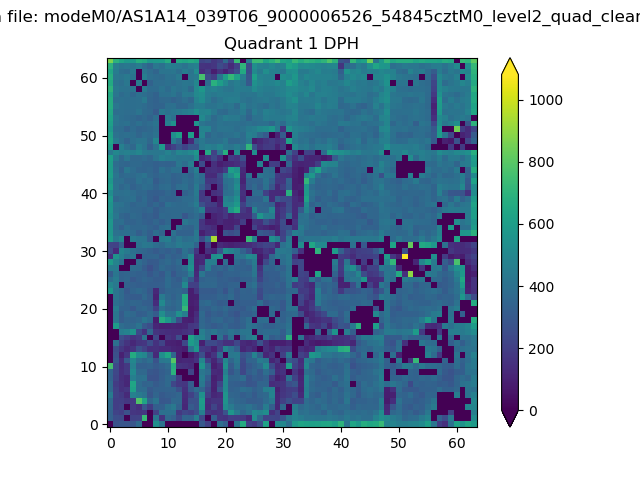 |
Quadrant B |
|---|---|---|---|
| Quadrant D |  |
 |
Quadrant C |
| Plot type | Count rate plots | Images |
|---|---|---|
| Comparison with Poisson distribution Blue bars denote a histogram of data divided into 1 sec bins. Red curve is a Poisson curve with rate = median count rate of data. |
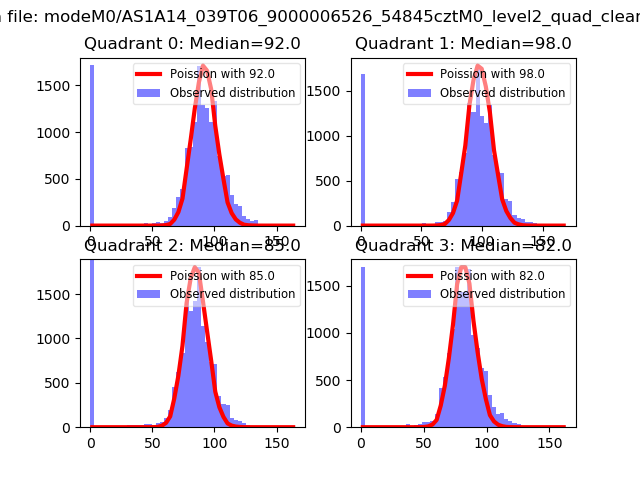 |
 |
| Quadrant-wise count rates Data is divided into 100 sec bins |
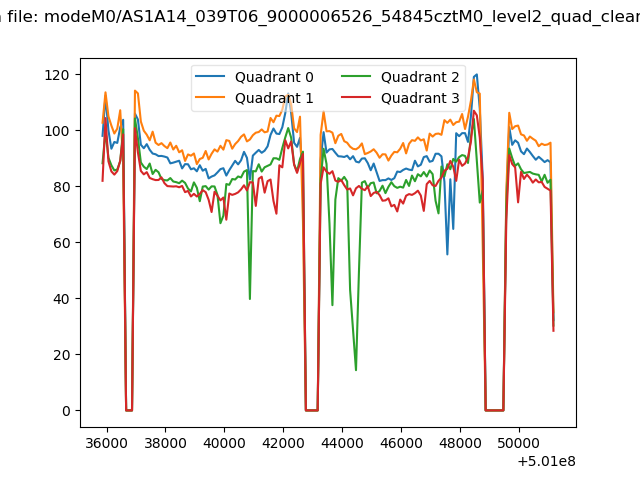 |
|
| Module-wise count rates for Quadrant A Data is divided into 100 sec bins |
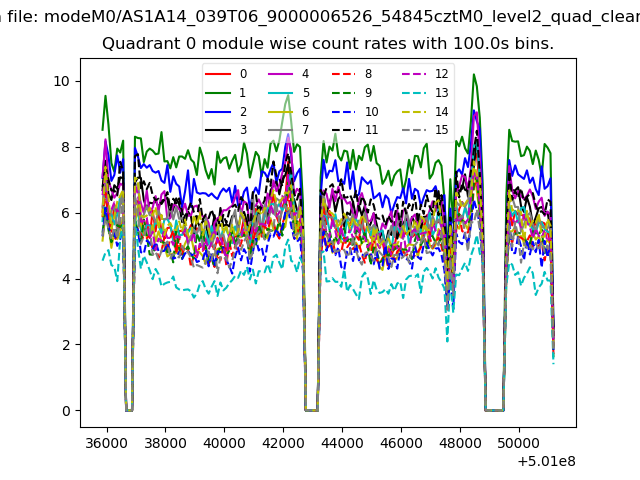 |
 |
| Module-wise count rates for Quadrant B Data is divided into 100 sec bins |
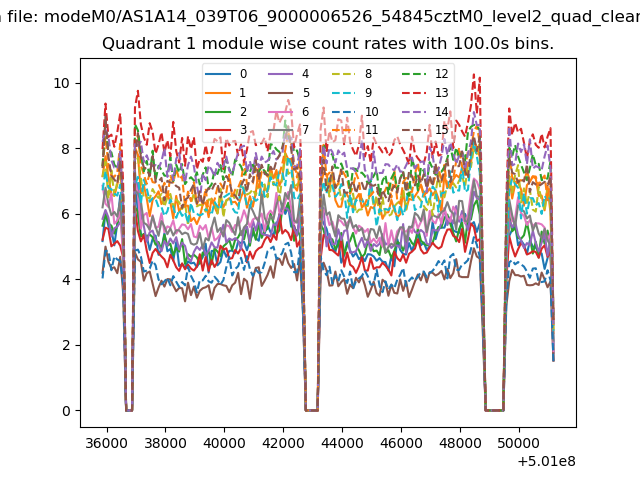 |
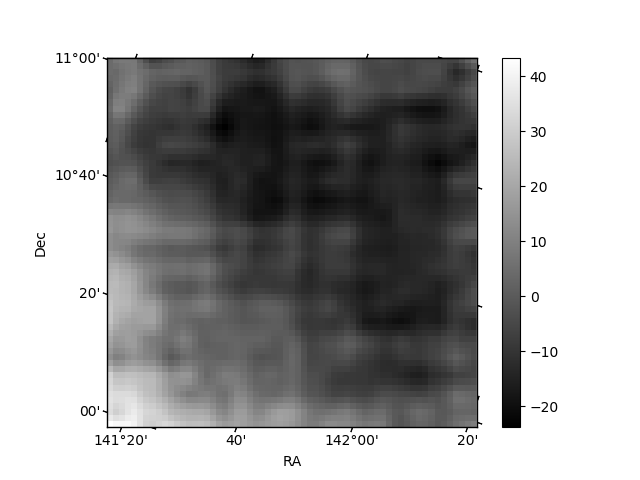 |
| Module-wise count rates for Quadrant C Data is divided into 100 sec bins |
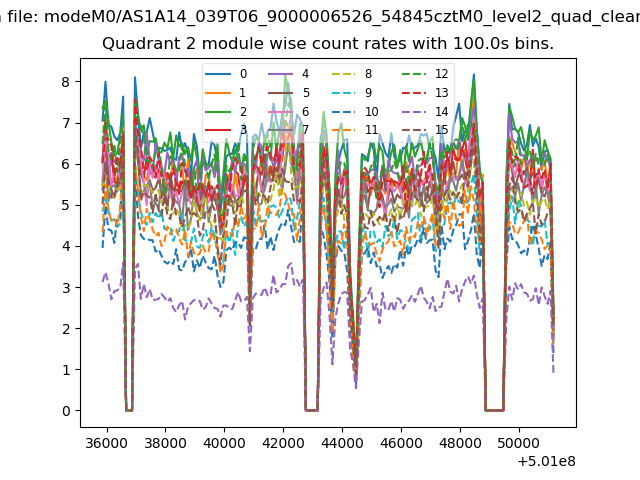 |
 |
| Module-wise count rates for Quadrant D Data is divided into 100 sec bins |
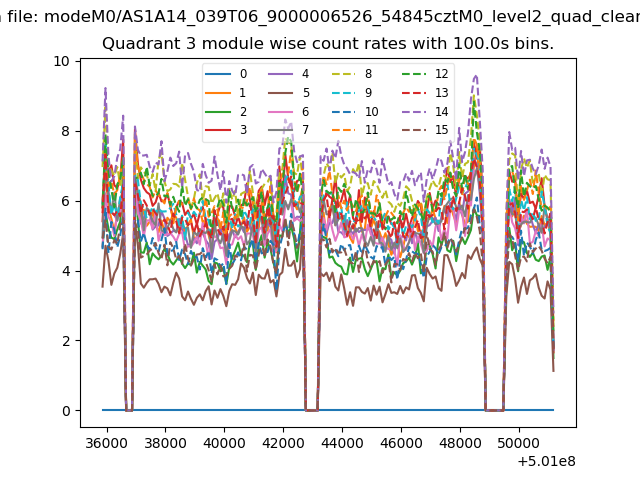 |
 |
| Parameter | Plot |
|---|---|
| CZT HV Monitor | 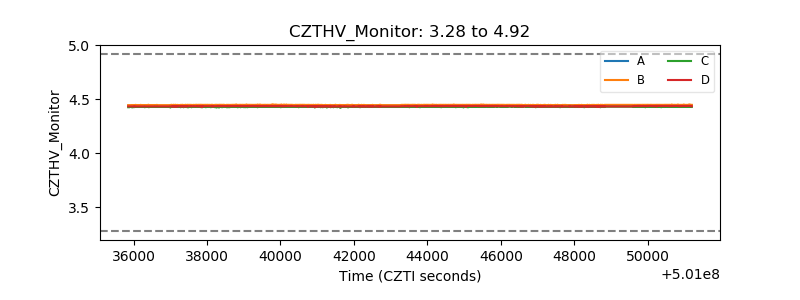 |
| D_VDD | 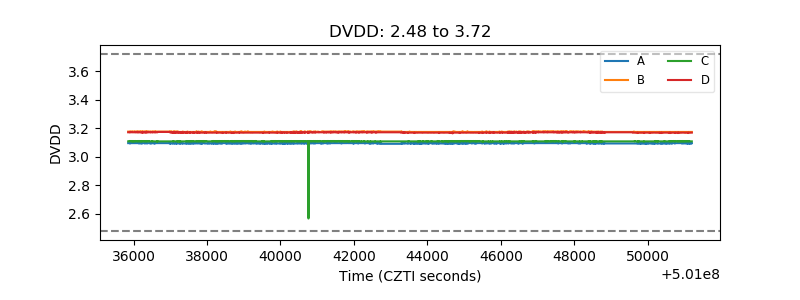 |
| Temperature 1 | 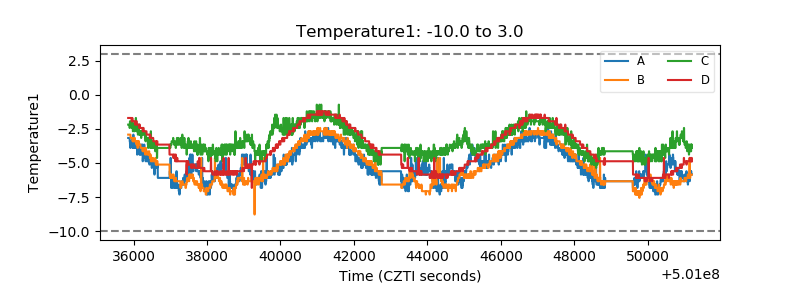 |
| Veto HV Monitor | 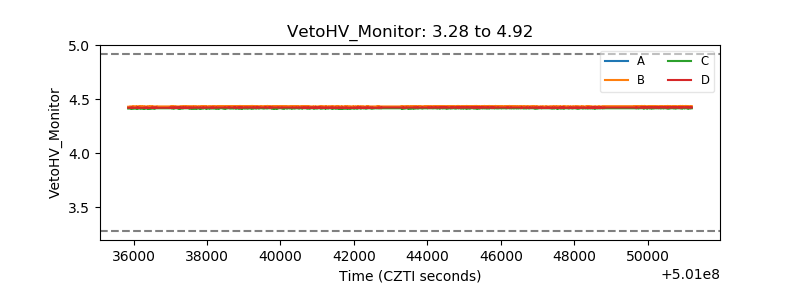 |
| Veto LLD | 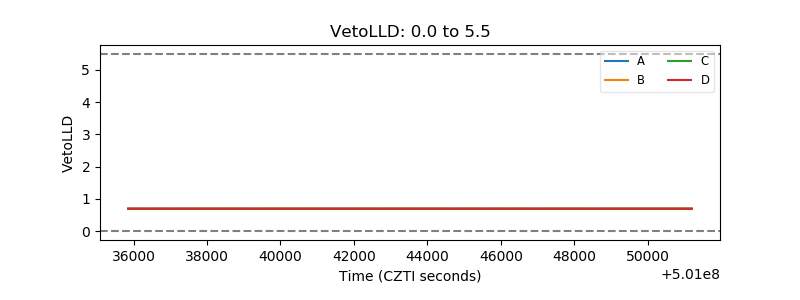 |
| Alpha Counter | 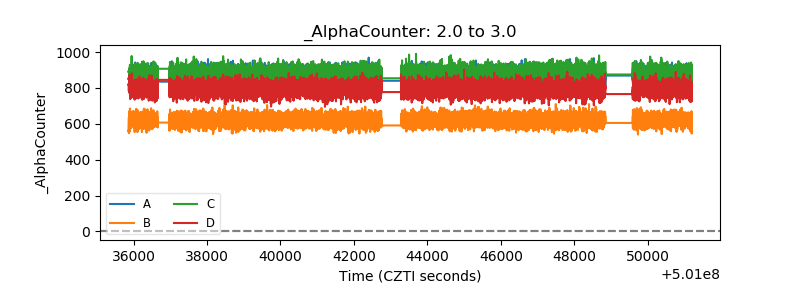 |
| _CPM_Rate | 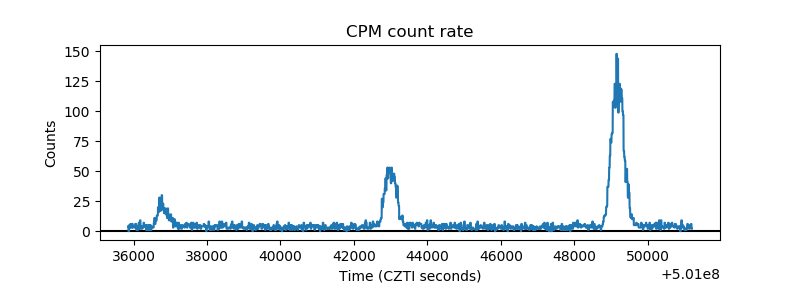 |
| CZT Counter |  |
| +2.5 Volts monitor |  |
| +5 Volts monitor | 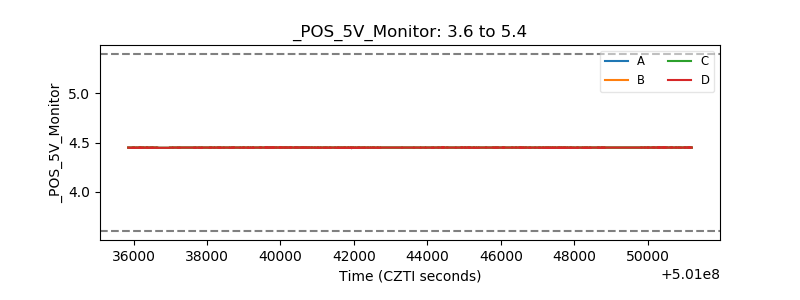 |
| _ROLL_ROT | 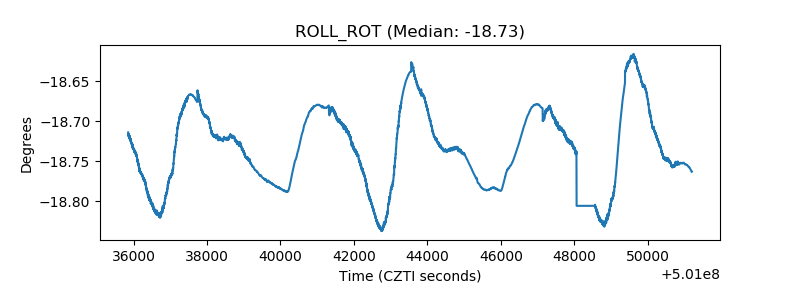 |
| _Roll_DEC | 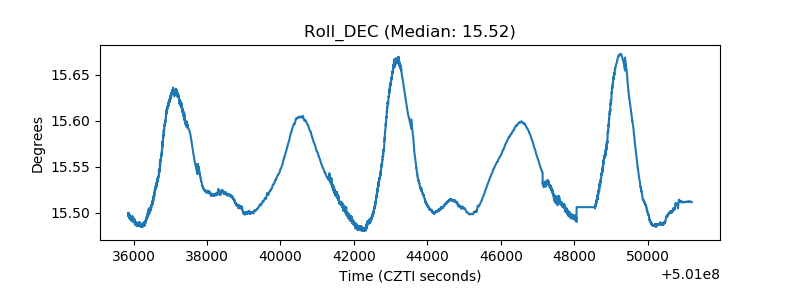 |
| _Roll_RA | 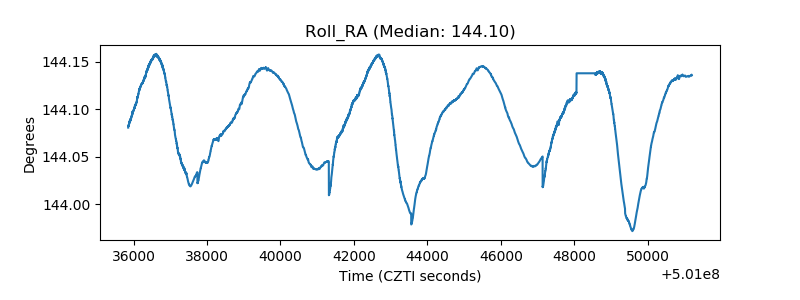 |
| Veto Counter | 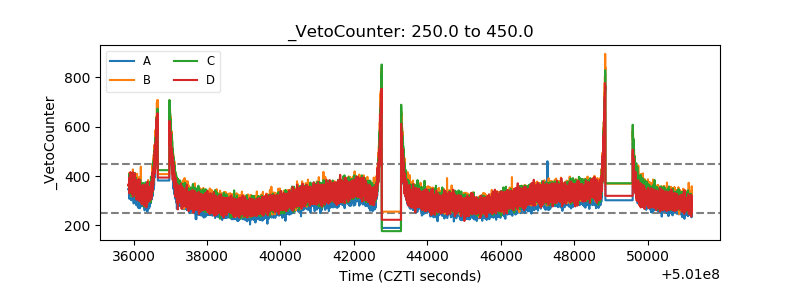 |