| Param | Original file | Final file |
|---|---|---|
| Filename | modeM0/AS1A14_039T06_9000006526_54848cztM0_level2.fits | modeM0/AS1A14_039T06_9000006526_54848cztM0_level2_quad_clean.evt |
| Size (bytes) | 420,065,280 | 83,566,080 |
| Size | 400.6 MB | 79.7 MB |
| Events in quadrant A | 2,674,317 | 568,319 |
| Events in quadrant B | 5,515,073 | 499,121 |
| Events in quadrant C | 2,974,683 | 540,327 |
| Events in quadrant D | 3,913,666 | 499,357 |
| Mode M9 | |||
|---|---|---|---|
| Quadrant | BADHDUFLAG | Total packets | Discarded packets |
| A | 0 | 9 | 0 |
| B | 0 | 9 | 0 |
| C | 0 | 9 | 0 |
| D | 0 | 9 | 0 |
| Mode M0 | |||
|---|---|---|---|
| Quadrant | BADHDUFLAG | Total packets | Discarded packets |
| A | 0 | 12600 | 1 |
| B | 0 | 20952 | 3 |
| C | 0 | 13450 | 1 |
| D | 0 | 16055 | 1 |
| Mode SS | |||
|---|---|---|---|
| Quadrant | BADHDUFLAG | Total packets | Discarded packets |
| A | 0 | 124 | 0 |
| B | 0 | 124 | 0 |
| C | 0 | 124 | 0 |
| D | 0 | 124 | 0 |
| Quadrant | Total seconds | Saturated seconds | Saturation percentage |
|---|---|---|---|
| A | 6059 | 93 | 1.534907% |
| B | 6058 | 1119 | 18.471443% |
| C | 6058 | 102 | 1.683724% |
| D | 6059 | 216 | 3.564945% |
Noise dominated data is calculated using 1-second bins in cleaned event files. If a bin has >2000 counts, and if more than 50% of those come from <1% of pixels, then it is considered to be noise-dominated and hence unusable.
| Quadrant | # 1 sec bins | Bins with >0 counts | Bins with >2000 counts | High rate bins dominated by noise | Noise dominated (total time) | Noise dominated (detector-on time) | Marked lightcurve |
|---|---|---|---|---|---|---|---|
| A | 7014 | 6060 | 12 | 12 | 0.17% | 0.20% | 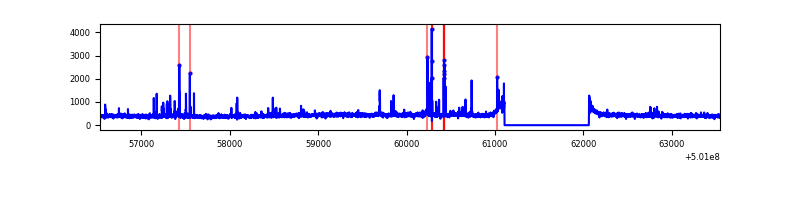 |
| B | 7013 | 6059 | 938 | 938 | 13.38% | 15.48% | 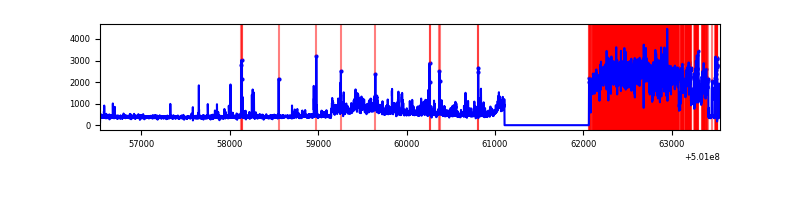 |
| C | 7013 | 6059 | 42 | 42 | 0.60% | 0.69% | 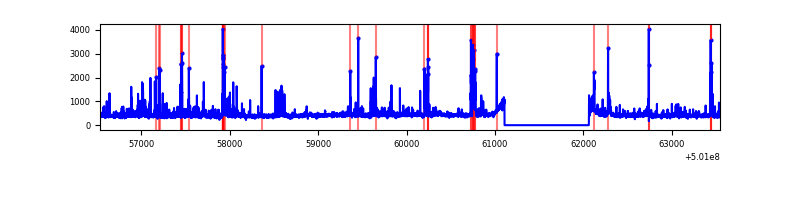 |
| D | 7014 | 6060 | 171 | 171 | 2.44% | 2.82% | 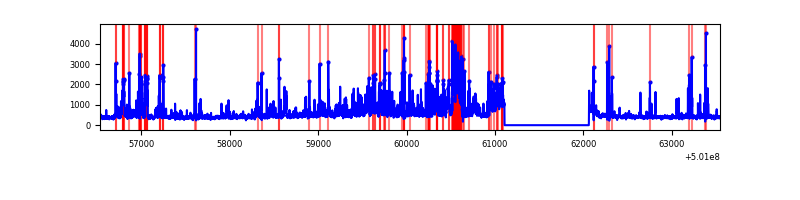 |
Top three noisy pixels from each quadrant. If the there are fewer than three noisy pixels in the level2.evt file, extra rows are filled as -1
| Pixel properties | Quadrant properties | ||||||
|---|---|---|---|---|---|---|---|
| Quadrant | DetID | PixID | Counts | Sigma | Mean | Median | Sigma |
| A | 8 | 206 | 59244 | 364.47 | 641 | 624 | 160.8 |
| A | 4 | 13 | 36880 | 225.42 | 641 | 624 | 160.8 |
| A | 3 | 14 | 28596 | 173.92 | 641 | 624 | 160.8 |
| B | 5 | 172 | 2848663 | 22527.51 | 588 | 567 | 126.4 |
| B | 2 | 249 | 107344 | 844.57 | 588 | 567 | 126.4 |
| B | 10 | 247 | 104108 | 818.98 | 588 | 567 | 126.4 |
| C | 6 | 223 | 196858 | 1145.55 | 619 | 614 | 171.3 |
| C | 12 | 252 | 79802 | 462.25 | 619 | 614 | 171.3 |
| C | 1 | 16 | 61180 | 353.55 | 619 | 614 | 171.3 |
| D | 11 | 129 | 454880 | 2608.94 | 612 | 585 | 174.1 |
| D | 8 | 160 | 297819 | 1706.97 | 612 | 585 | 174.1 |
| D | 3 | 12 | 283399 | 1624.15 | 612 | 585 | 174.1 |
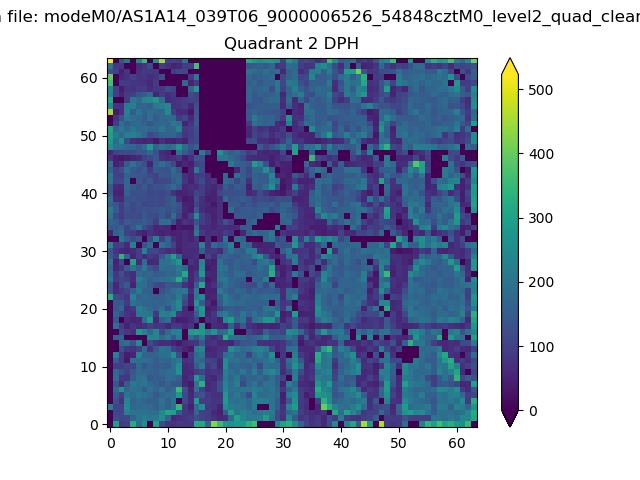
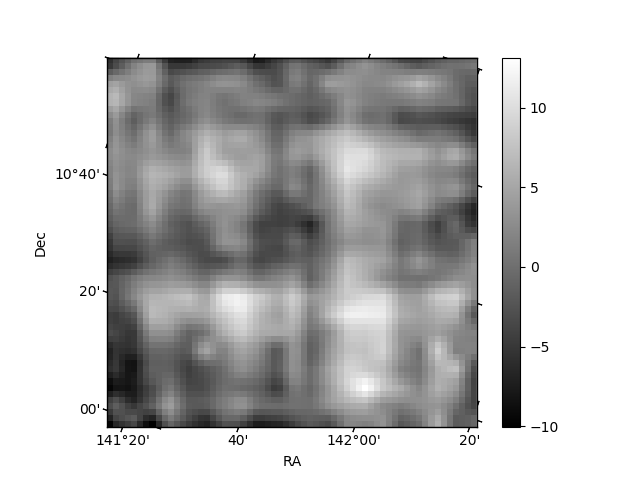
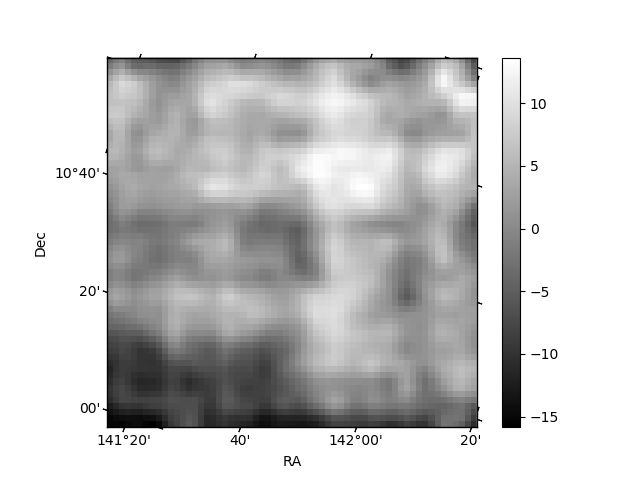
Histogram calculated using DETX and DETY for each event in the final _common_clean file
| Quadrant A | 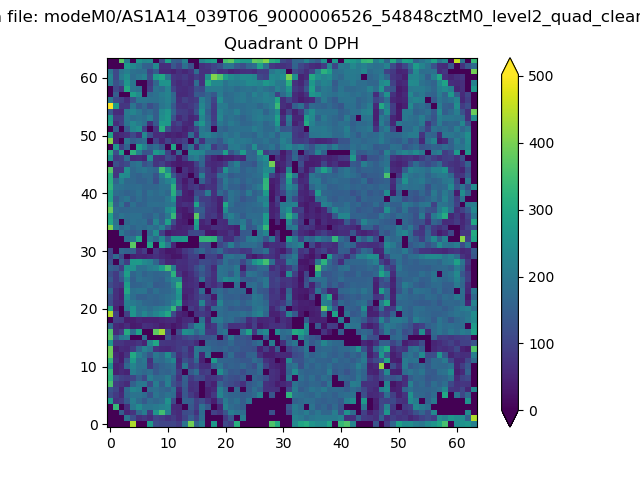 |
 |
Quadrant B |
|---|---|---|---|
| Quadrant D |  |
 |
Quadrant C |
| Plot type | Count rate plots | Images |
|---|---|---|
| Comparison with Poisson distribution Blue bars denote a histogram of data divided into 1 sec bins. Red curve is a Poisson curve with rate = median count rate of data. |
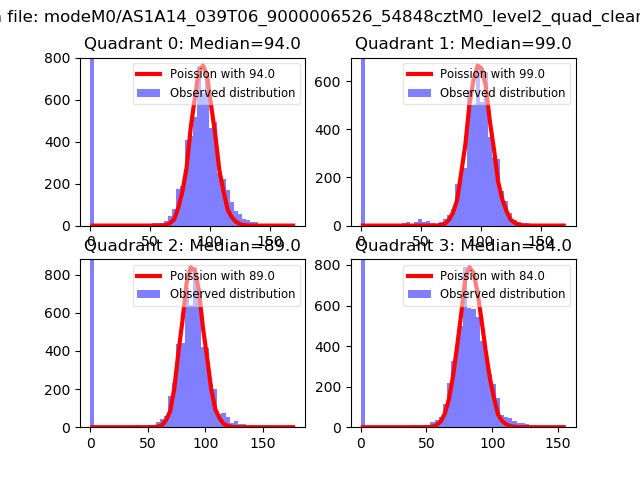 |
 |
| Quadrant-wise count rates Data is divided into 100 sec bins |
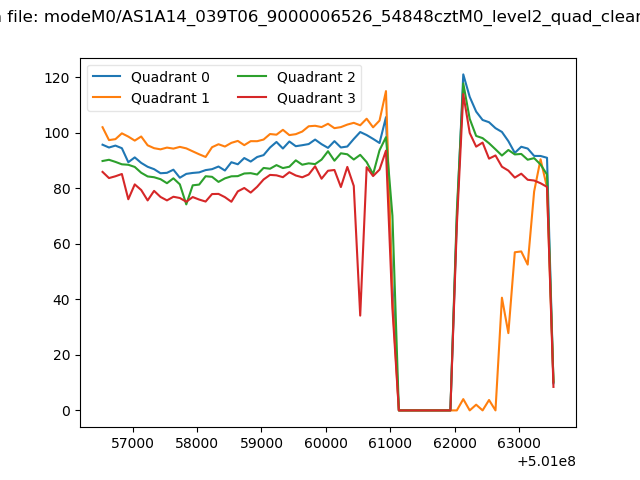 |
|
| Module-wise count rates for Quadrant A Data is divided into 100 sec bins |
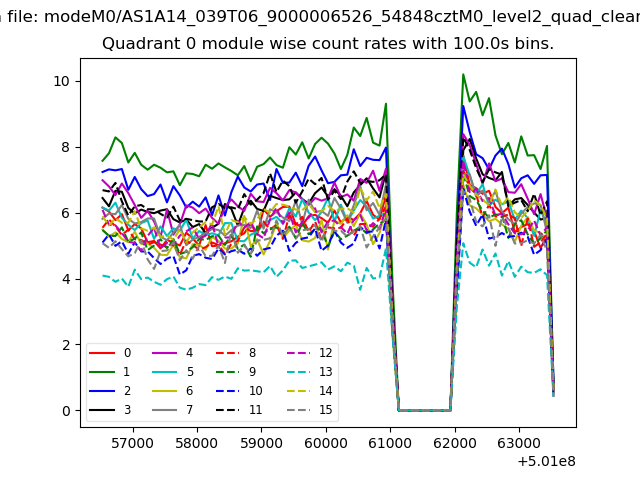 |
 |
| Module-wise count rates for Quadrant B Data is divided into 100 sec bins |
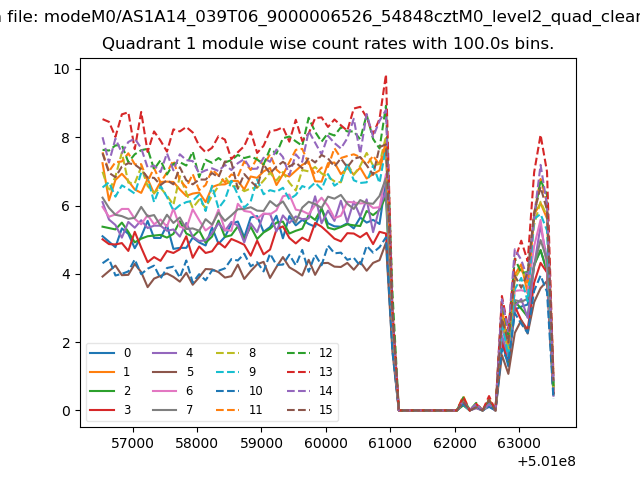 |
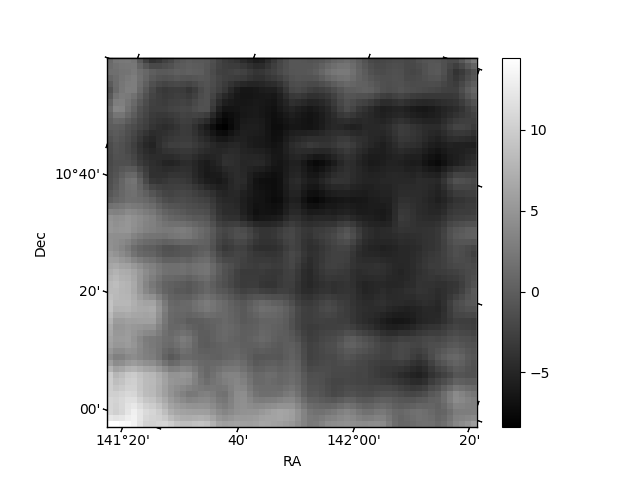 |
| Module-wise count rates for Quadrant C Data is divided into 100 sec bins |
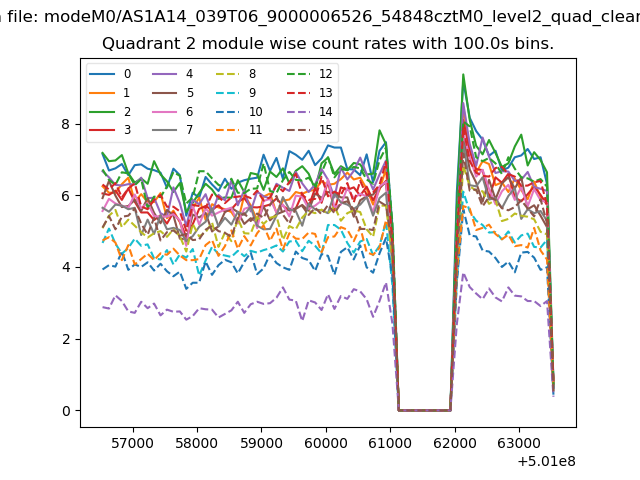 |
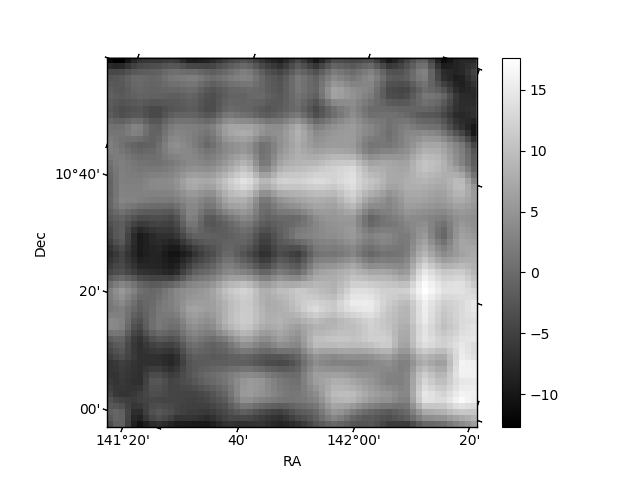 |
| Module-wise count rates for Quadrant D Data is divided into 100 sec bins |
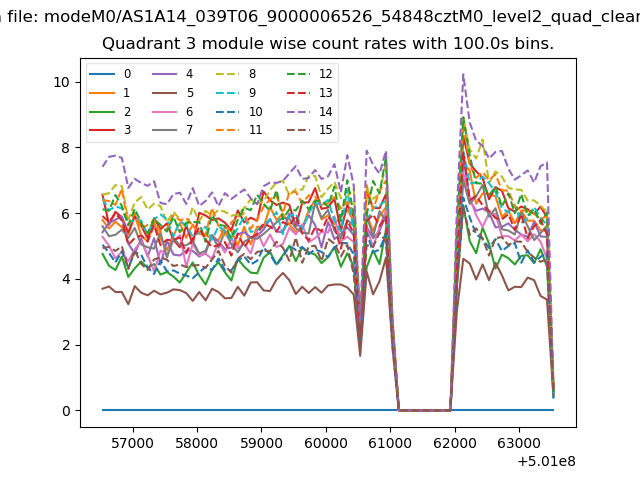 |
 |
| Parameter | Plot |
|---|---|
| CZT HV Monitor | 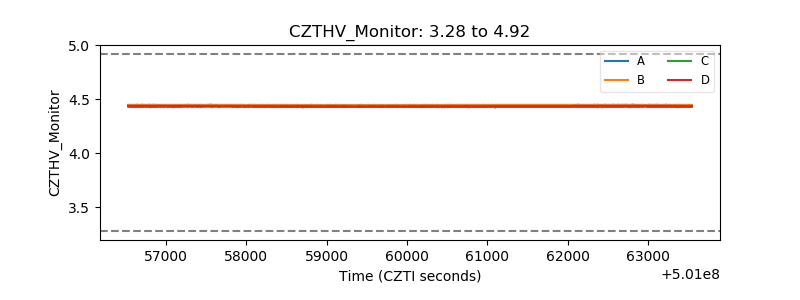 |
| D_VDD | 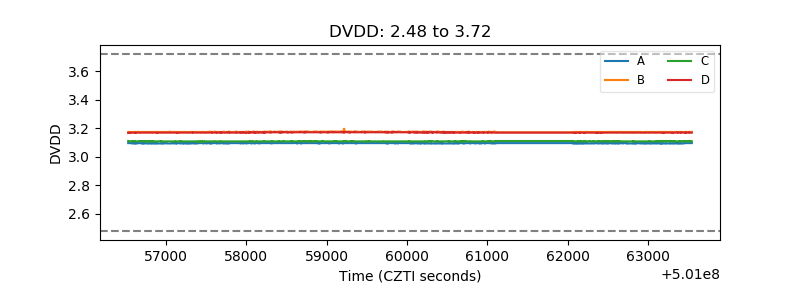 |
| Temperature 1 | 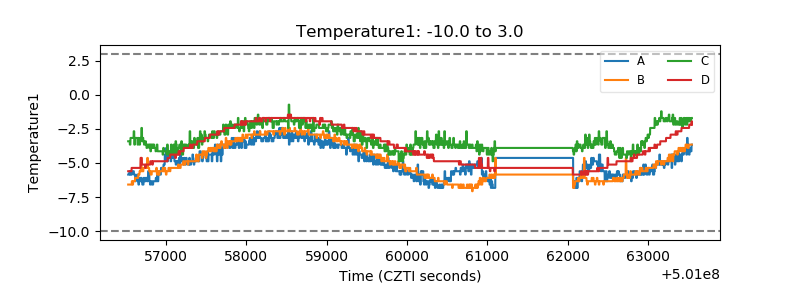 |
| Veto HV Monitor |  |
| Veto LLD | 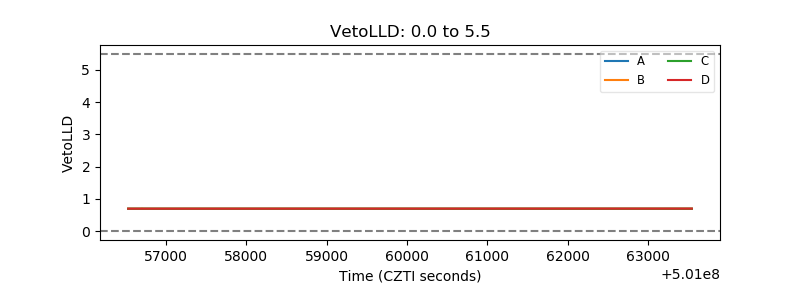 |
| Alpha Counter | 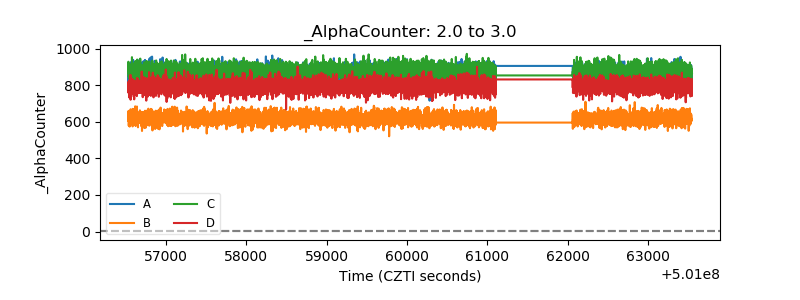 |
| _CPM_Rate | 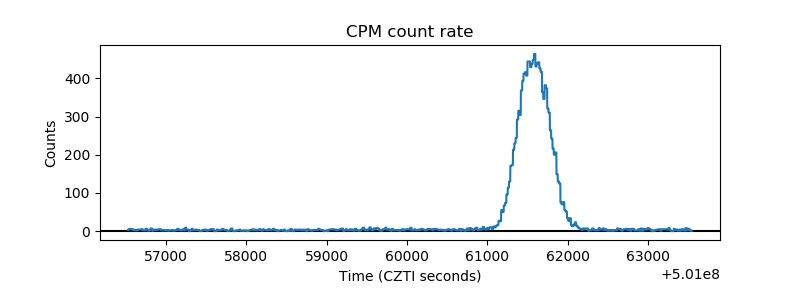 |
| CZT Counter | 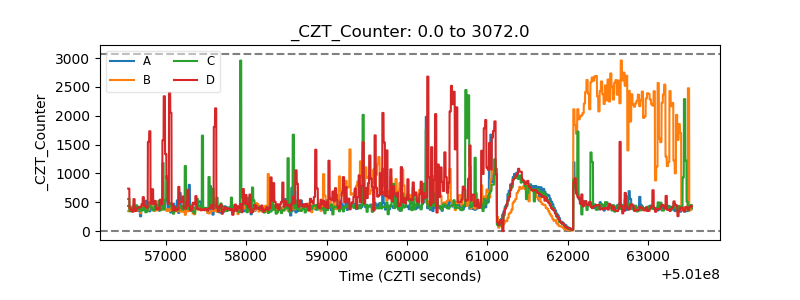 |
| +2.5 Volts monitor |  |
| +5 Volts monitor |  |
| _ROLL_ROT | 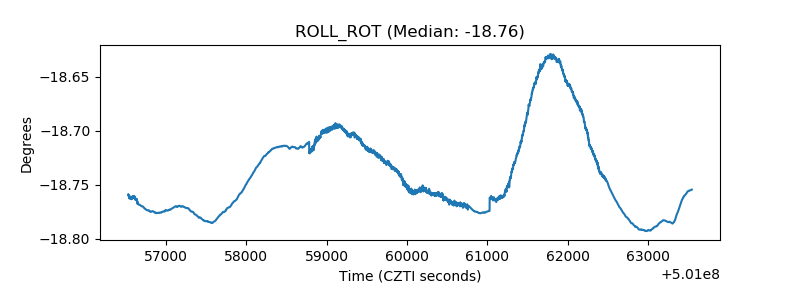 |
| _Roll_DEC | 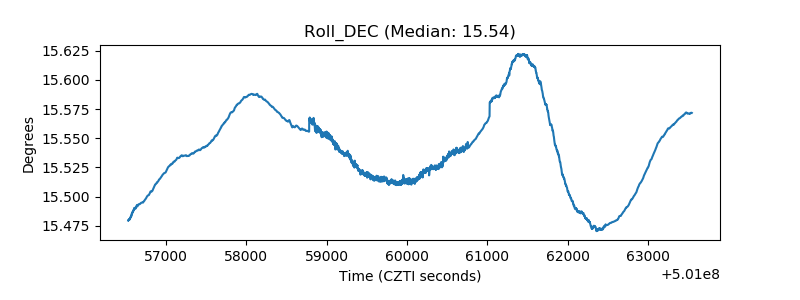 |
| _Roll_RA | 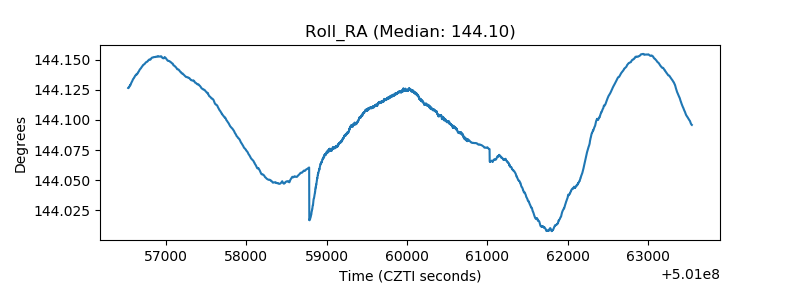 |
| Veto Counter | 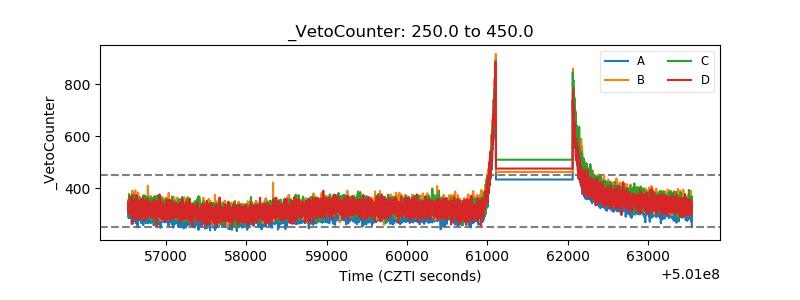 |