| Param | Original file | Final file |
|---|---|---|
| Filename | modeM0/AS1A14_039T06_9000006526_54849cztM0_level2.fits | modeM0/AS1A14_039T06_9000006526_54849cztM0_level2_quad_clean.evt |
| Size (bytes) | 414,950,400 | 81,930,240 |
| Size | 395.7 MB | 78.1 MB |
| Events in quadrant A | 2,629,655 | 559,919 |
| Events in quadrant B | 6,251,754 | 483,600 |
| Events in quadrant C | 2,902,238 | 530,110 |
| Events in quadrant D | 3,121,154 | 498,824 |
| Mode M9 | |||
|---|---|---|---|
| Quadrant | BADHDUFLAG | Total packets | Discarded packets |
| A | 0 | 11 | 0 |
| B | 0 | 11 | 0 |
| C | 0 | 11 | 0 |
| D | 0 | 11 | 0 |
| Mode M0 | |||
|---|---|---|---|
| Quadrant | BADHDUFLAG | Total packets | Discarded packets |
| A | 0 | 12175 | 1 |
| B | 0 | 22717 | 1 |
| C | 0 | 13027 | 1 |
| D | 0 | 13429 | 1 |
| Mode SS | |||
|---|---|---|---|
| Quadrant | BADHDUFLAG | Total packets | Discarded packets |
| A | 0 | 118 | 0 |
| B | 0 | 118 | 0 |
| C | 0 | 118 | 0 |
| D | 0 | 118 | 0 |
| Quadrant | Total seconds | Saturated seconds | Saturation percentage |
|---|---|---|---|
| A | 5844 | 82 | 1.403149% |
| B | 5844 | 1339 | 22.912389% |
| C | 5845 | 120 | 2.053037% |
| D | 5845 | 116 | 1.984602% |
Noise dominated data is calculated using 1-second bins in cleaned event files. If a bin has >2000 counts, and if more than 50% of those come from <1% of pixels, then it is considered to be noise-dominated and hence unusable.
| Quadrant | # 1 sec bins | Bins with >0 counts | Bins with >2000 counts | High rate bins dominated by noise | Noise dominated (total time) | Noise dominated (detector-on time) | Marked lightcurve |
|---|---|---|---|---|---|---|---|
| A | 6914 | 5845 | 13 | 13 | 0.19% | 0.22% | 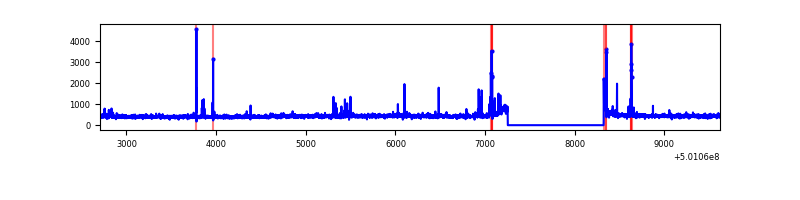 |
| B | 6914 | 5844 | 1104 | 1104 | 15.97% | 18.89% | 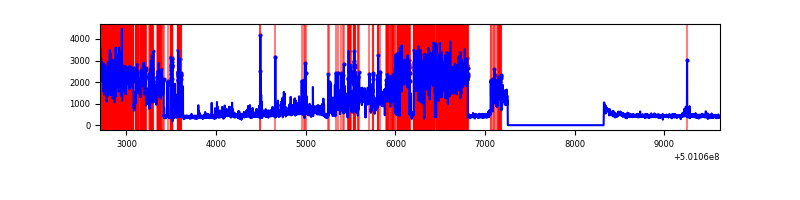 |
| C | 6915 | 5846 | 77 | 77 | 1.11% | 1.32% |  |
| D | 6915 | 5846 | 59 | 59 | 0.85% | 1.01% | 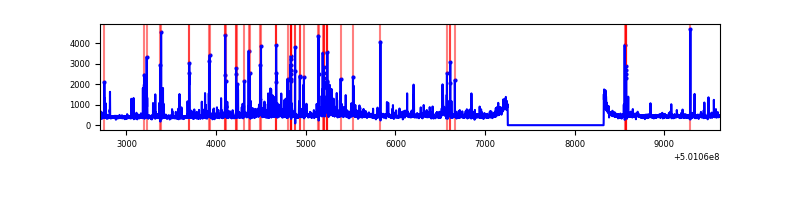 |
Top three noisy pixels from each quadrant. If the there are fewer than three noisy pixels in the level2.evt file, extra rows are filled as -1
| Pixel properties | Quadrant properties | ||||||
|---|---|---|---|---|---|---|---|
| Quadrant | DetID | PixID | Counts | Sigma | Mean | Median | Sigma |
| A | 0 | 8 | 56616 | 360.19 | 631 | 617 | 155.5 |
| A | 3 | 14 | 29445 | 185.43 | 631 | 617 | 155.5 |
| A | 5 | 241 | 24210 | 151.75 | 631 | 617 | 155.5 |
| B | 5 | 172 | 3605532 | 29231.03 | 570 | 547 | 123.3 |
| B | 5 | 185 | 149748 | 1209.8 | 570 | 547 | 123.3 |
| B | 2 | 249 | 112452 | 907.38 | 570 | 547 | 123.3 |
| C | 6 | 223 | 335303 | 2006.37 | 607 | 601 | 166.8 |
| C | 12 | 250 | 37122 | 218.93 | 607 | 601 | 166.8 |
| C | 12 | 252 | 26716 | 156.55 | 607 | 601 | 166.8 |
| D | 10 | 181 | 206278 | 1177.74 | 611 | 583 | 174.7 |
| D | 3 | 12 | 112803 | 642.53 | 611 | 583 | 174.7 |
| D | 14 | 52 | 110994 | 632.17 | 611 | 583 | 174.7 |
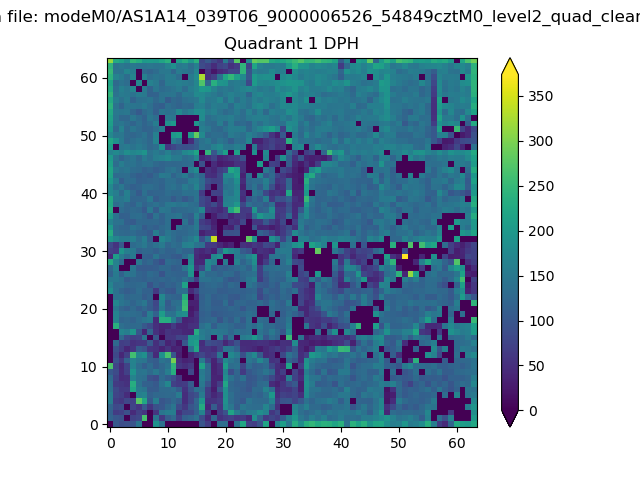
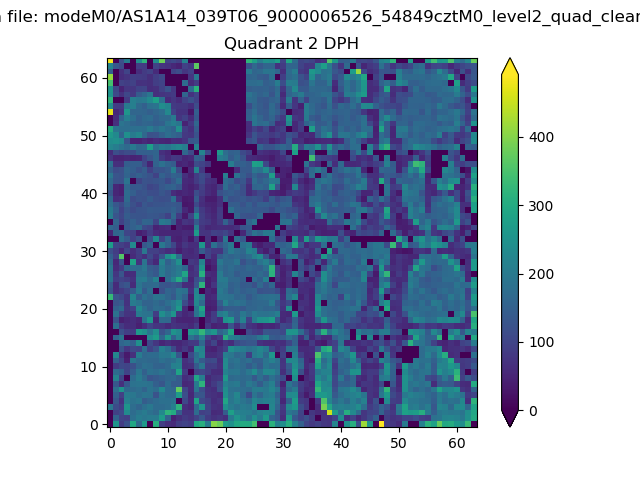
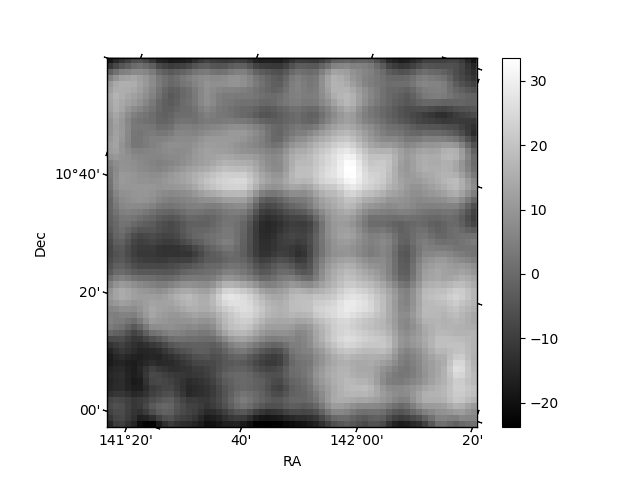
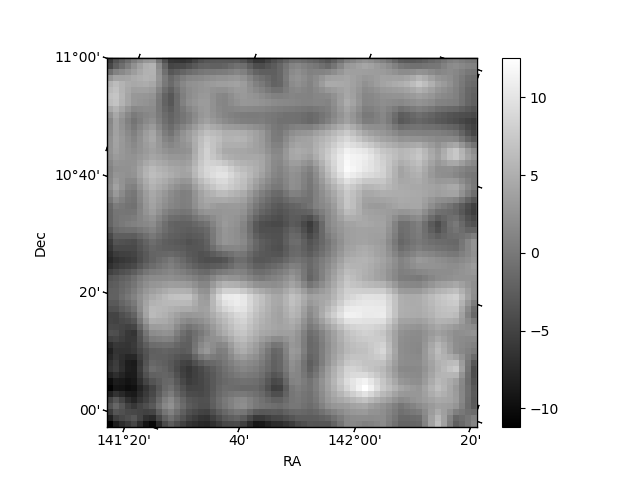
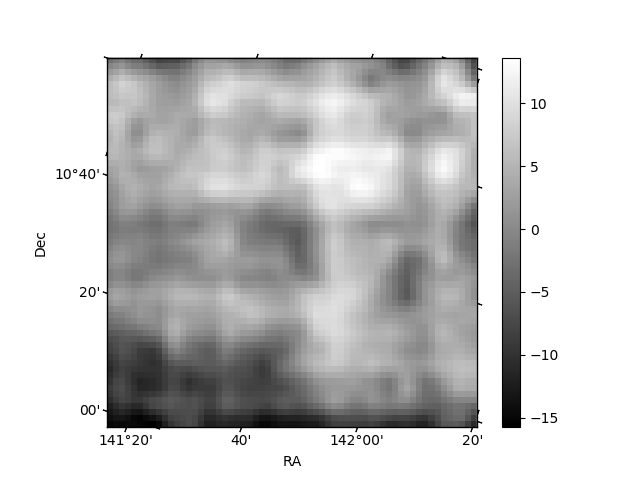
Histogram calculated using DETX and DETY for each event in the final _common_clean file
| Quadrant A | 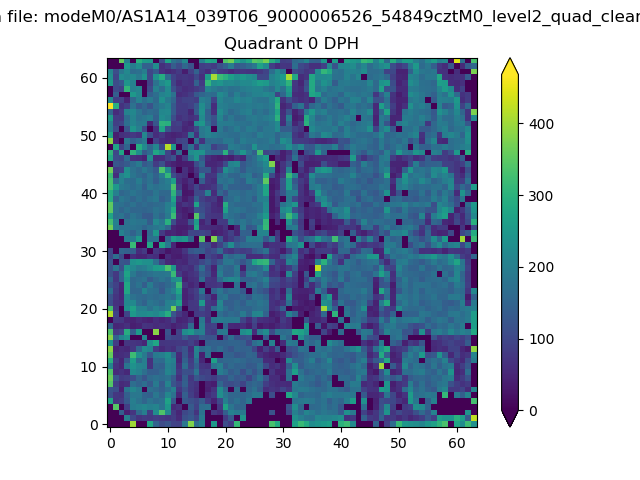 |
 |
Quadrant B |
|---|---|---|---|
| Quadrant D | 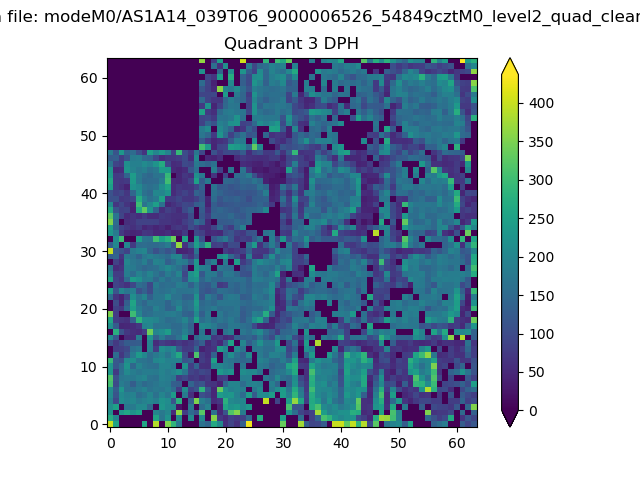 |
 |
Quadrant C |
| Plot type | Count rate plots | Images |
|---|---|---|
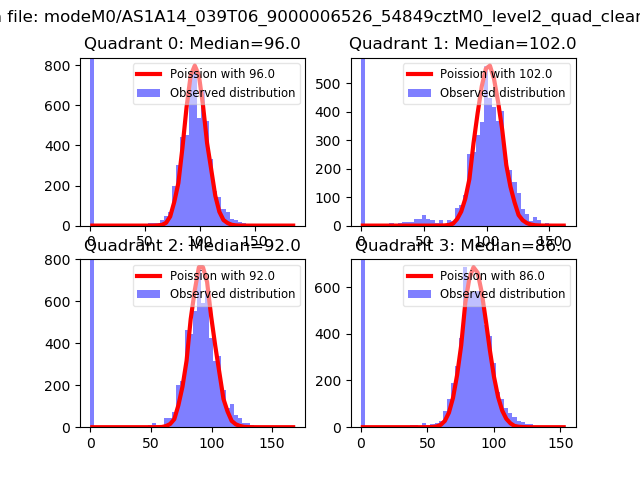
| Comparison with Poisson distribution Blue bars denote a histogram of data divided into 1 sec bins. Red curve is a Poisson curve with rate = median count rate of data. |
 |
 |
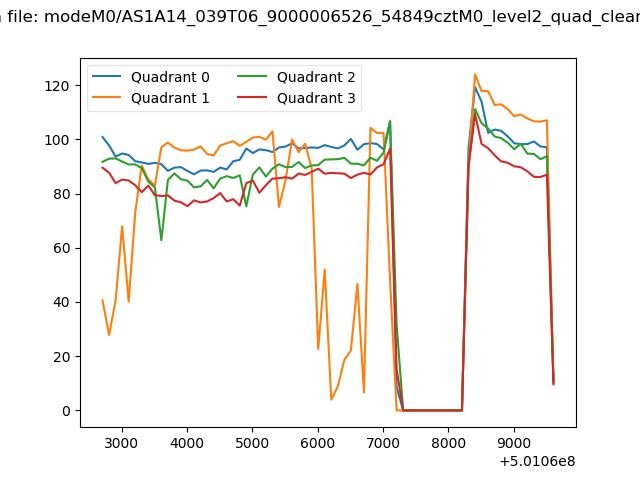
| Quadrant-wise count rates Data is divided into 100 sec bins |
 |
|
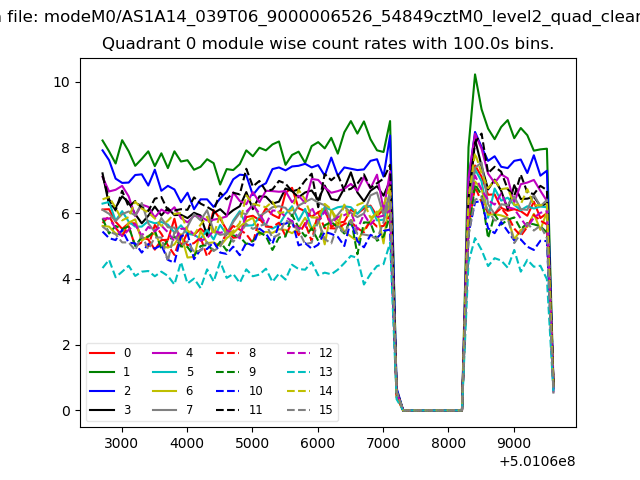
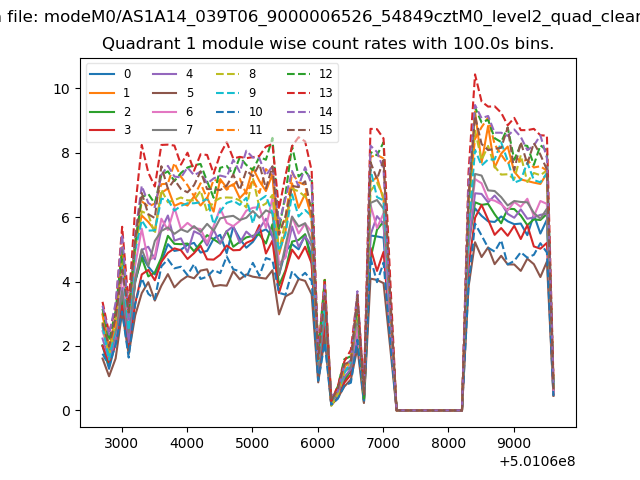
| Module-wise count rates for Quadrant A Data is divided into 100 sec bins |
 |
 |
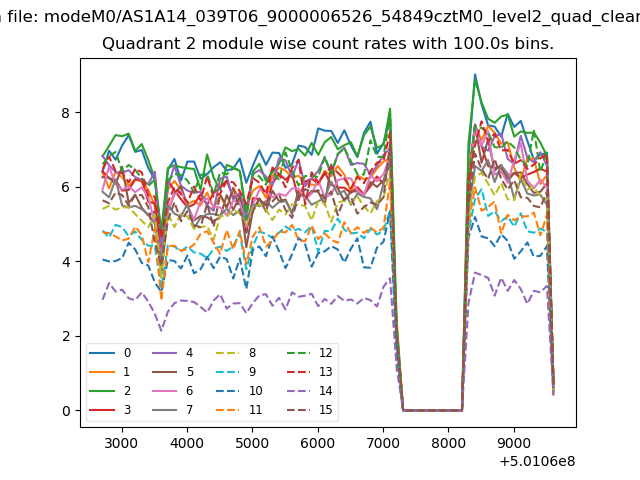
| Module-wise count rates for Quadrant B Data is divided into 100 sec bins |
 |
 |
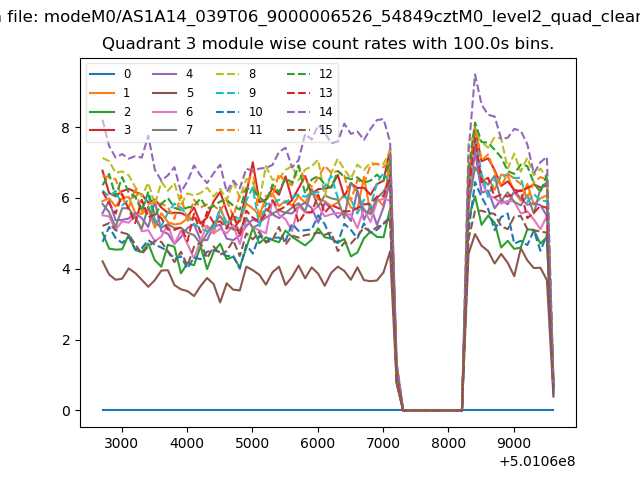
| Module-wise count rates for Quadrant C Data is divided into 100 sec bins |
 |
 |
| Module-wise count rates for Quadrant D Data is divided into 100 sec bins |
 |
 |
| Parameter | Plot |
|---|---|
| CZT HV Monitor | 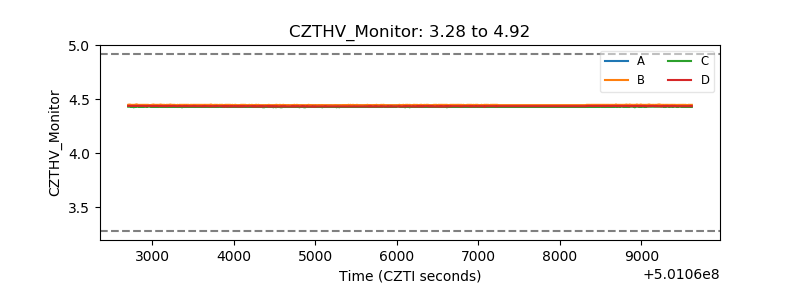 |
| D_VDD | 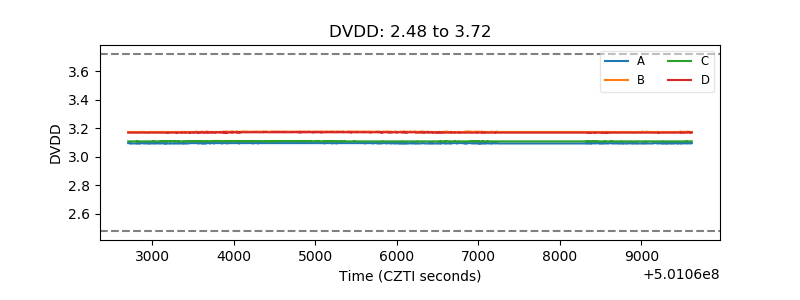 |
| Temperature 1 | 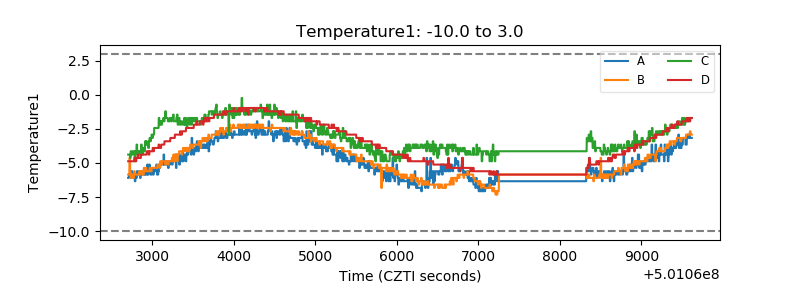 |
| Veto HV Monitor |  |
| Veto LLD | 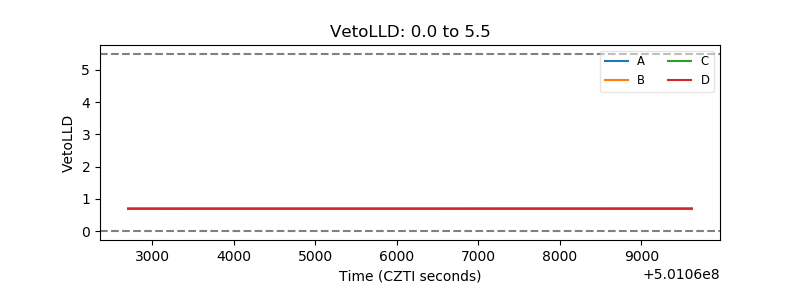 |
| Alpha Counter | 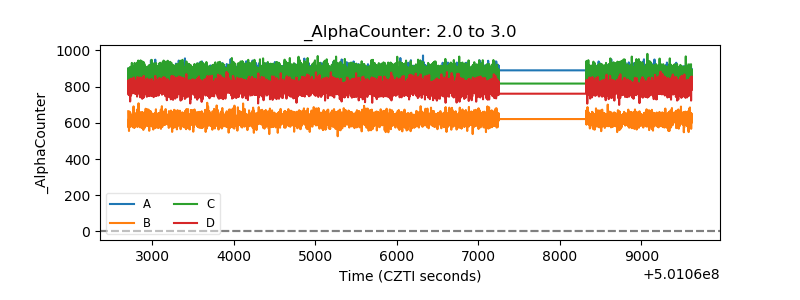 |
| _CPM_Rate | 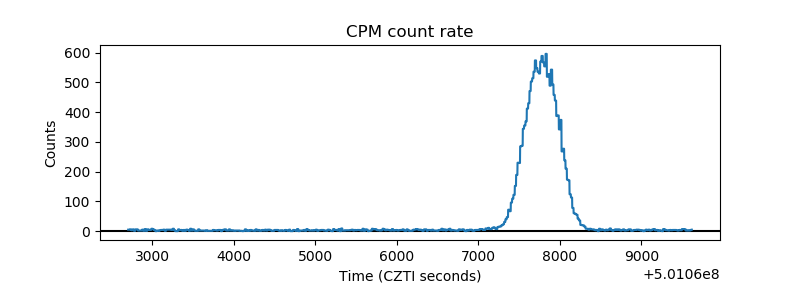 |
| CZT Counter | 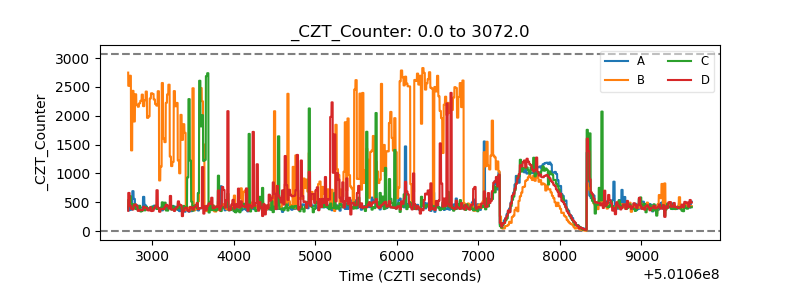 |
| +2.5 Volts monitor |  |
| +5 Volts monitor | 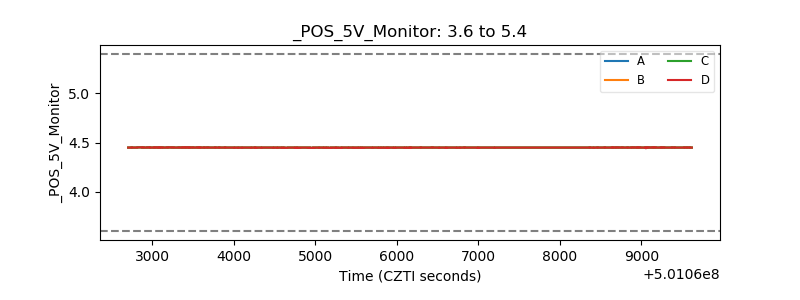 |
| _ROLL_ROT | 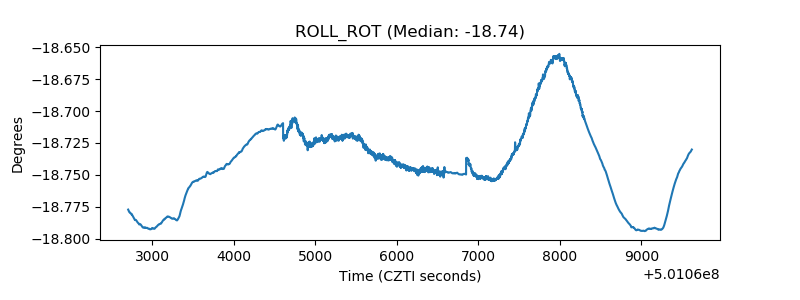 |
| _Roll_DEC | 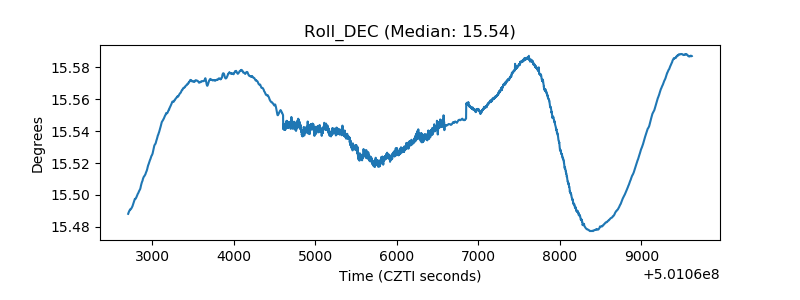 |
| _Roll_RA | 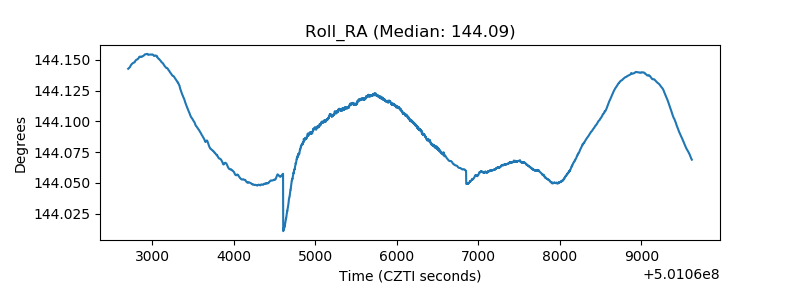 |
| Veto Counter | 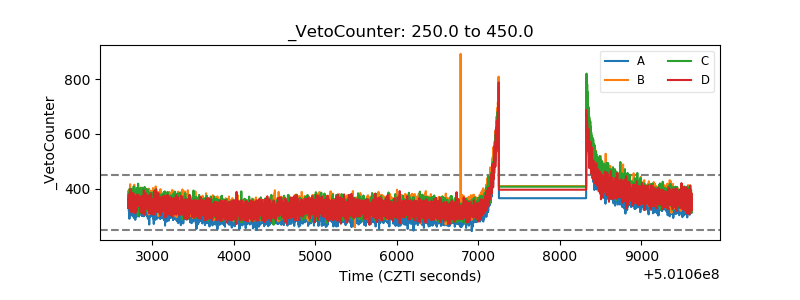 |