| Param | Original file | Final file |
|---|---|---|
| Filename | modeM0/AS1A14_039T06_9000006526_54851cztM0_level2.fits | modeM0/AS1A14_039T06_9000006526_54851cztM0_level2_quad_clean.evt |
| Size (bytes) | 388,788,480 | 97,773,120 |
| Size | 370.8 MB | 93.2 MB |
| Events in quadrant A | 3,003,842 | 642,529 |
| Events in quadrant B | 3,291,537 | 684,148 |
| Events in quadrant C | 3,122,200 | 613,221 |
| Events in quadrant D | 4,465,433 | 564,681 |
| Mode M9 | |||
|---|---|---|---|
| Quadrant | BADHDUFLAG | Total packets | Discarded packets |
| A | 0 | 12 | 0 |
| B | 0 | 12 | 0 |
| C | 0 | 13 | 0 |
| D | 0 | 13 | 0 |
| Mode M0 | |||
|---|---|---|---|
| Quadrant | BADHDUFLAG | Total packets | Discarded packets |
| A | 0 | 13492 | 2 |
| B | 0 | 14399 | 2 |
| C | 0 | 14021 | 2 |
| D | 0 | 17673 | 2 |
| Mode SS | |||
|---|---|---|---|
| Quadrant | BADHDUFLAG | Total packets | Discarded packets |
| A | 0 | 134 | 0 |
| B | 0 | 134 | 0 |
| C | 0 | 134 | 0 |
| D | 0 | 134 | 0 |
| Quadrant | Total seconds | Saturated seconds | Saturation percentage |
|---|---|---|---|
| A | 6534 | 69 | 1.056015% |
| B | 6534 | 148 | 2.265075% |
| C | 6534 | 57 | 0.872360% |
| D | 6533 | 258 | 3.949181% |
Noise dominated data is calculated using 1-second bins in cleaned event files. If a bin has >2000 counts, and if more than 50% of those come from <1% of pixels, then it is considered to be noise-dominated and hence unusable.
| Quadrant | # 1 sec bins | Bins with >0 counts | Bins with >2000 counts | High rate bins dominated by noise | Noise dominated (total time) | Noise dominated (detector-on time) | Marked lightcurve |
|---|---|---|---|---|---|---|---|
| A | 7654 | 6535 | 7 | 7 | 0.09% | 0.11% | 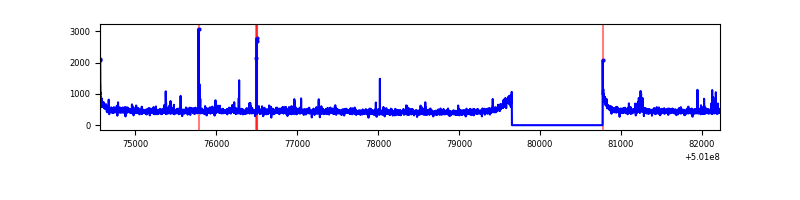 |
| B | 7654 | 6535 | 61 | 61 | 0.80% | 0.93% | 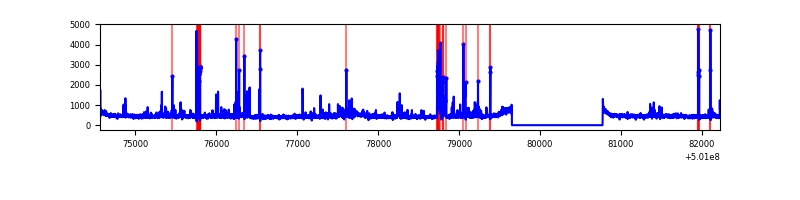 |
| C | 7654 | 6535 | 16 | 16 | 0.21% | 0.24% | 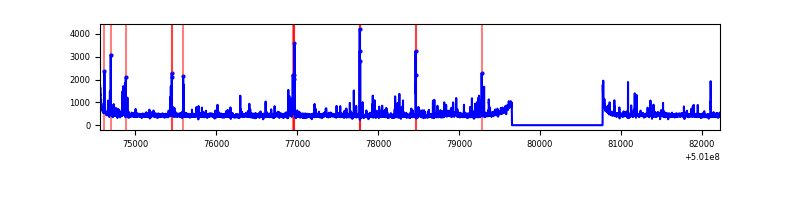 |
| D | 7653 | 6534 | 233 | 233 | 3.04% | 3.57% | 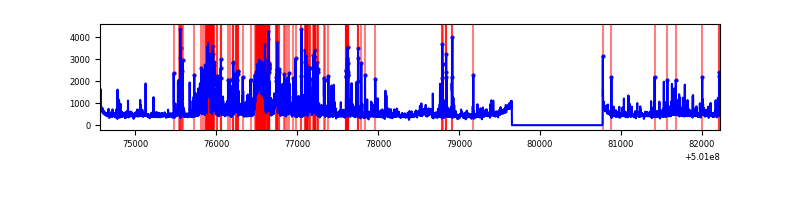 |
Top three noisy pixels from each quadrant. If the there are fewer than three noisy pixels in the level2.evt file, extra rows are filled as -1
| Pixel properties | Quadrant properties | ||||||
|---|---|---|---|---|---|---|---|
| Quadrant | DetID | PixID | Counts | Sigma | Mean | Median | Sigma |
| A | 3 | 14 | 69857 | 386.58 | 726 | 708 | 178.9 |
| A | 4 | 3 | 32496 | 177.71 | 726 | 708 | 178.9 |
| A | 8 | 246 | 21087 | 113.93 | 726 | 708 | 178.9 |
| B | 2 | 249 | 160824 | 1059.9 | 708 | 685 | 151.1 |
| B | 10 | 247 | 92196 | 605.67 | 708 | 685 | 151.1 |
| B | 5 | 236 | 91848 | 603.37 | 708 | 685 | 151.1 |
| C | 1 | 16 | 125109 | 645.43 | 705 | 697 | 192.8 |
| C | 12 | 252 | 68026 | 349.29 | 705 | 697 | 192.8 |
| C | 12 | 250 | 58196 | 298.29 | 705 | 697 | 192.8 |
| D | 14 | 52 | 262716 | 1312.89 | 699 | 668 | 199.6 |
| D | 3 | 12 | 255293 | 1275.7 | 699 | 668 | 199.6 |
| D | 11 | 129 | 204701 | 1022.23 | 699 | 668 | 199.6 |
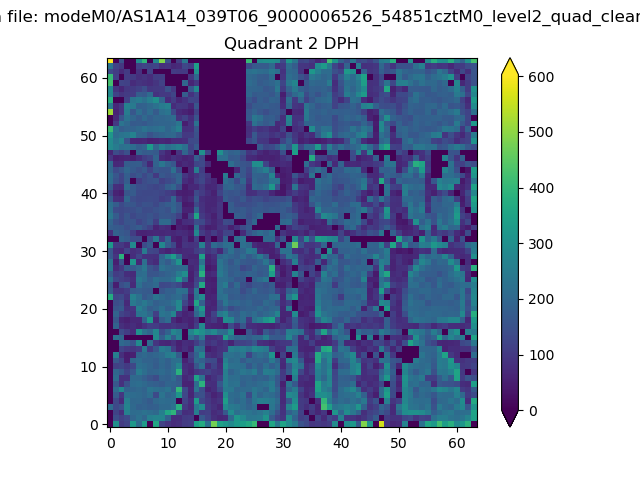
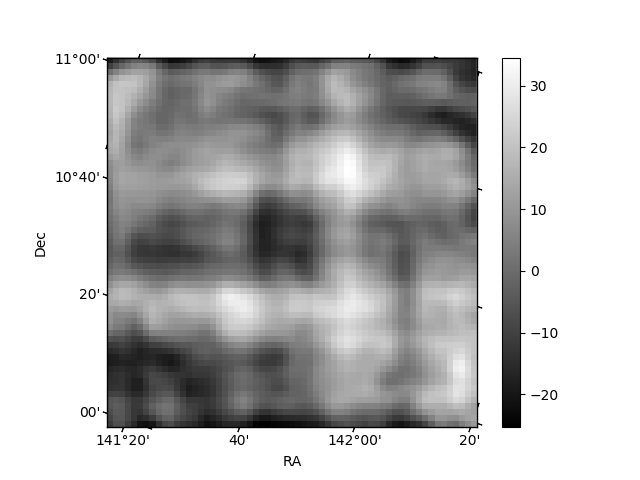
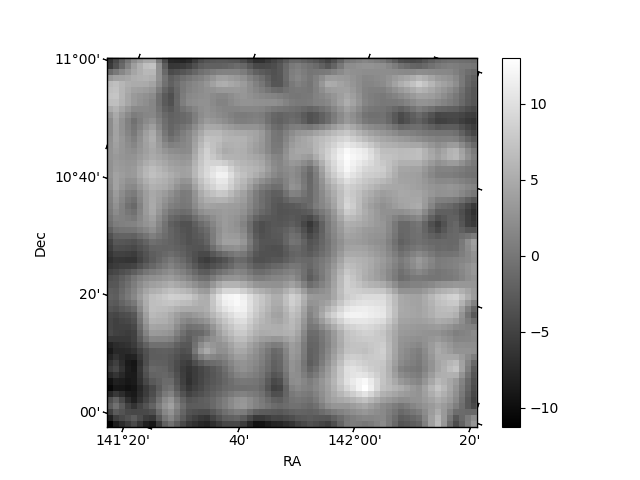
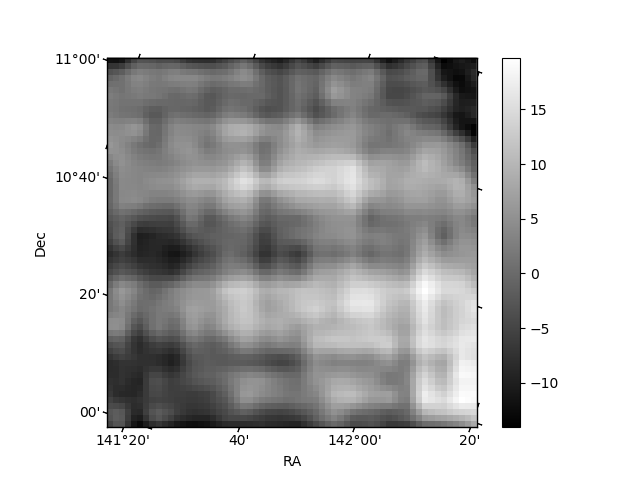
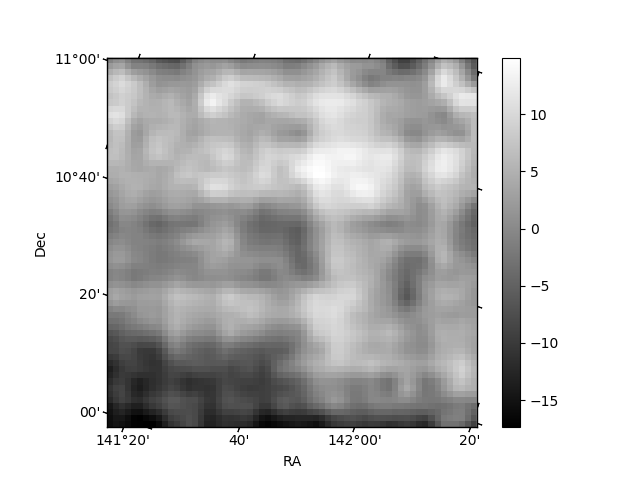
Histogram calculated using DETX and DETY for each event in the final _common_clean file
| Quadrant A | 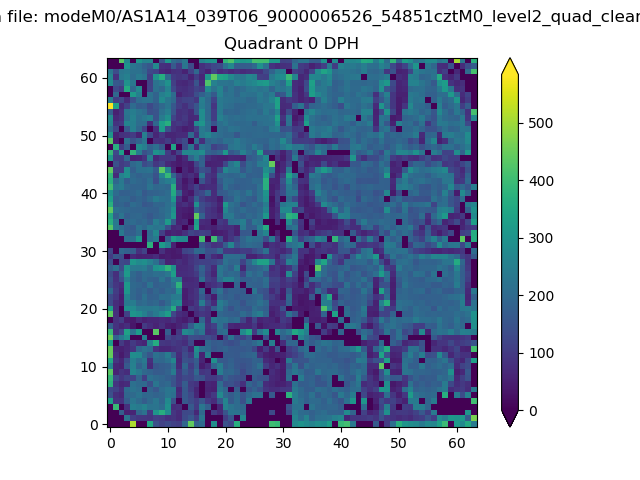 |
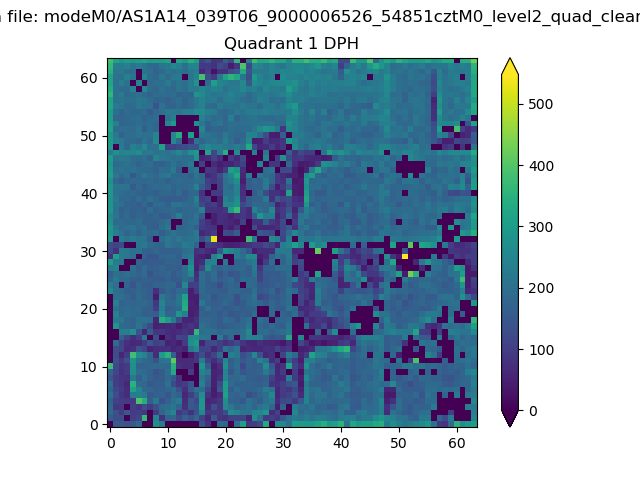 |
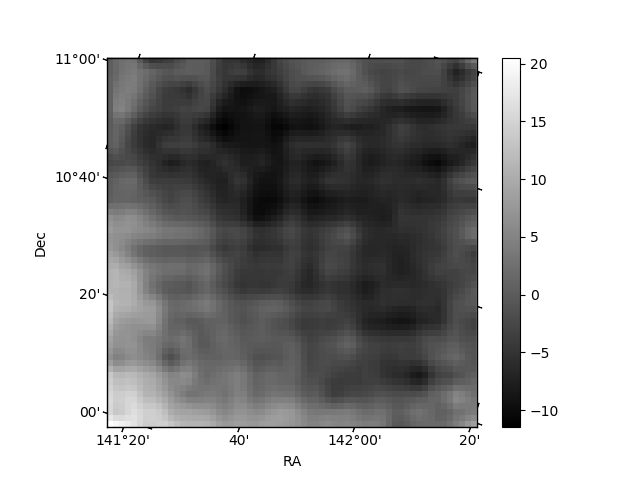
Quadrant B |
|---|---|---|---|
| Quadrant D | 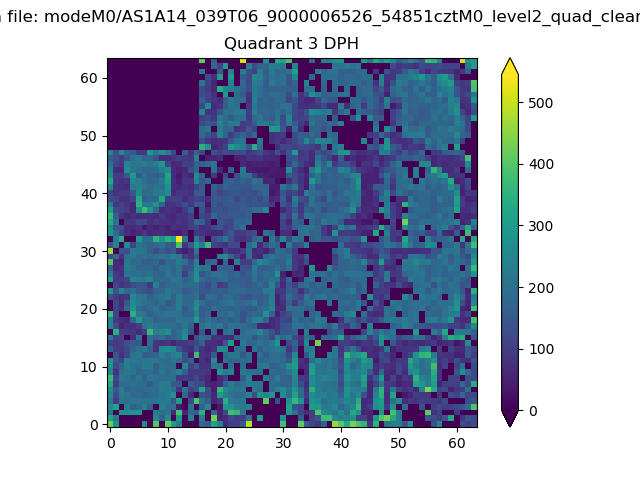 |
 |
Quadrant C |
| Plot type | Count rate plots | Images |
|---|---|---|
| Comparison with Poisson distribution Blue bars denote a histogram of data divided into 1 sec bins. Red curve is a Poisson curve with rate = median count rate of data. |
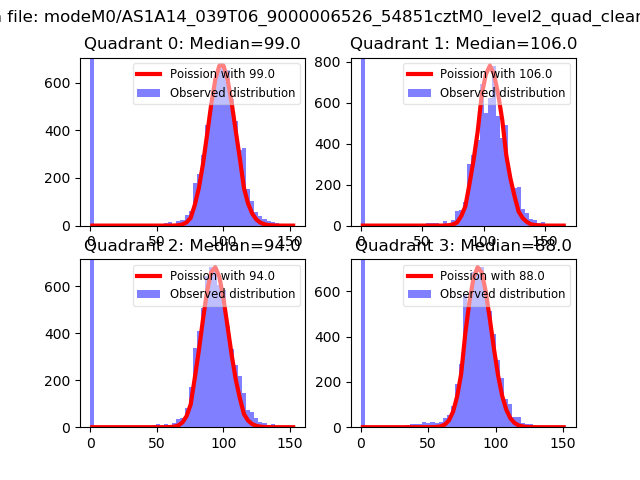 |
 |
| Quadrant-wise count rates Data is divided into 100 sec bins |
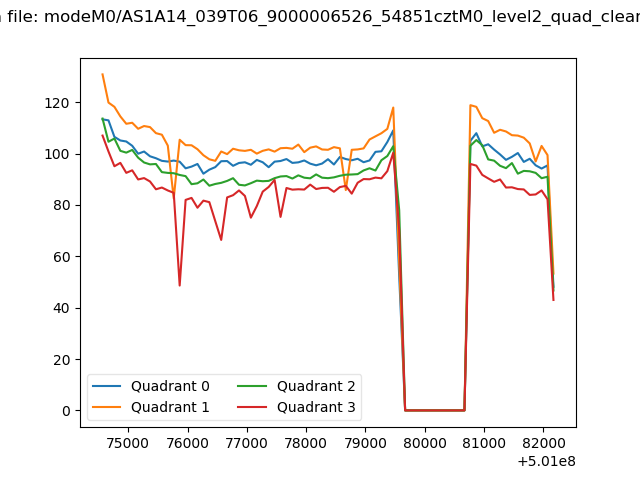 |
|
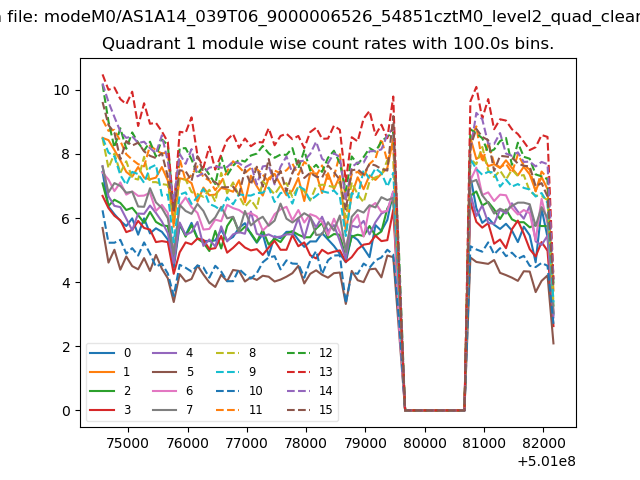
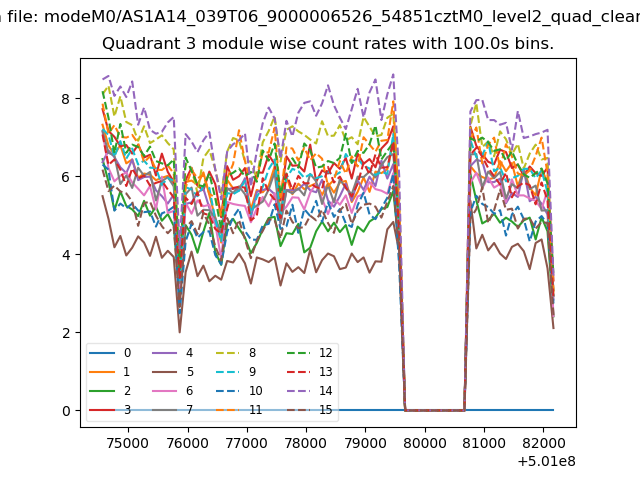
| Module-wise count rates for Quadrant A Data is divided into 100 sec bins |
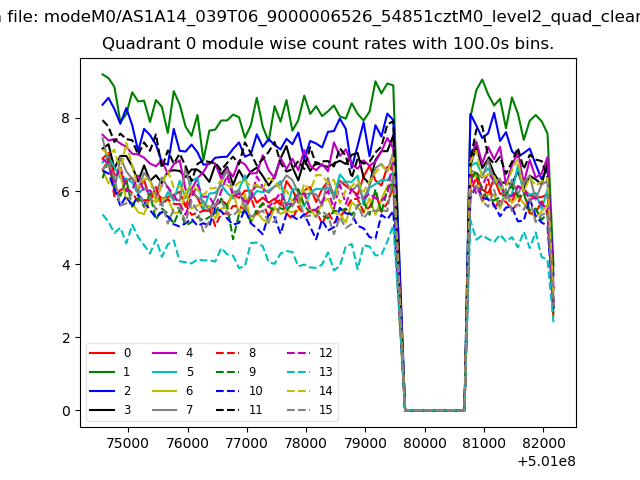 |
 |
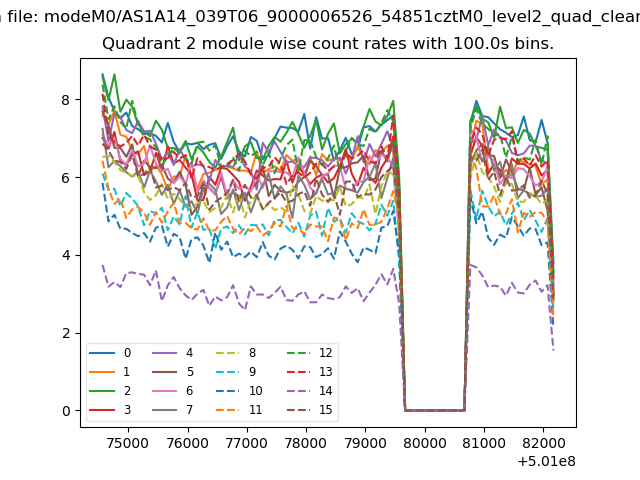
| Module-wise count rates for Quadrant B Data is divided into 100 sec bins |
 |
 |
| Module-wise count rates for Quadrant C Data is divided into 100 sec bins |
 |
 |
| Module-wise count rates for Quadrant D Data is divided into 100 sec bins |
 |
 |
| Parameter | Plot |
|---|---|
| CZT HV Monitor | 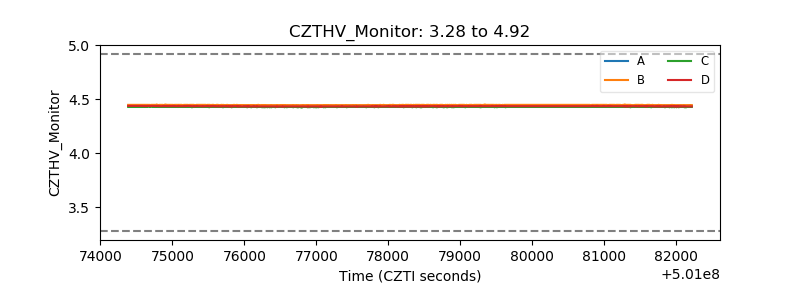 |
| D_VDD | 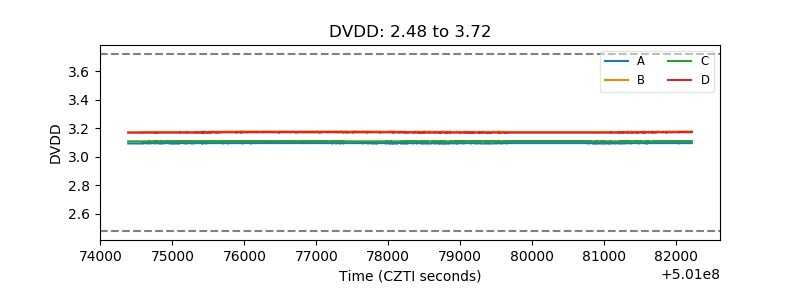 |
| Temperature 1 | 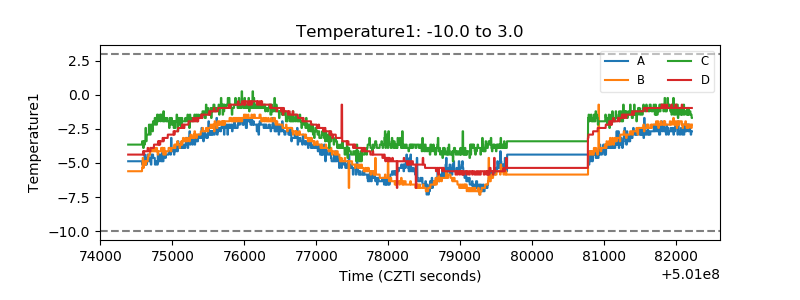 |
| Veto HV Monitor | 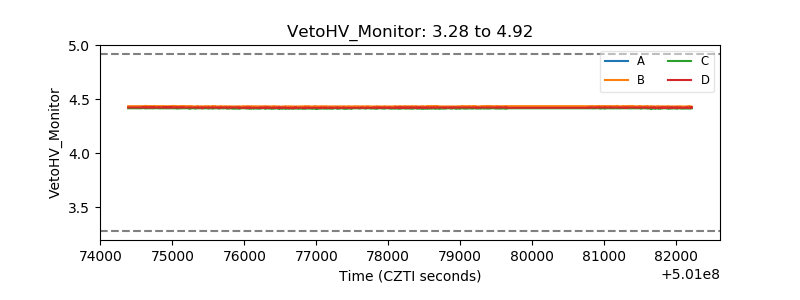 |
| Veto LLD | 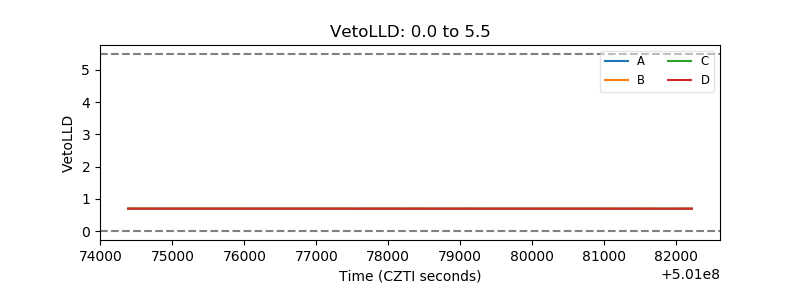 |
| Alpha Counter | 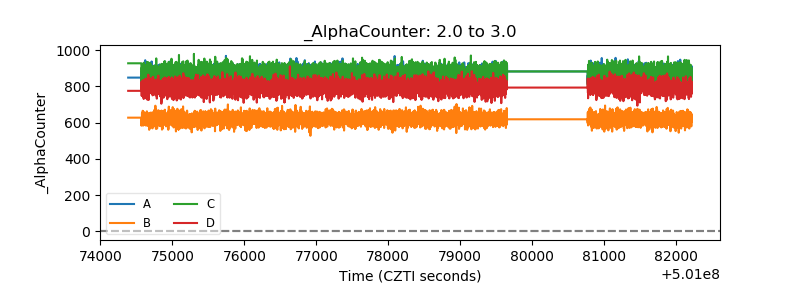 |
| _CPM_Rate | 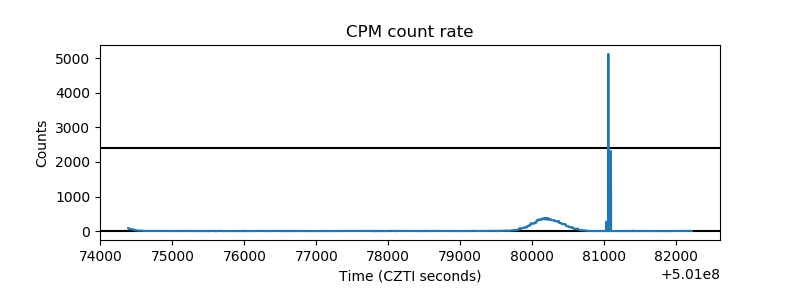 |
| CZT Counter | 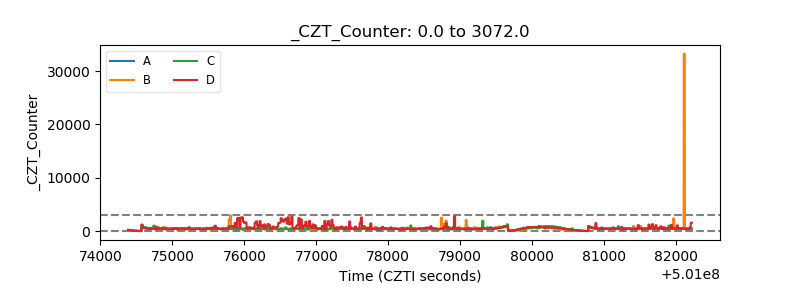 |
| +2.5 Volts monitor |  |
| +5 Volts monitor |  |
| _ROLL_ROT | 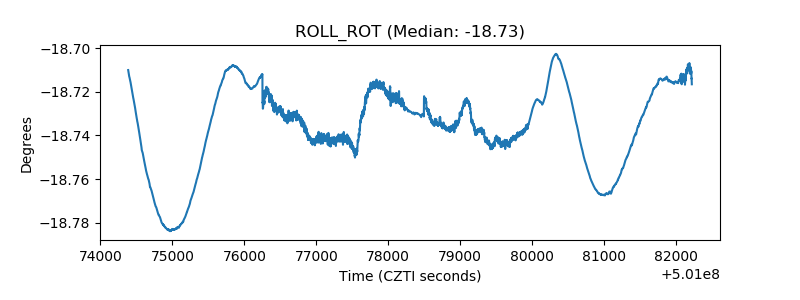 |
| _Roll_DEC | 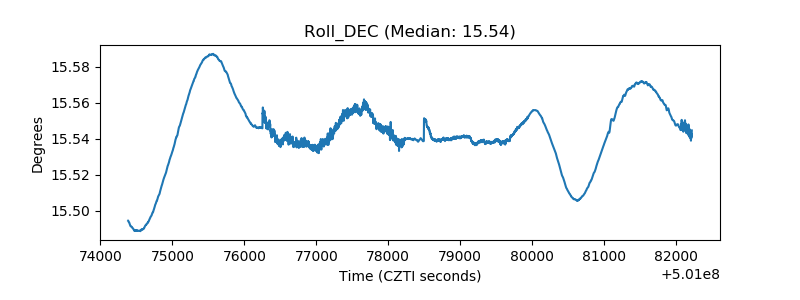 |
| _Roll_RA | 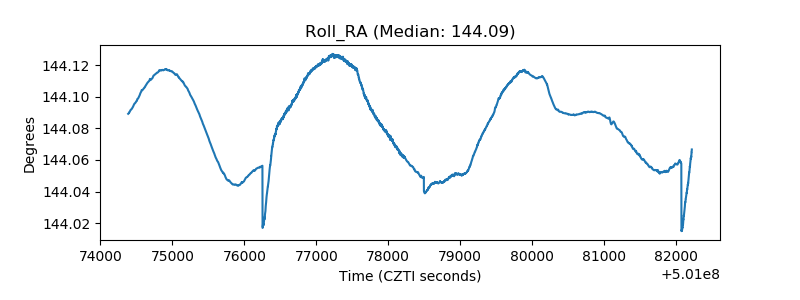 |
| Veto Counter | 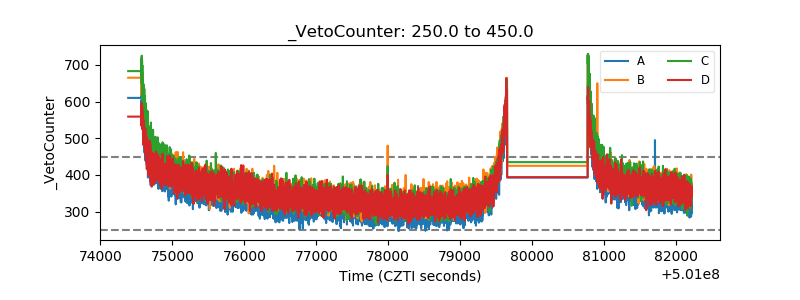 |