| Param | Original file | Final file |
|---|---|---|
| Filename | modeM0/AS1A14_039T06_9000006526_54852cztM0_level2.fits | modeM0/AS1A14_039T06_9000006526_54852cztM0_level2_quad_clean.evt |
| Size (bytes) | 376,384,320 | 90,164,160 |
| Size | 358.9 MB | 86.0 MB |
| Events in quadrant A | 3,208,833 | 587,910 |
| Events in quadrant B | 2,937,450 | 626,460 |
| Events in quadrant C | 3,150,743 | 560,653 |
| Events in quadrant D | 4,153,706 | 522,565 |
| Mode M9 | |||
|---|---|---|---|
| Quadrant | BADHDUFLAG | Total packets | Discarded packets |
| A | 0 | 18 | 0 |
| B | 0 | 18 | 0 |
| C | 0 | 19 | 0 |
| D | 0 | 19 | 0 |
| Mode M0 | |||
|---|---|---|---|
| Quadrant | BADHDUFLAG | Total packets | Discarded packets |
| A | 0 | 14094 | 22 |
| B | 0 | 13262 | 20 |
| C | 0 | 13961 | 21 |
| D | 0 | 16578 | 25 |
| Mode SS | |||
|---|---|---|---|
| Quadrant | BADHDUFLAG | Total packets | Discarded packets |
| A | 0 | 128 | 0 |
| B | 0 | 128 | 0 |
| C | 0 | 128 | 0 |
| D | 0 | 128 | 0 |
| Quadrant | Total seconds | Saturated seconds | Saturation percentage |
|---|---|---|---|
| A | 6190 | 172 | 2.778675% |
| B | 6191 | 104 | 1.679858% |
| C | 6189 | 96 | 1.551139% |
| D | 6190 | 190 | 3.069467% |
Noise dominated data is calculated using 1-second bins in cleaned event files. If a bin has >2000 counts, and if more than 50% of those come from <1% of pixels, then it is considered to be noise-dominated and hence unusable.
| Quadrant | # 1 sec bins | Bins with >0 counts | Bins with >2000 counts | High rate bins dominated by noise | Noise dominated (total time) | Noise dominated (detector-on time) | Marked lightcurve |
|---|---|---|---|---|---|---|---|
| A | 7487 | 6192 | 69 | 69 | 0.92% | 1.11% | 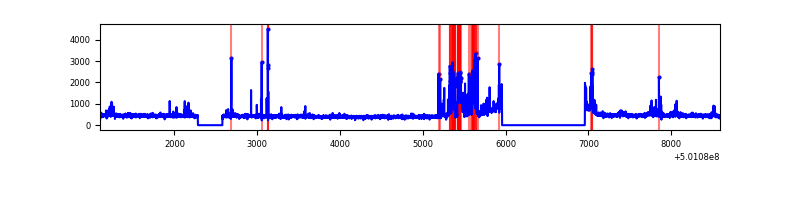 |
| B | 7488 | 6193 | 16 | 16 | 0.21% | 0.26% | 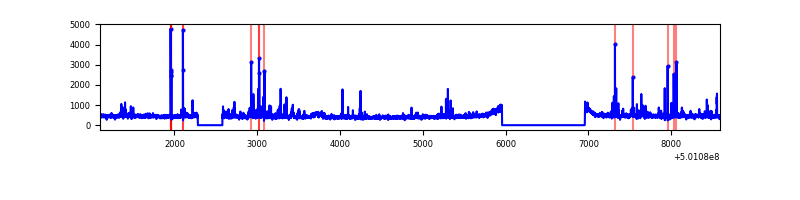 |
| C | 7486 | 6191 | 60 | 60 | 0.80% | 0.97% | 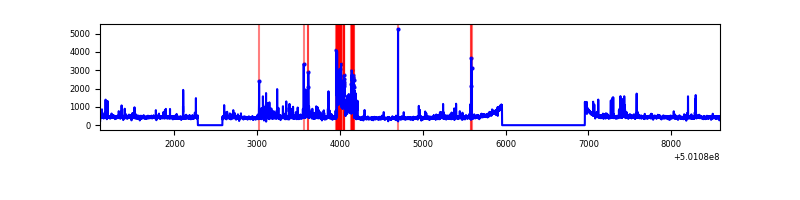 |
| D | 7487 | 6194 | 137 | 137 | 1.83% | 2.21% | 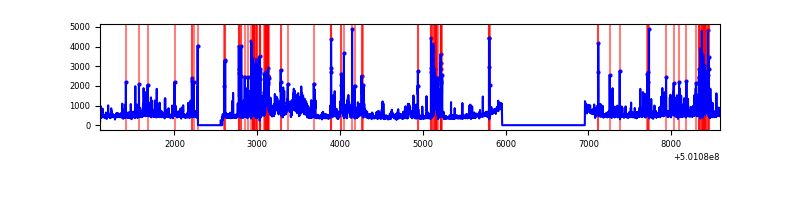 |
Top three noisy pixels from each quadrant. If the there are fewer than three noisy pixels in the level2.evt file, extra rows are filled as -1
| Pixel properties | Quadrant properties | ||||||
|---|---|---|---|---|---|---|---|
| Quadrant | DetID | PixID | Counts | Sigma | Mean | Median | Sigma |
| A | 8 | 206 | 428130 | 2562.28 | 676 | 660 | 166.8 |
| A | 3 | 14 | 32120 | 188.57 | 676 | 660 | 166.8 |
| A | 8 | 249 | 26646 | 155.76 | 676 | 660 | 166.8 |
| B | 5 | 185 | 102576 | 705.03 | 667 | 643 | 144.6 |
| B | 10 | 247 | 86462 | 593.58 | 667 | 643 | 144.6 |
| B | 7 | 252 | 32341 | 219.24 | 667 | 643 | 144.6 |
| C | 12 | 249 | 271179 | 1483.45 | 661 | 654 | 182.4 |
| C | 14 | 254 | 87544 | 476.47 | 661 | 654 | 182.4 |
| C | 12 | 250 | 48854 | 264.31 | 661 | 654 | 182.4 |
| D | 10 | 181 | 539737 | 2888.6 | 658 | 630 | 186.6 |
| D | 2 | 172 | 195522 | 1044.25 | 658 | 630 | 186.6 |
| D | 3 | 12 | 111895 | 596.17 | 658 | 630 | 186.6 |
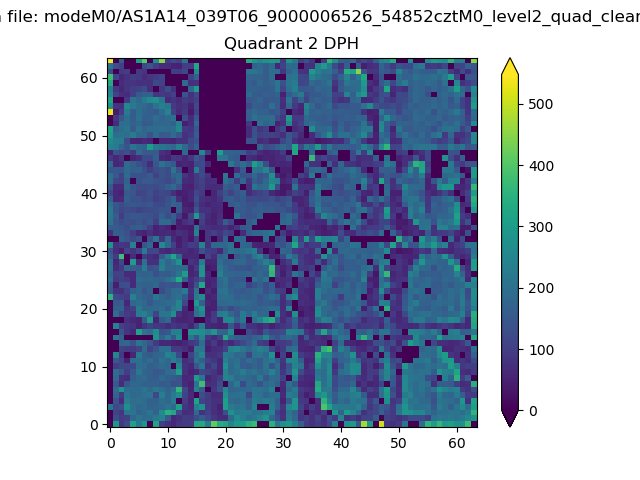
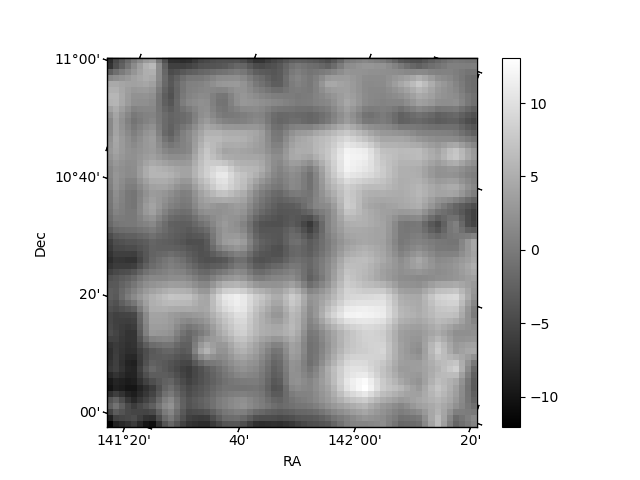
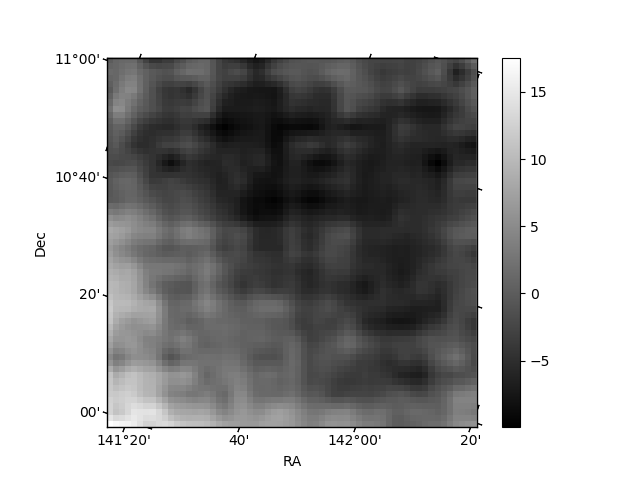
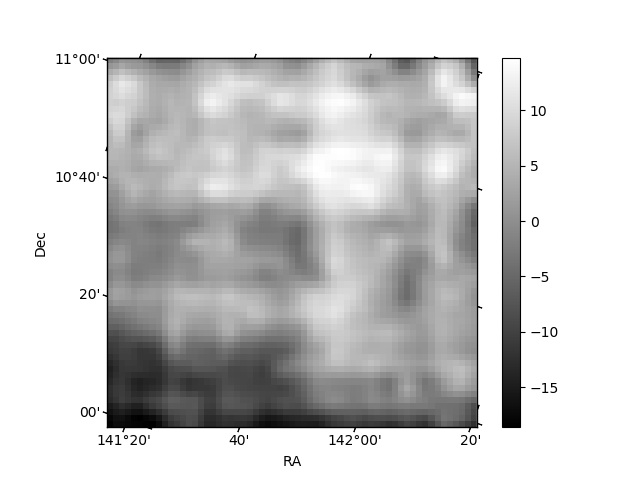
Histogram calculated using DETX and DETY for each event in the final _common_clean file
| Quadrant A | 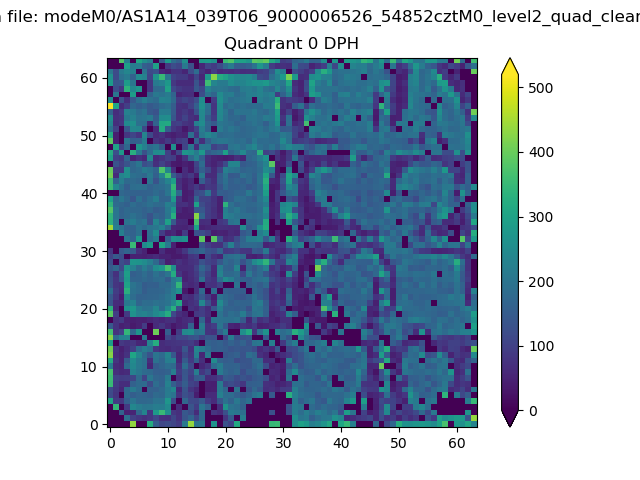 |
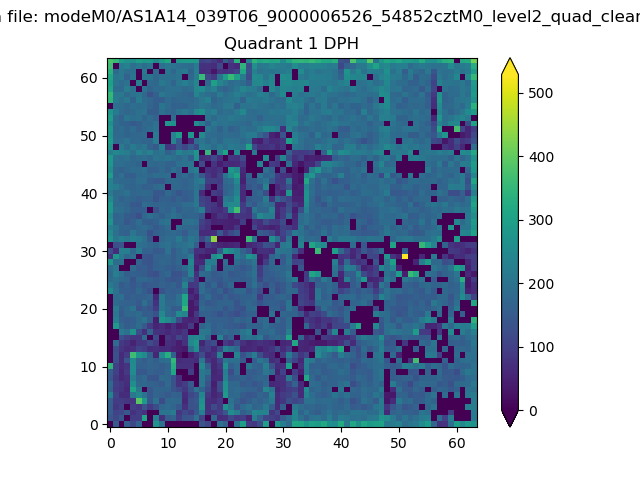 |
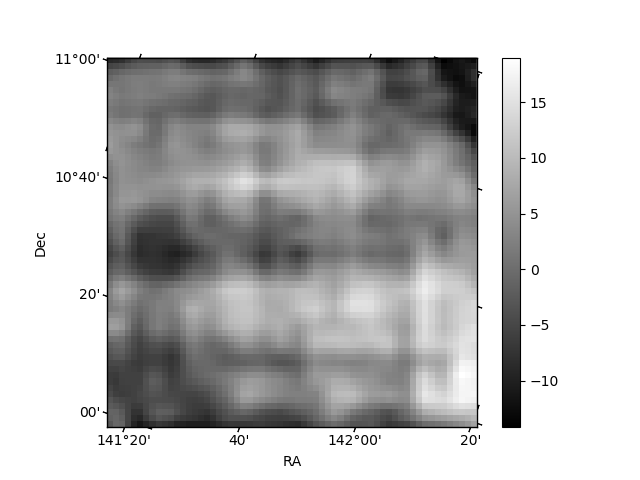
Quadrant B |
|---|---|---|---|
| Quadrant D | 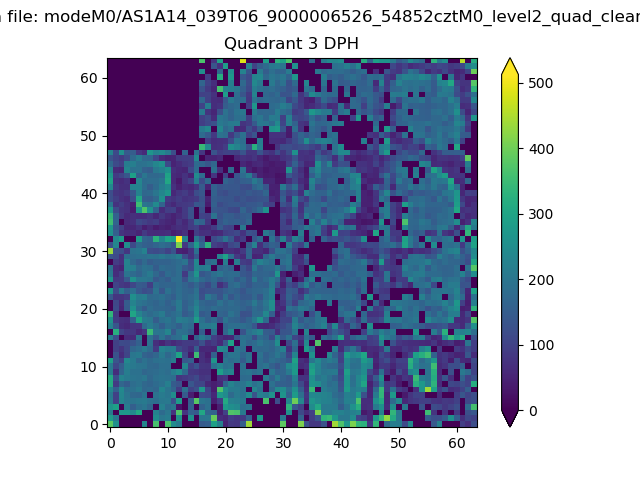 |
 |
Quadrant C |
| Plot type | Count rate plots | Images |
|---|---|---|
| Comparison with Poisson distribution Blue bars denote a histogram of data divided into 1 sec bins. Red curve is a Poisson curve with rate = median count rate of data. |
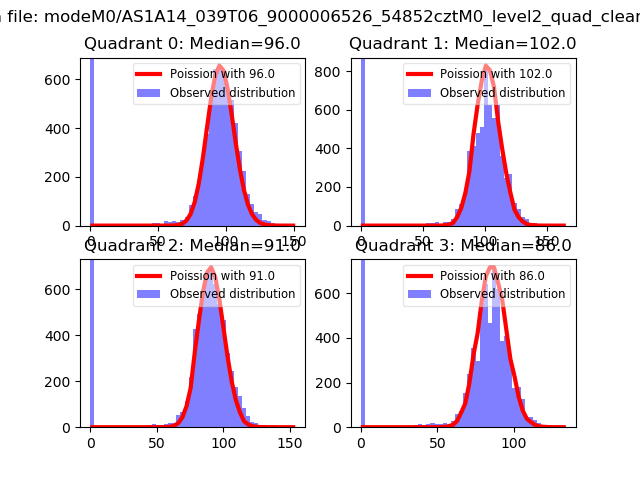 |
 |
| Quadrant-wise count rates Data is divided into 100 sec bins |
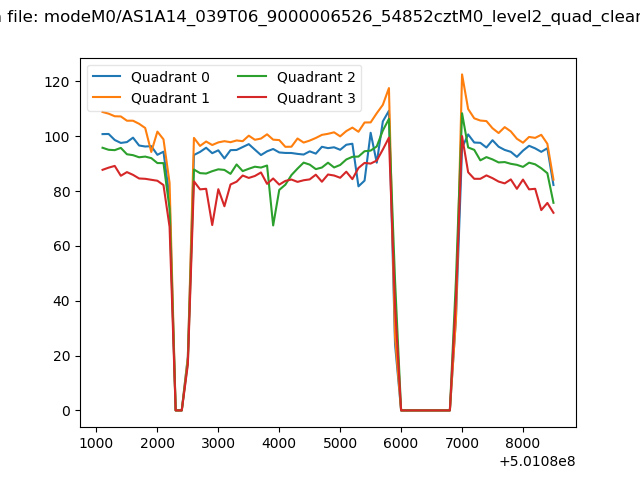 |
|
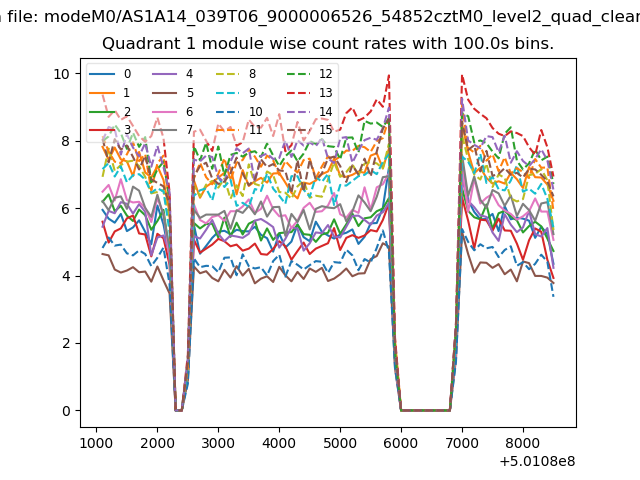
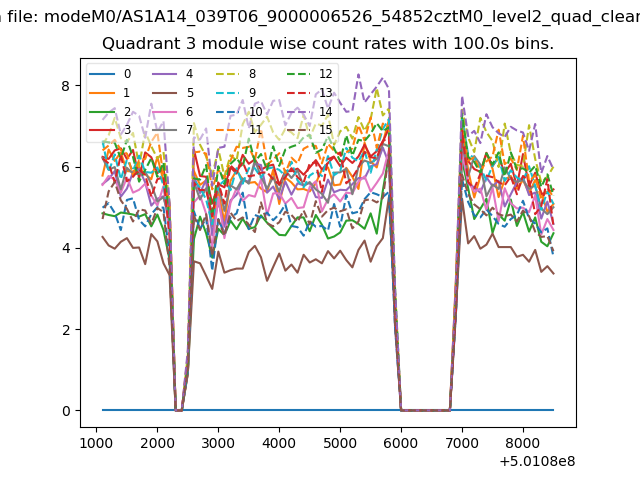
| Module-wise count rates for Quadrant A Data is divided into 100 sec bins |
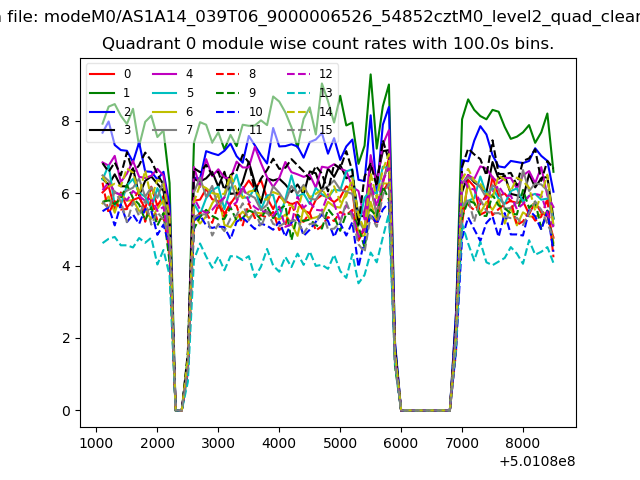 |
 |
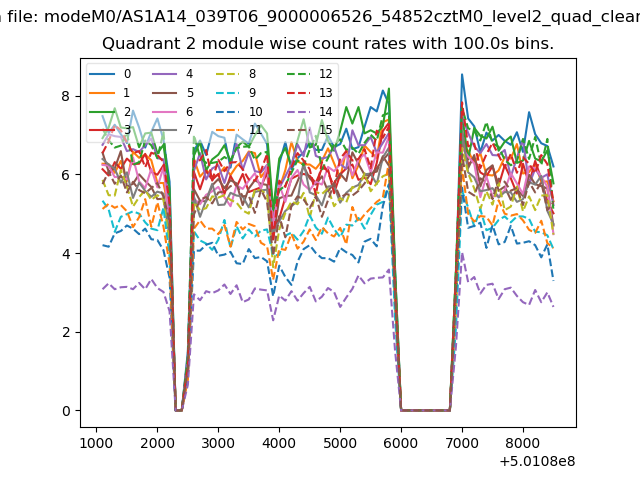
| Module-wise count rates for Quadrant B Data is divided into 100 sec bins |
 |
 |
| Module-wise count rates for Quadrant C Data is divided into 100 sec bins |
 |
 |
| Module-wise count rates for Quadrant D Data is divided into 100 sec bins |
 |
 |
| Parameter | Plot |
|---|---|
| CZT HV Monitor | 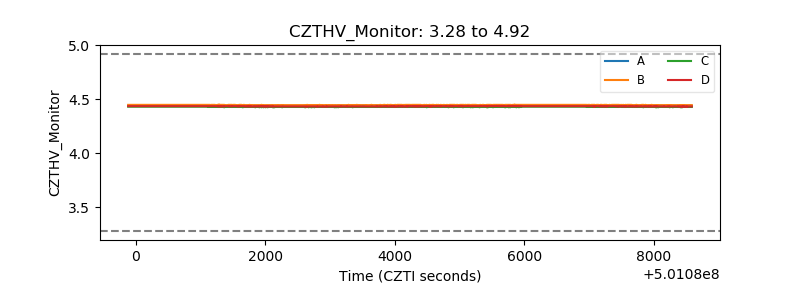 |
| D_VDD | 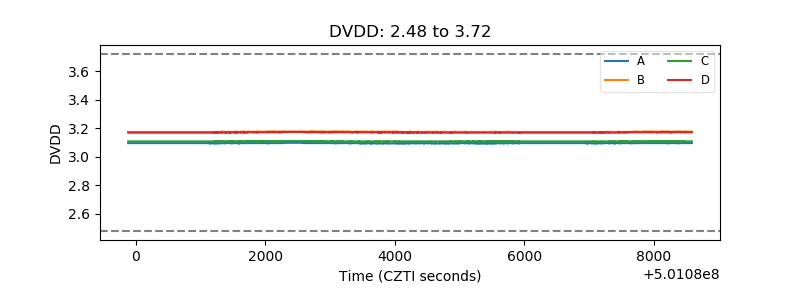 |
| Temperature 1 | 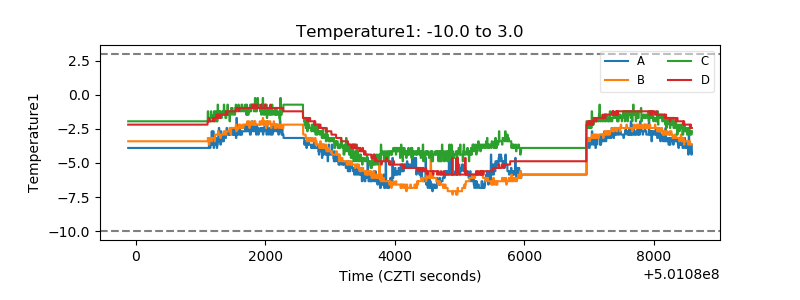 |
| Veto HV Monitor |  |
| Veto LLD | 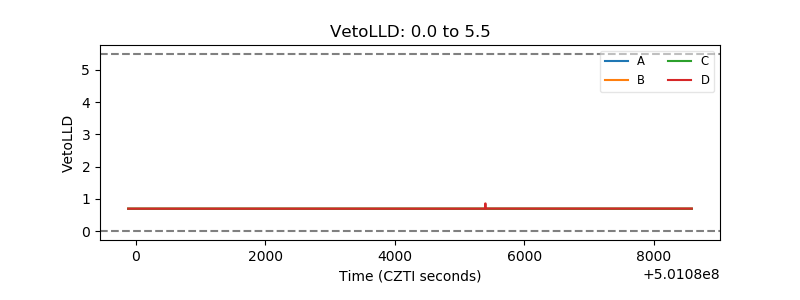 |
| Alpha Counter | 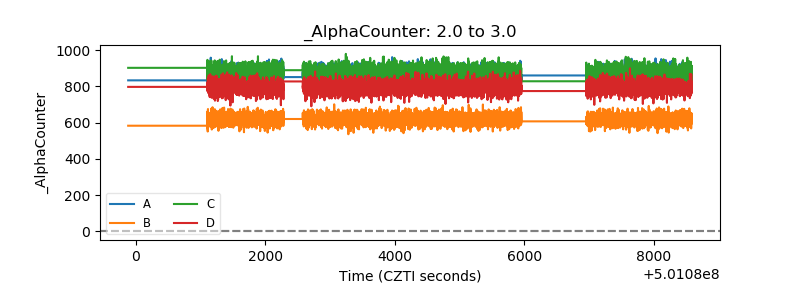 |
| _CPM_Rate | 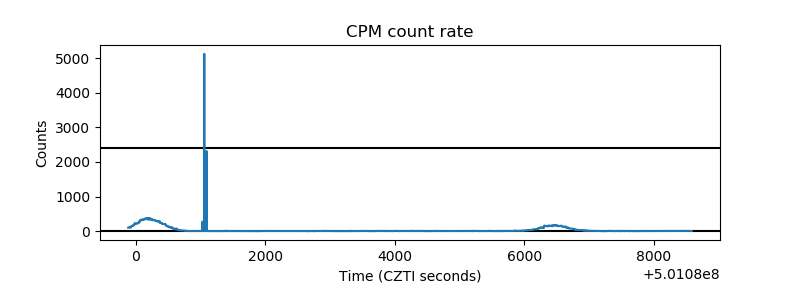 |
| CZT Counter | 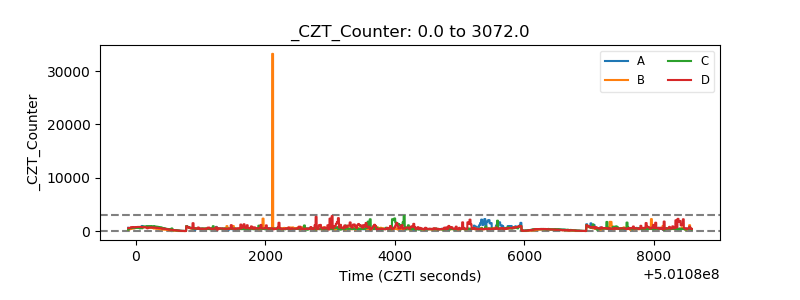 |
| +2.5 Volts monitor |  |
| +5 Volts monitor |  |
| _ROLL_ROT | 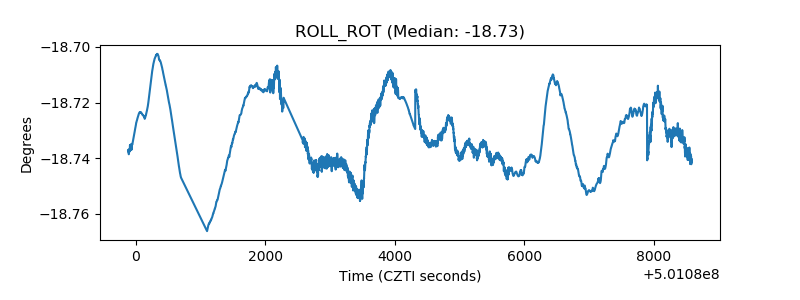 |
| _Roll_DEC | 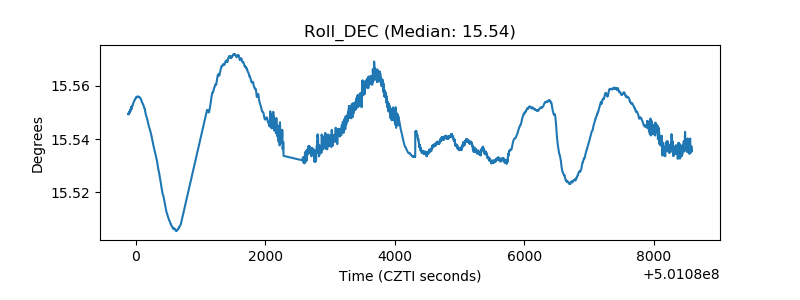 |
| _Roll_RA |  |
| Veto Counter | 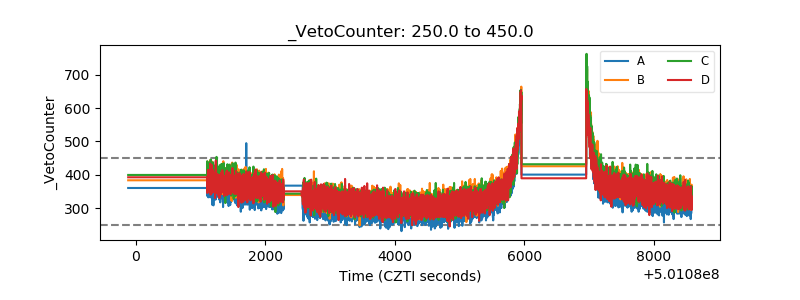 |