| Param | Original file | Final file |
|---|---|---|
| Filename | modeM0/AS1A14_039T06_9000006526_54853cztM0_level2.fits | modeM0/AS1A14_039T06_9000006526_54853cztM0_level2_quad_clean.evt |
| Size (bytes) | 419,708,160 | 102,473,280 |
| Size | 400.3 MB | 97.7 MB |
| Events in quadrant A | 3,472,976 | 670,534 |
| Events in quadrant B | 3,384,993 | 716,552 |
| Events in quadrant C | 3,817,351 | 627,634 |
| Events in quadrant D | 4,306,635 | 591,823 |
| Mode M9 | |||
|---|---|---|---|
| Quadrant | BADHDUFLAG | Total packets | Discarded packets |
| A | 0 | 11 | 0 |
| B | 0 | 12 | 0 |
| C | 0 | 12 | 0 |
| D | 0 | 12 | 0 |
| Mode M0 | |||
|---|---|---|---|
| Quadrant | BADHDUFLAG | Total packets | Discarded packets |
| A | 0 | 15539 | 2 |
| B | 0 | 15362 | 3 |
| C | 0 | 16586 | 2 |
| D | 0 | 17839 | 2 |
| Mode SS | |||
|---|---|---|---|
| Quadrant | BADHDUFLAG | Total packets | Discarded packets |
| A | 0 | 146 | 0 |
| B | 0 | 146 | 0 |
| C | 0 | 146 | 0 |
| D | 0 | 146 | 0 |
| Quadrant | Total seconds | Saturated seconds | Saturation percentage |
|---|---|---|---|
| A | 7121 | 167 | 2.345176% |
| B | 7120 | 169 | 2.373596% |
| C | 7120 | 250 | 3.511236% |
| D | 7120 | 278 | 3.904494% |
Noise dominated data is calculated using 1-second bins in cleaned event files. If a bin has >2000 counts, and if more than 50% of those come from <1% of pixels, then it is considered to be noise-dominated and hence unusable.
| Quadrant | # 1 sec bins | Bins with >0 counts | Bins with >2000 counts | High rate bins dominated by noise | Noise dominated (total time) | Noise dominated (detector-on time) | Marked lightcurve |
|---|---|---|---|---|---|---|---|
| A | 7836 | 7122 | 35 | 35 | 0.45% | 0.49% | 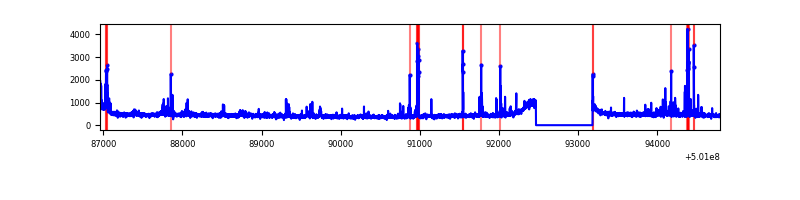 |
| B | 7835 | 7120 | 19 | 19 | 0.24% | 0.27% | 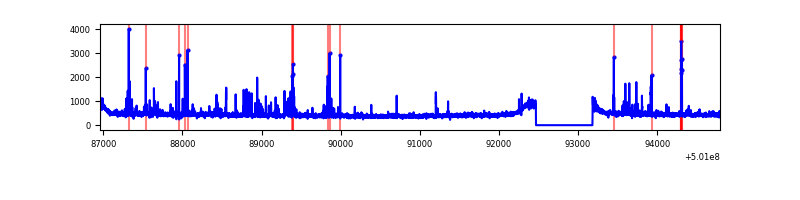 |
| C | 7835 | 7121 | 126 | 126 | 1.61% | 1.77% | 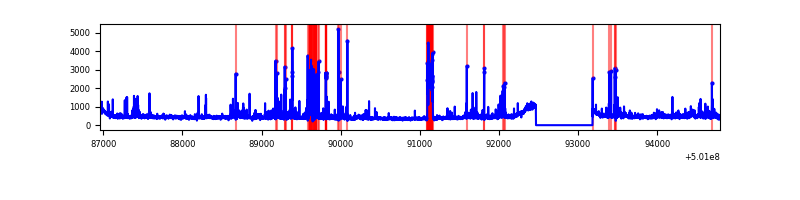 |
| D | 7835 | 7121 | 149 | 149 | 1.90% | 2.09% | 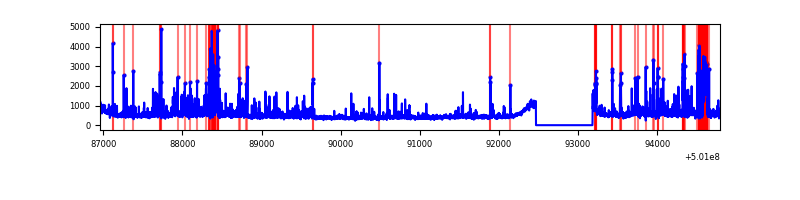 |
Top three noisy pixels from each quadrant. If the there are fewer than three noisy pixels in the level2.evt file, extra rows are filled as -1
| Pixel properties | Quadrant properties | ||||||
|---|---|---|---|---|---|---|---|
| Quadrant | DetID | PixID | Counts | Sigma | Mean | Median | Sigma |
| A | 8 | 206 | 113360 | 580.11 | 788 | 770 | 194.1 |
| A | 13 | 248 | 71354 | 363.68 | 788 | 770 | 194.1 |
| A | 0 | 8 | 63592 | 323.69 | 788 | 770 | 194.1 |
| B | 5 | 185 | 220944 | 1314.3 | 773 | 742 | 167.5 |
| B | 10 | 247 | 58456 | 344.47 | 773 | 742 | 167.5 |
| B | 12 | 111 | 20178 | 116.01 | 773 | 742 | 167.5 |
| C | 14 | 254 | 463307 | 2225.27 | 762 | 755 | 207.9 |
| C | 12 | 252 | 125151 | 598.45 | 762 | 755 | 207.9 |
| C | 12 | 250 | 65537 | 311.65 | 762 | 755 | 207.9 |
| D | 3 | 12 | 305250 | 1409.11 | 762 | 732 | 216.1 |
| D | 10 | 181 | 295939 | 1366.02 | 762 | 732 | 216.1 |
| D | 11 | 176 | 198403 | 914.69 | 762 | 732 | 216.1 |
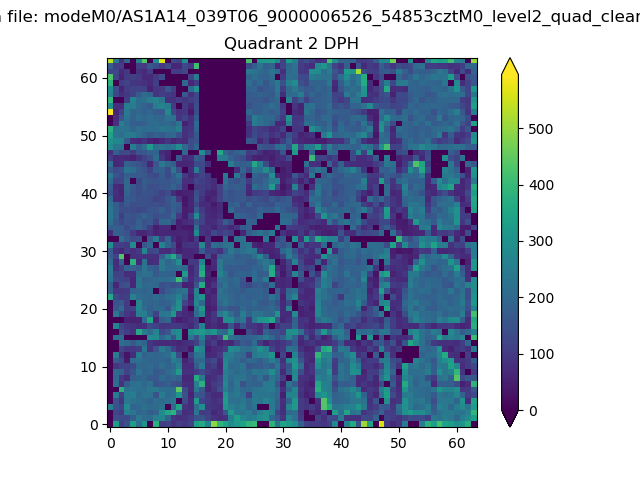
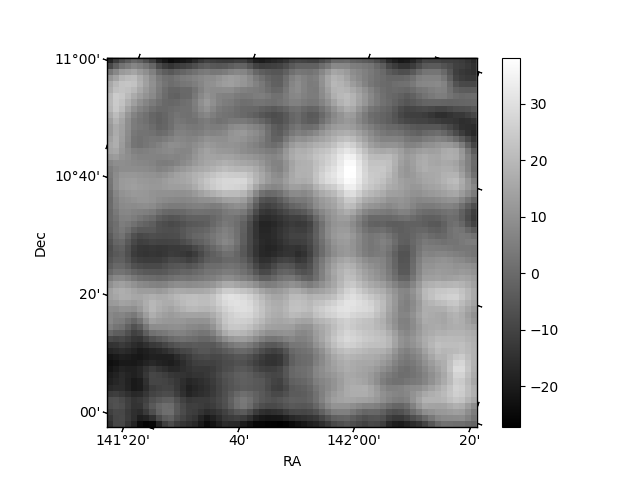
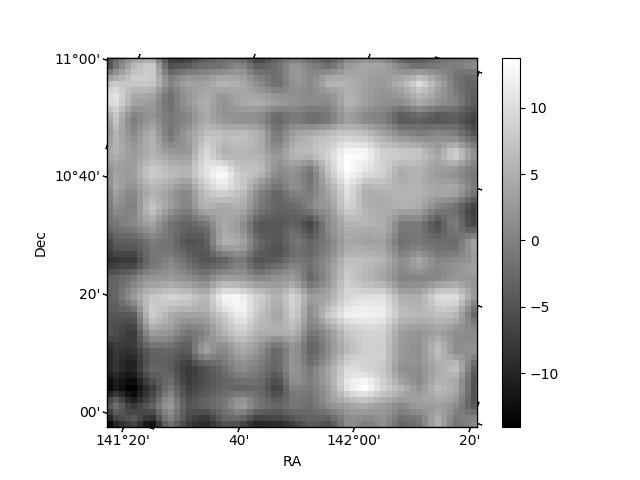
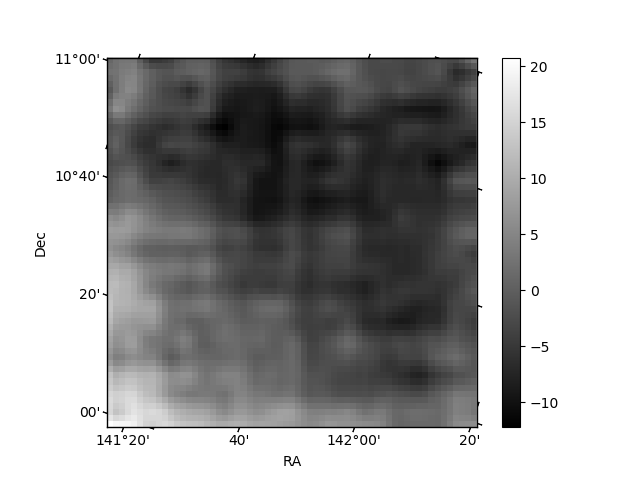
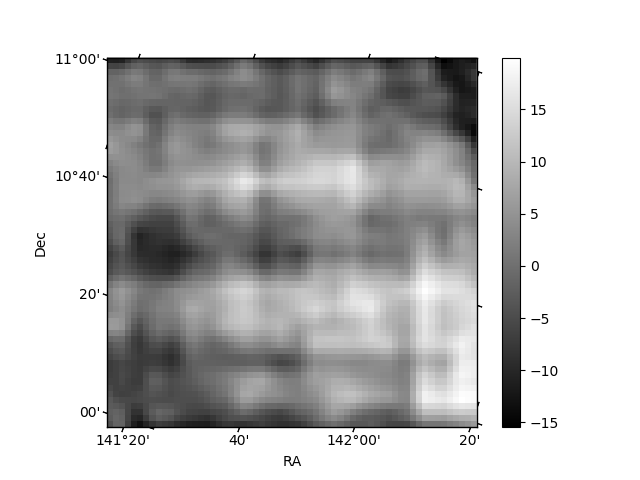
Histogram calculated using DETX and DETY for each event in the final _common_clean file
| Quadrant A | 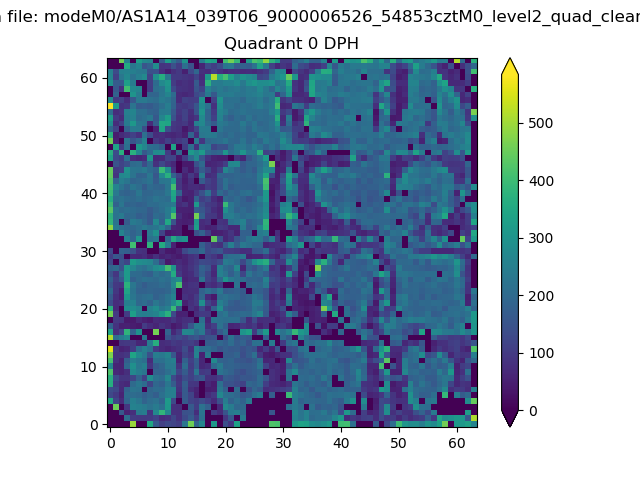 |
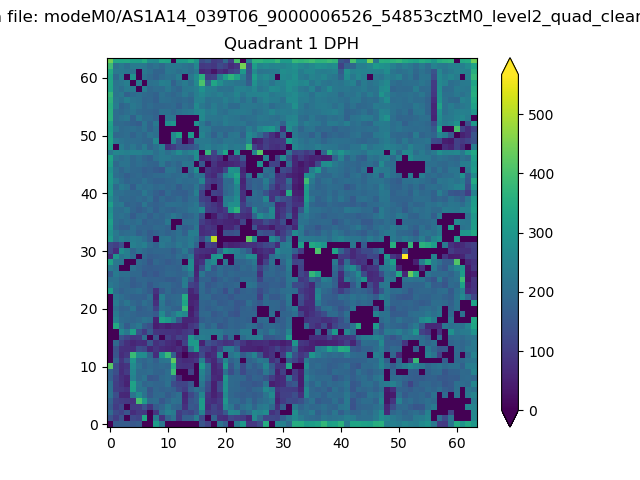 |
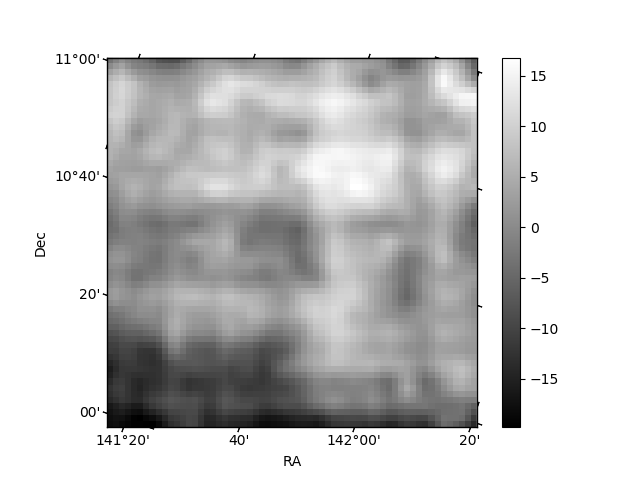
Quadrant B |
|---|---|---|---|
| Quadrant D | 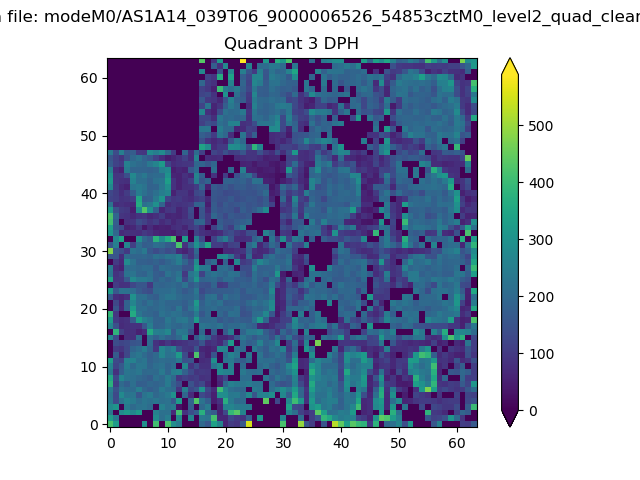 |
 |
Quadrant C |
| Plot type | Count rate plots | Images |
|---|---|---|
| Comparison with Poisson distribution Blue bars denote a histogram of data divided into 1 sec bins. Red curve is a Poisson curve with rate = median count rate of data. |
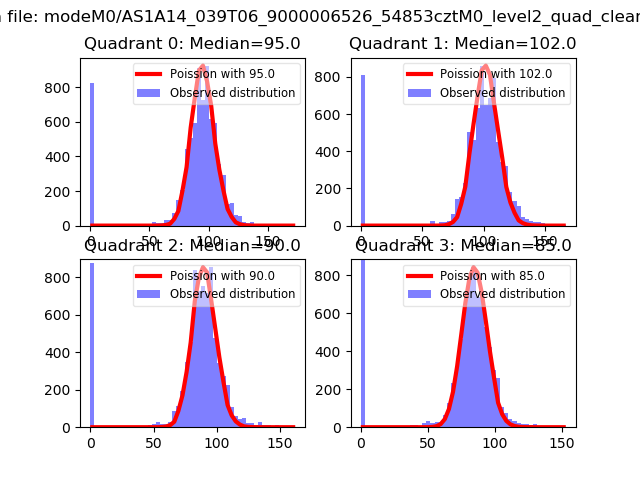 |
 |
| Quadrant-wise count rates Data is divided into 100 sec bins |
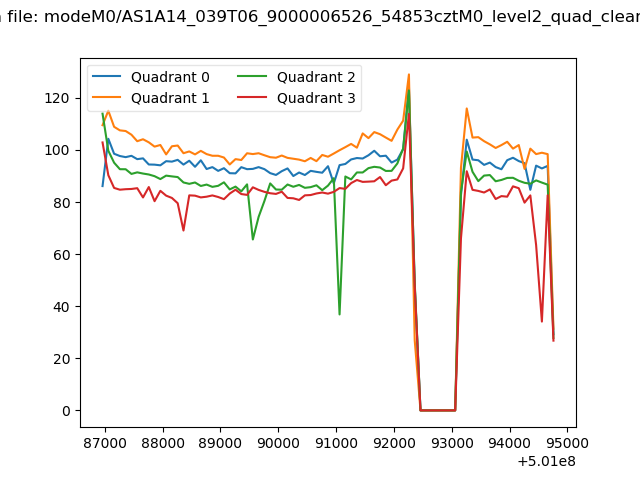 |
|
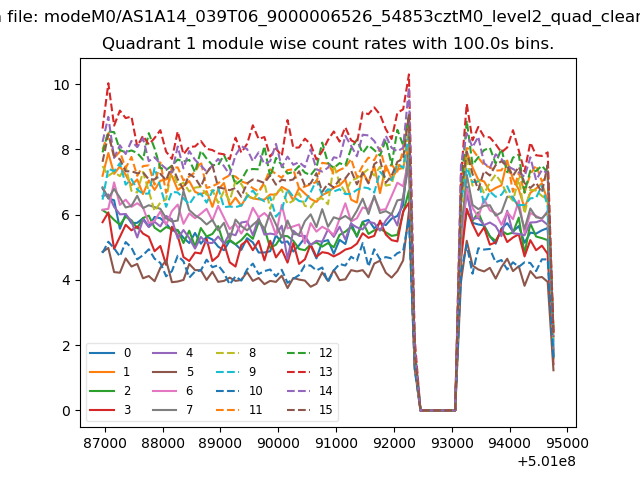
| Module-wise count rates for Quadrant A Data is divided into 100 sec bins |
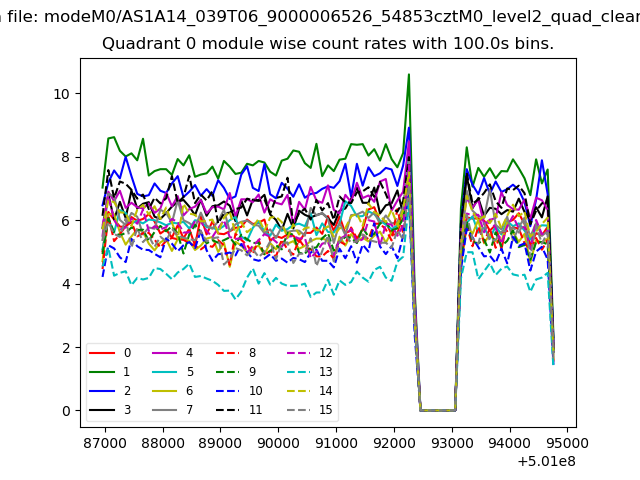 |
 |
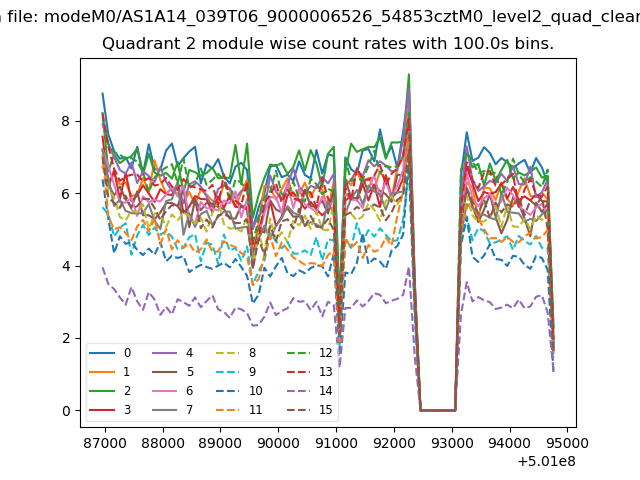
| Module-wise count rates for Quadrant B Data is divided into 100 sec bins |
 |
 |
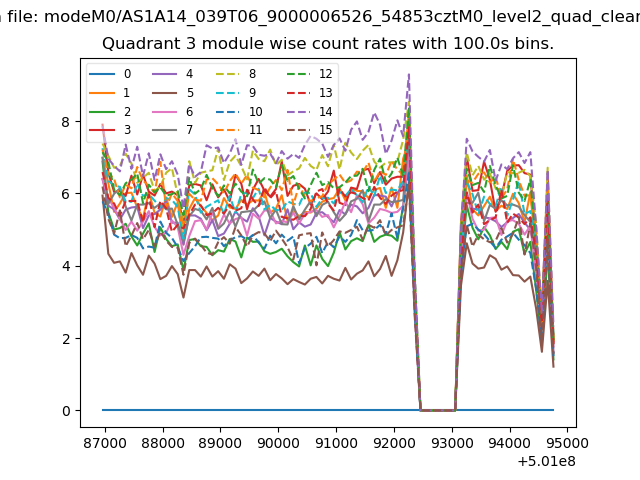
| Module-wise count rates for Quadrant C Data is divided into 100 sec bins |
 |
 |
| Module-wise count rates for Quadrant D Data is divided into 100 sec bins |
 |
 |
| Parameter | Plot |
|---|---|
| CZT HV Monitor | 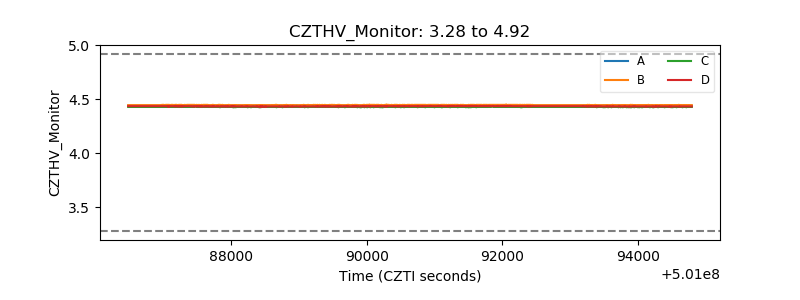 |
| D_VDD | 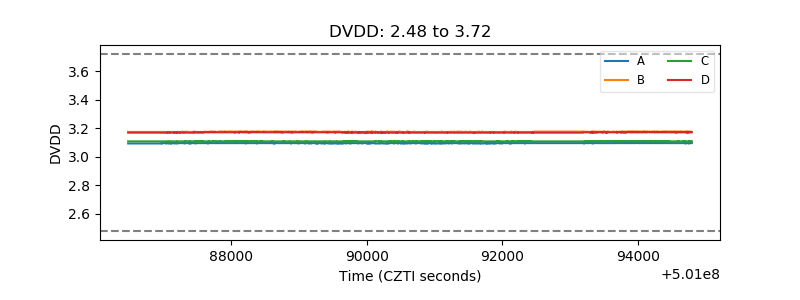 |
| Temperature 1 | 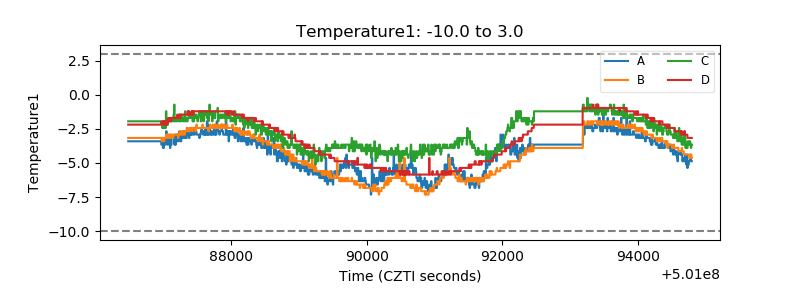 |
| Veto HV Monitor |  |
| Veto LLD | 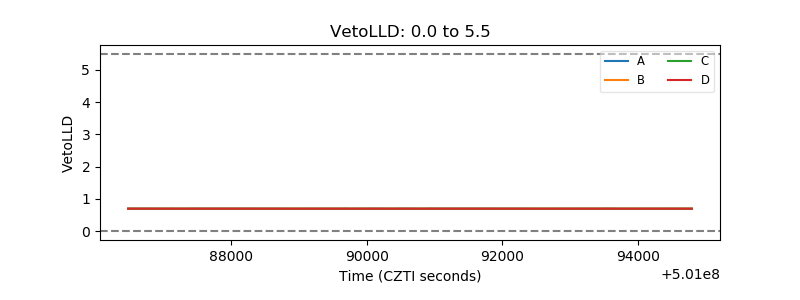 |
| Alpha Counter | 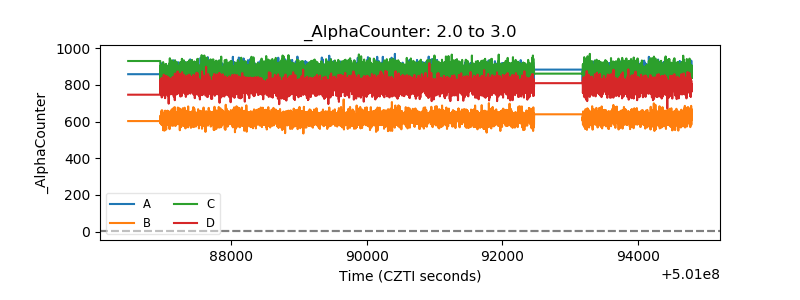 |
| _CPM_Rate | 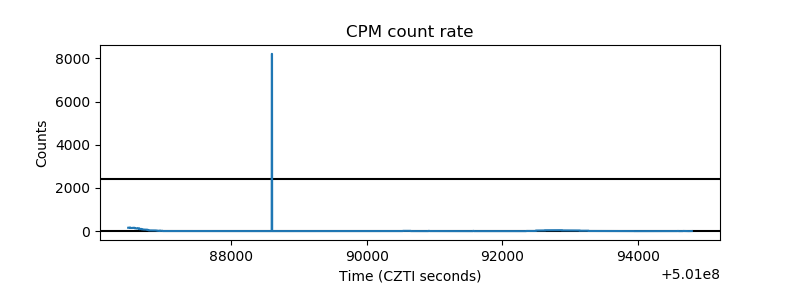 |
| CZT Counter | 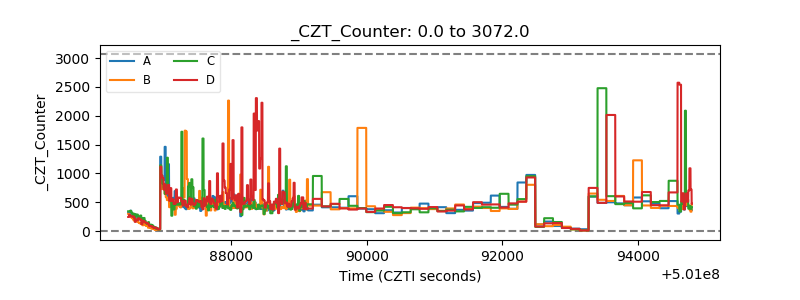 |
| +2.5 Volts monitor |  |
| +5 Volts monitor | 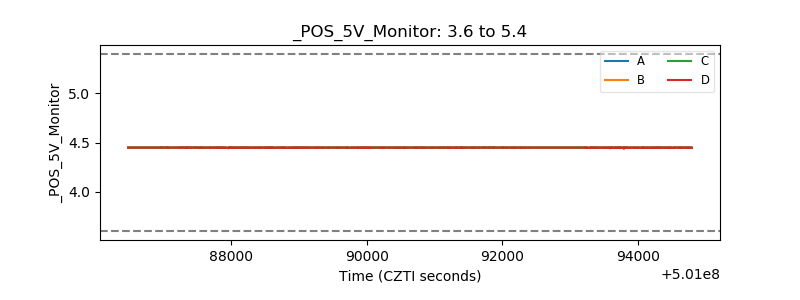 |
| _ROLL_ROT | 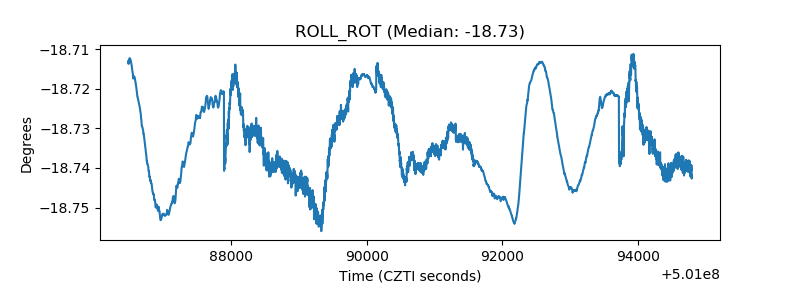 |
| _Roll_DEC | 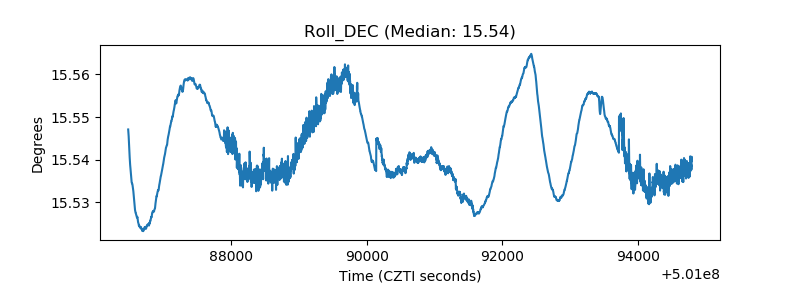 |
| _Roll_RA | 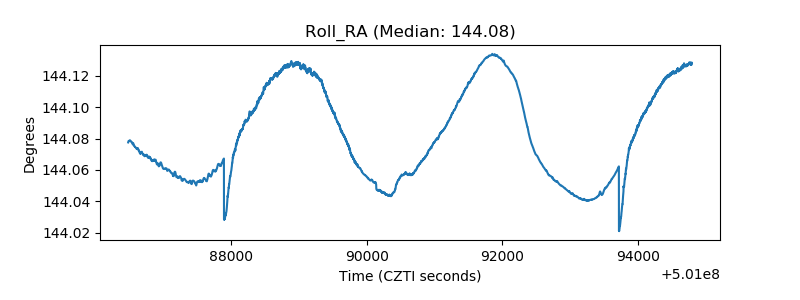 |
| Veto Counter | 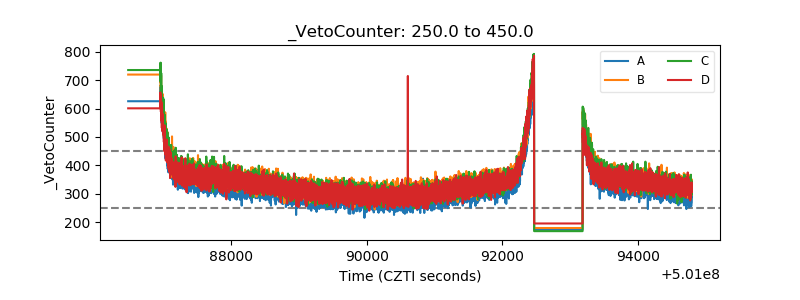 |