| Param | Original file | Final file |
|---|---|---|
| Filename | modeM0/AS1A14_039T06_9000006526_54855cztM0_level2.fits | modeM0/AS1A14_039T06_9000006526_54855cztM0_level2_quad_clean.evt |
| Size (bytes) | 483,258,240 | 124,058,880 |
| Size | 460.9 MB | 118.3 MB |
| Events in quadrant A | 3,880,795 | 812,739 |
| Events in quadrant B | 4,352,106 | 859,989 |
| Events in quadrant C | 4,241,587 | 766,272 |
| Events in quadrant D | 4,748,164 | 722,492 |
| Mode M9 | |||
|---|---|---|---|
| Quadrant | BADHDUFLAG | Total packets | Discarded packets |
| A | 0 | 2 | 0 |
| B | 0 | 2 | 0 |
| C | 0 | 2 | 0 |
| D | 0 | 2 | 0 |
| Mode M0 | |||
|---|---|---|---|
| Quadrant | BADHDUFLAG | Total packets | Discarded packets |
| A | 0 | 17929 | 2 |
| B | 0 | 19323 | 2 |
| C | 0 | 19046 | 2 |
| D | 0 | 20171 | 2 |
| Mode SS | |||
|---|---|---|---|
| Quadrant | BADHDUFLAG | Total packets | Discarded packets |
| A | 0 | 174 | 0 |
| B | 0 | 174 | 0 |
| C | 0 | 174 | 0 |
| D | 0 | 174 | 0 |
| Quadrant | Total seconds | Saturated seconds | Saturation percentage |
|---|---|---|---|
| A | 8564 | 59 | 0.688930% |
| B | 8565 | 224 | 2.615295% |
| C | 8565 | 131 | 1.529480% |
| D | 8564 | 144 | 1.681457% |
Noise dominated data is calculated using 1-second bins in cleaned event files. If a bin has >2000 counts, and if more than 50% of those come from <1% of pixels, then it is considered to be noise-dominated and hence unusable.
| Quadrant | # 1 sec bins | Bins with >0 counts | Bins with >2000 counts | High rate bins dominated by noise | Noise dominated (total time) | Noise dominated (detector-on time) | Marked lightcurve |
|---|---|---|---|---|---|---|---|
| A | 8739 | 8566 | 4 | 4 | 0.05% | 0.05% | 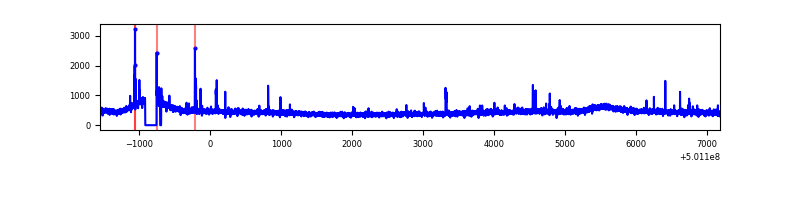 |
| B | 8740 | 8567 | 69 | 69 | 0.79% | 0.81% | 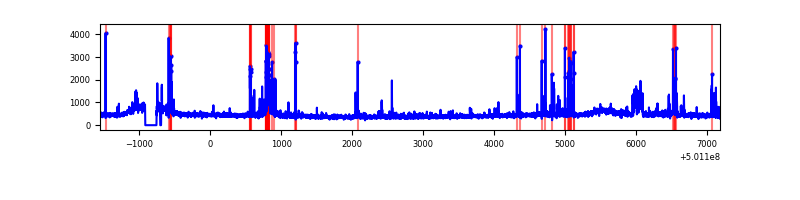 |
| C | 8740 | 8567 | 48 | 48 | 0.55% | 0.56% | 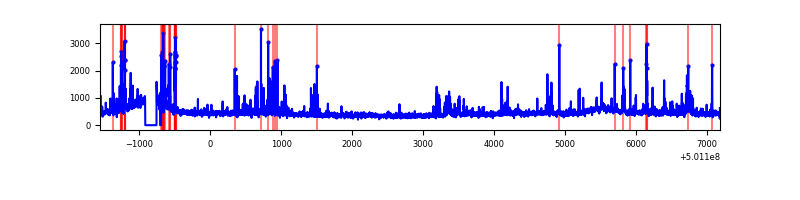 |
| D | 8739 | 8566 | 71 | 71 | 0.81% | 0.83% | 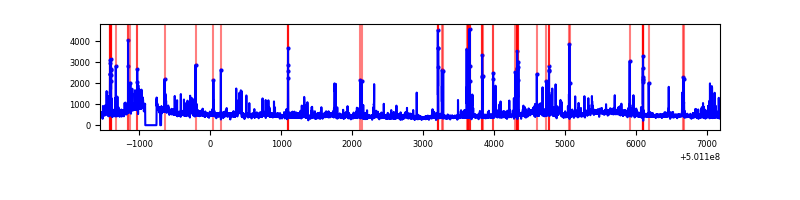 |
Top three noisy pixels from each quadrant. If the there are fewer than three noisy pixels in the level2.evt file, extra rows are filled as -1
| Pixel properties | Quadrant properties | ||||||
|---|---|---|---|---|---|---|---|
| Quadrant | DetID | PixID | Counts | Sigma | Mean | Median | Sigma |
| A | 3 | 14 | 49878 | 207.13 | 954 | 930 | 236.3 |
| A | 4 | 3 | 26489 | 108.16 | 954 | 930 | 236.3 |
| A | 13 | 248 | 21258 | 86.02 | 954 | 930 | 236.3 |
| B | 5 | 185 | 296849 | 1465.0 | 933 | 897 | 202.0 |
| B | 10 | 247 | 100240 | 491.76 | 933 | 897 | 202.0 |
| B | 5 | 236 | 96042 | 470.98 | 933 | 897 | 202.0 |
| C | 4 | 5 | 161062 | 642.69 | 921 | 914 | 249.2 |
| C | 12 | 252 | 147441 | 588.03 | 921 | 914 | 249.2 |
| C | 15 | 209 | 140698 | 560.97 | 921 | 914 | 249.2 |
| D | 10 | 181 | 265978 | 1015.48 | 924 | 886 | 261.1 |
| D | 15 | 42 | 128155 | 487.52 | 924 | 886 | 261.1 |
| D | 3 | 12 | 123385 | 469.25 | 924 | 886 | 261.1 |
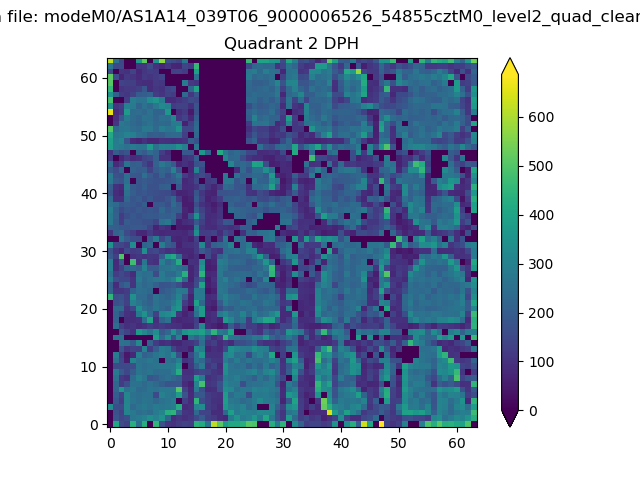
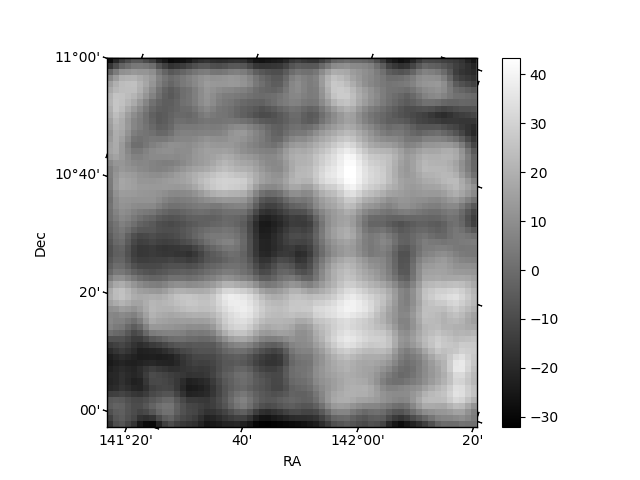
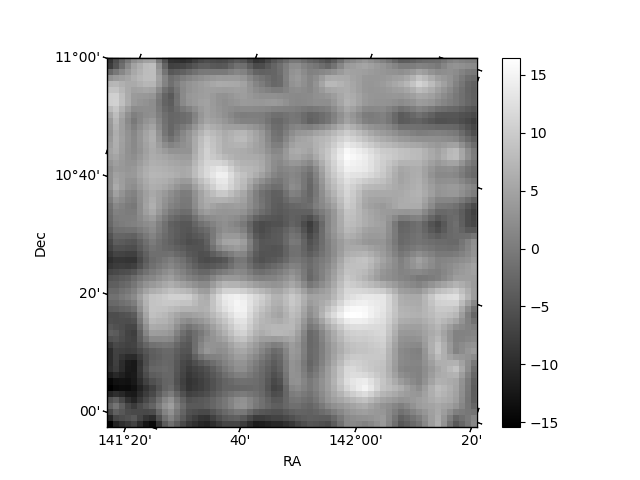
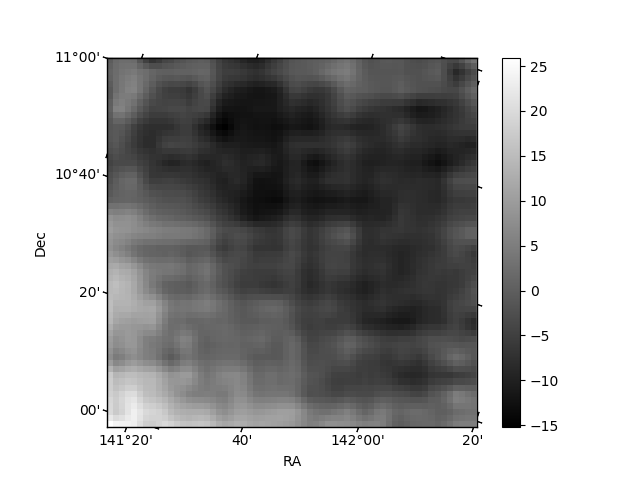
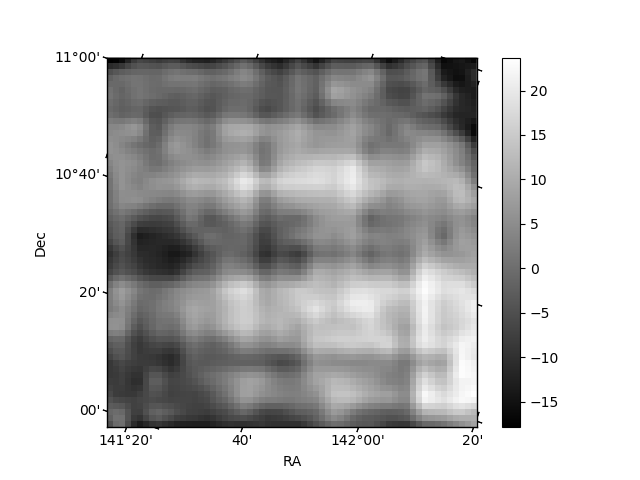
Histogram calculated using DETX and DETY for each event in the final _common_clean file
| Quadrant A | 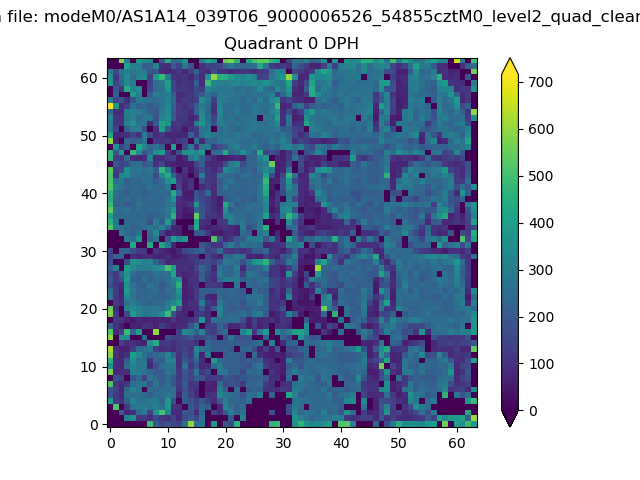 |
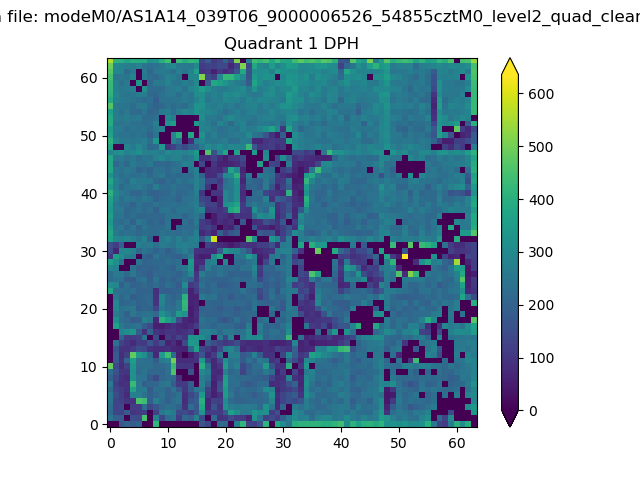 |
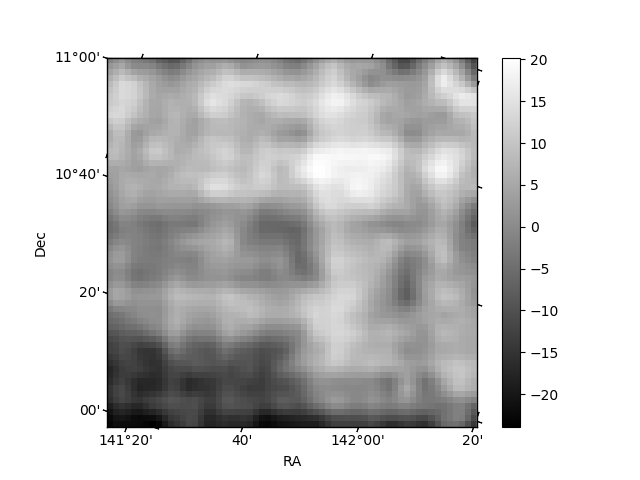
Quadrant B |
|---|---|---|---|
| Quadrant D | 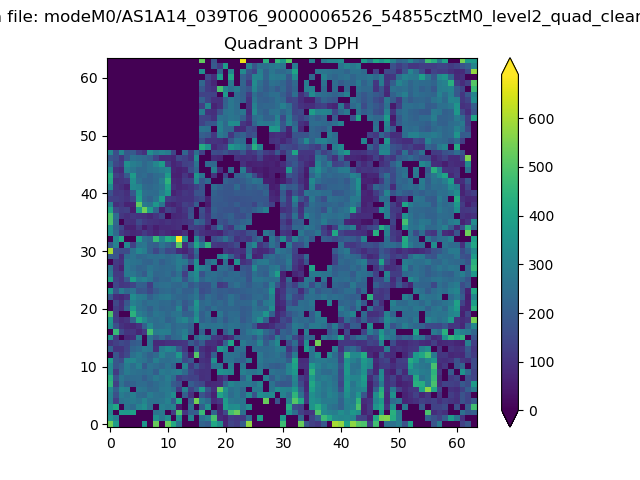 |
 |
Quadrant C |
| Plot type | Count rate plots | Images |
|---|---|---|
| Comparison with Poisson distribution Blue bars denote a histogram of data divided into 1 sec bins. Red curve is a Poisson curve with rate = median count rate of data. |
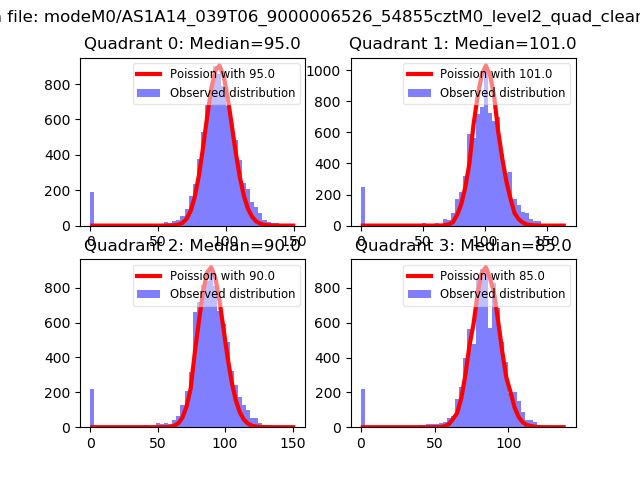 |
 |
| Quadrant-wise count rates Data is divided into 100 sec bins |
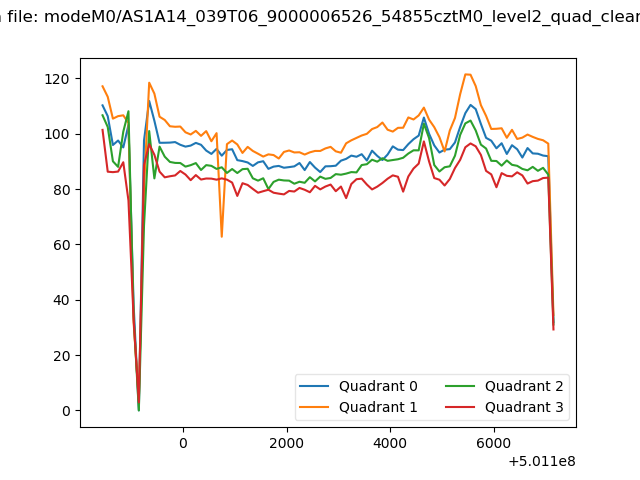 |
|
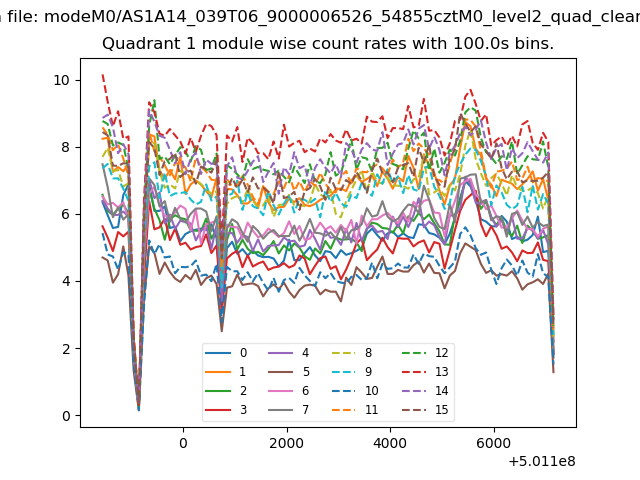
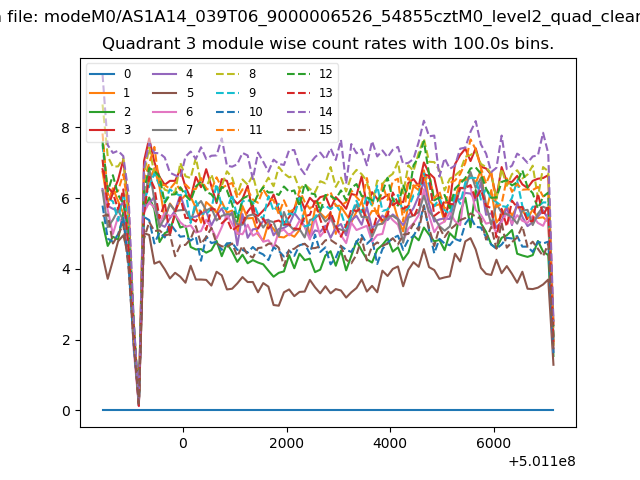
| Module-wise count rates for Quadrant A Data is divided into 100 sec bins |
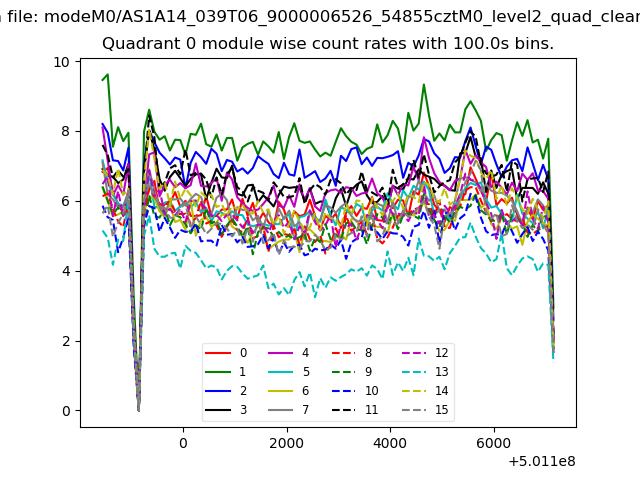 |
 |
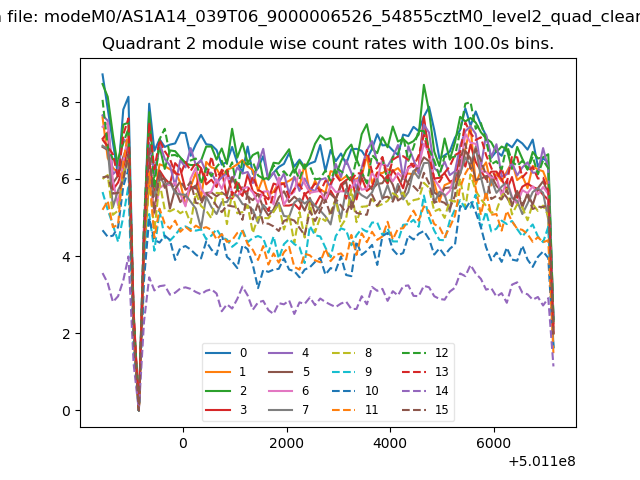
| Module-wise count rates for Quadrant B Data is divided into 100 sec bins |
 |
 |
| Module-wise count rates for Quadrant C Data is divided into 100 sec bins |
 |
 |
| Module-wise count rates for Quadrant D Data is divided into 100 sec bins |
 |
 |
| Parameter | Plot |
|---|---|
| CZT HV Monitor | 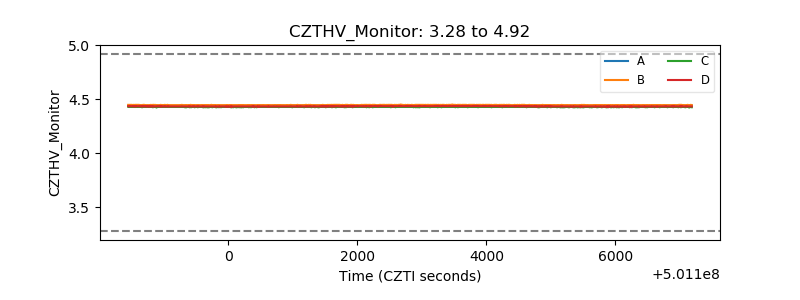 |
| D_VDD | 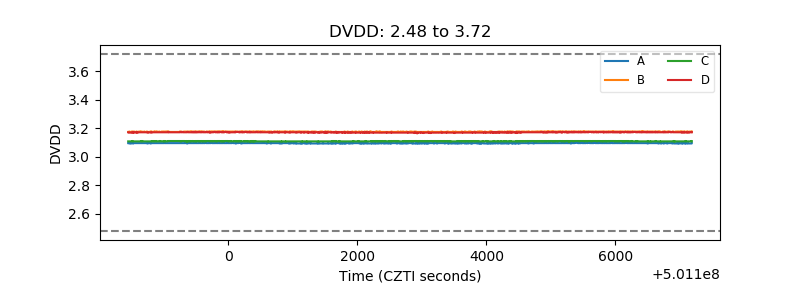 |
| Temperature 1 | 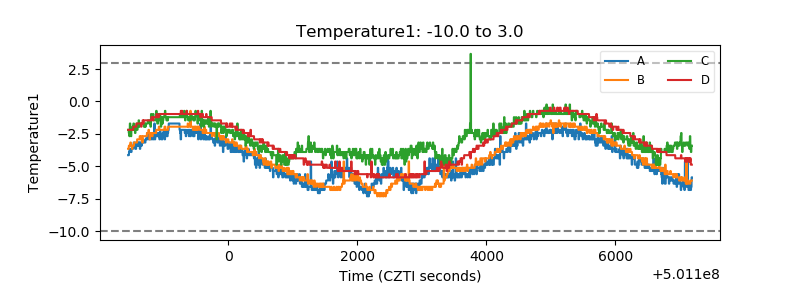 |
| Veto HV Monitor |  |
| Veto LLD | 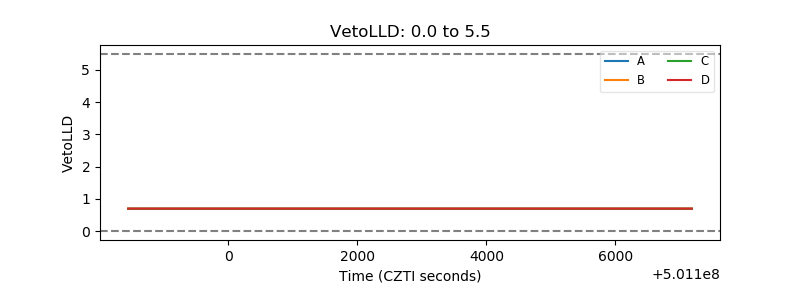 |
| Alpha Counter | 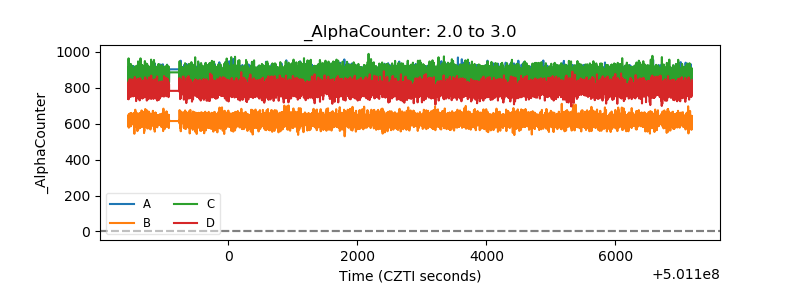 |
| _CPM_Rate | 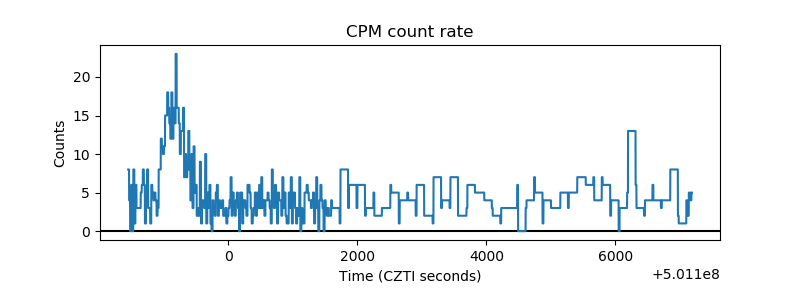 |
| CZT Counter | 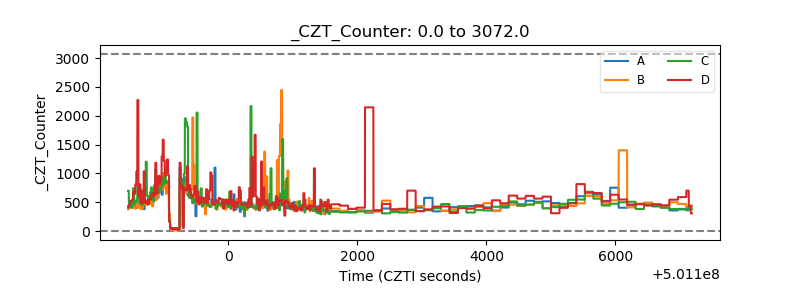 |
| +2.5 Volts monitor |  |
| +5 Volts monitor |  |
| _ROLL_ROT | 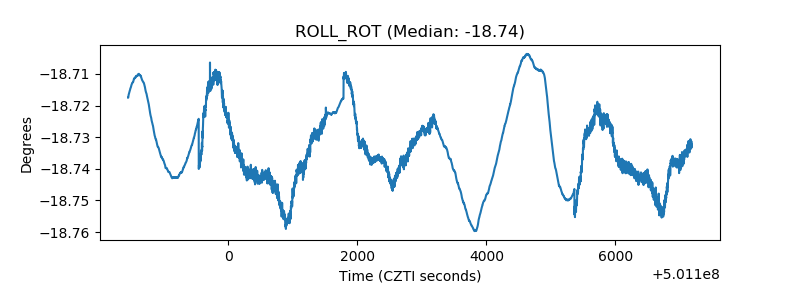 |
| _Roll_DEC | 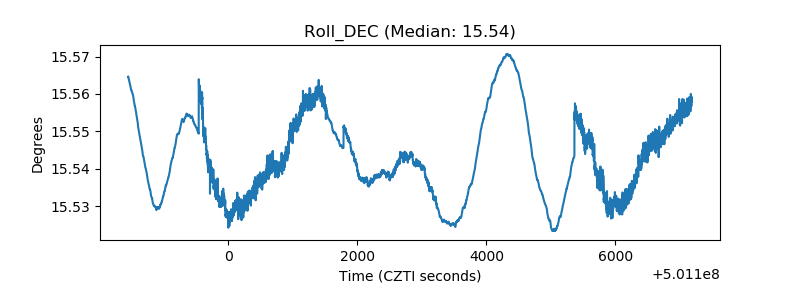 |
| _Roll_RA | 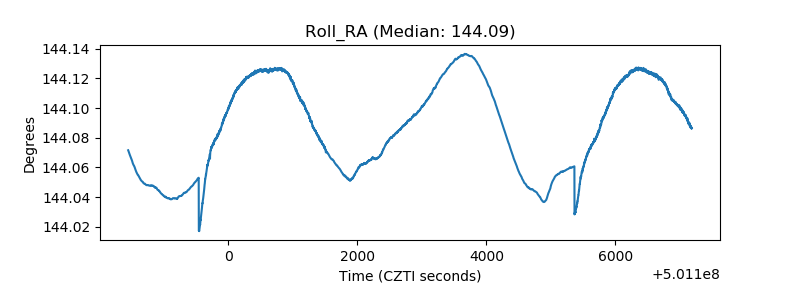 |
| Veto Counter | 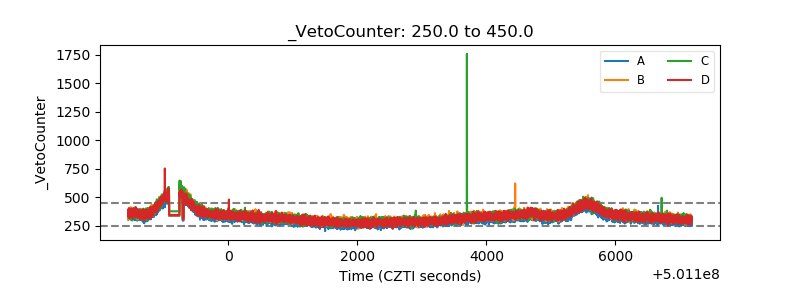 |