| Param | Original file | Final file |
|---|---|---|
| Filename | modeM0/AS1A14_039T06_9000006526_54856cztM0_level2.fits | modeM0/AS1A14_039T06_9000006526_54856cztM0_level2_quad_clean.evt |
| Size (bytes) | 492,039,360 | 119,859,840 |
| Size | 469.2 MB | 114.3 MB |
| Events in quadrant A | 3,775,164 | 795,332 |
| Events in quadrant B | 4,533,668 | 812,320 |
| Events in quadrant C | 4,696,949 | 734,776 |
| Events in quadrant D | 4,557,011 | 705,654 |
| Mode M0 | |||
|---|---|---|---|
| Quadrant | BADHDUFLAG | Total packets | Discarded packets |
| A | 0 | 17539 | 0 |
| B | 0 | 19727 | 0 |
| C | 0 | 20032 | 0 |
| D | 0 | 19730 | 0 |
| Mode SS | |||
|---|---|---|---|
| Quadrant | BADHDUFLAG | Total packets | Discarded packets |
| A | 0 | 166 | 0 |
| B | 0 | 166 | 0 |
| C | 0 | 166 | 0 |
| D | 0 | 166 | 0 |
| Quadrant | Total seconds | Saturated seconds | Saturation percentage |
|---|---|---|---|
| A | 8371 | 18 | 0.215028% |
| B | 8371 | 381 | 4.551428% |
| C | 8372 | 206 | 2.460583% |
| D | 8372 | 133 | 1.588629% |
Noise dominated data is calculated using 1-second bins in cleaned event files. If a bin has >2000 counts, and if more than 50% of those come from <1% of pixels, then it is considered to be noise-dominated and hence unusable.
| Quadrant | # 1 sec bins | Bins with >0 counts | Bins with >2000 counts | High rate bins dominated by noise | Noise dominated (total time) | Noise dominated (detector-on time) | Marked lightcurve |
|---|---|---|---|---|---|---|---|
| A | 8371 | 8371 | 7 | 7 | 0.08% | 0.08% | 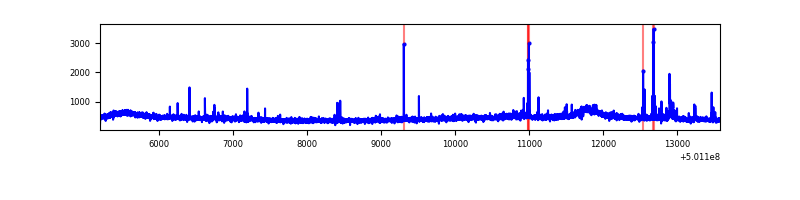 |
| B | 8371 | 8371 | 176 | 176 | 2.10% | 2.10% | 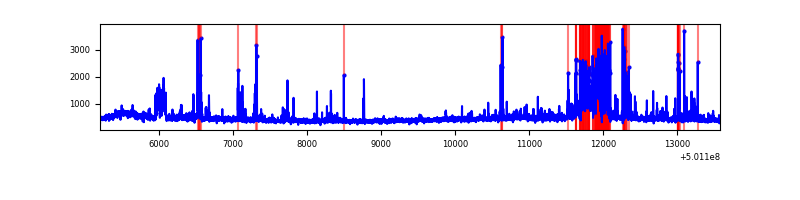 |
| C | 8372 | 8372 | 127 | 127 | 1.52% | 1.52% | 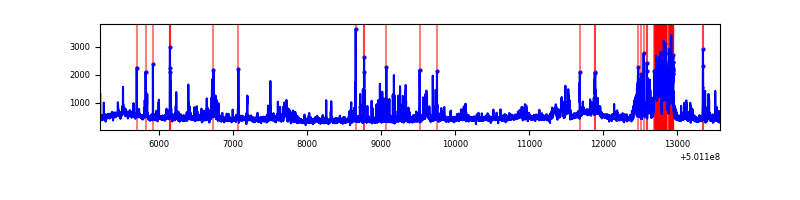 |
| D | 8372 | 8372 | 99 | 99 | 1.18% | 1.18% | 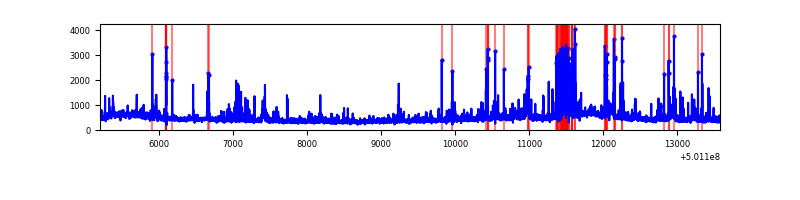 |
Top three noisy pixels from each quadrant. If the there are fewer than three noisy pixels in the level2.evt file, extra rows are filled as -1
| Pixel properties | Quadrant properties | ||||||
|---|---|---|---|---|---|---|---|
| Quadrant | DetID | PixID | Counts | Sigma | Mean | Median | Sigma |
| A | 3 | 14 | 95618 | 417.75 | 911 | 886 | 226.8 |
| A | 3 | 61 | 39893 | 172.01 | 911 | 886 | 226.8 |
| A | 8 | 206 | 31872 | 136.64 | 911 | 886 | 226.8 |
| B | 5 | 185 | 638998 | 3372.21 | 879 | 847 | 189.2 |
| B | 10 | 247 | 155690 | 818.24 | 879 | 847 | 189.2 |
| B | 5 | 236 | 104642 | 548.49 | 879 | 847 | 189.2 |
| C | 15 | 209 | 596537 | 2450.89 | 878 | 869 | 243.0 |
| C | 12 | 252 | 289528 | 1187.69 | 878 | 869 | 243.0 |
| C | 14 | 254 | 136745 | 559.06 | 878 | 869 | 243.0 |
| D | 12 | 6 | 254134 | 1011.57 | 879 | 843 | 250.4 |
| D | 10 | 181 | 222379 | 884.75 | 879 | 843 | 250.4 |
| D | 11 | 129 | 96091 | 380.39 | 879 | 843 | 250.4 |
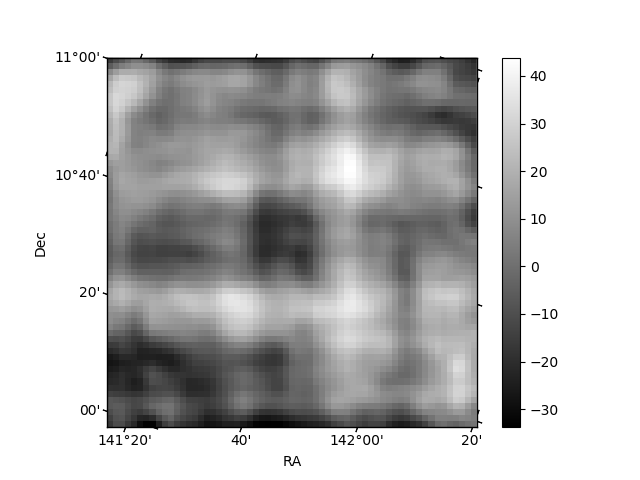
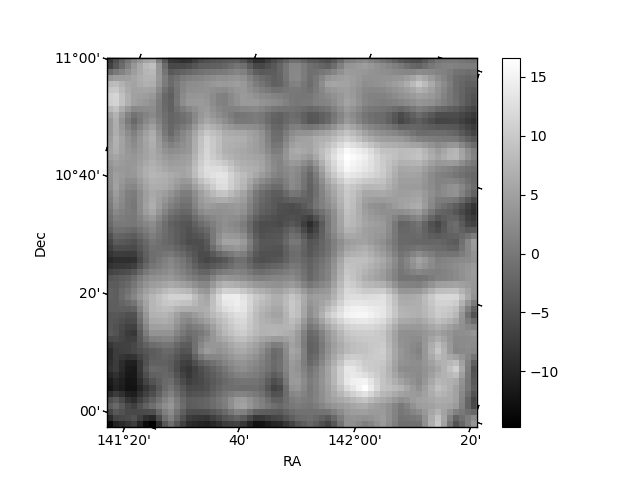
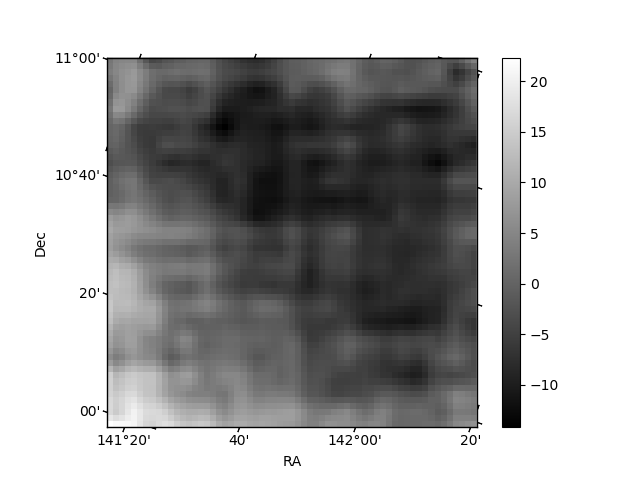
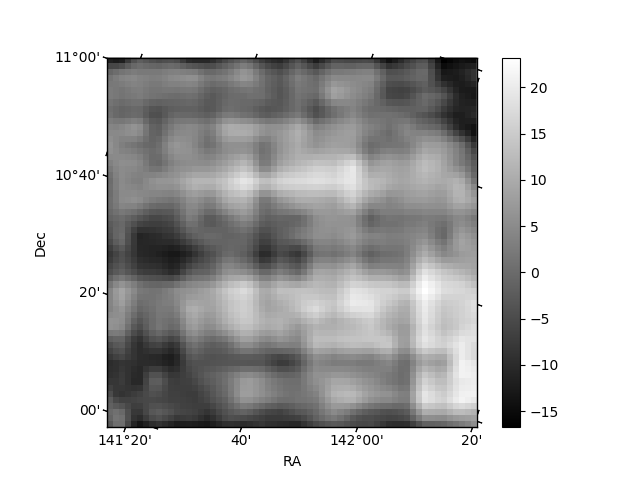
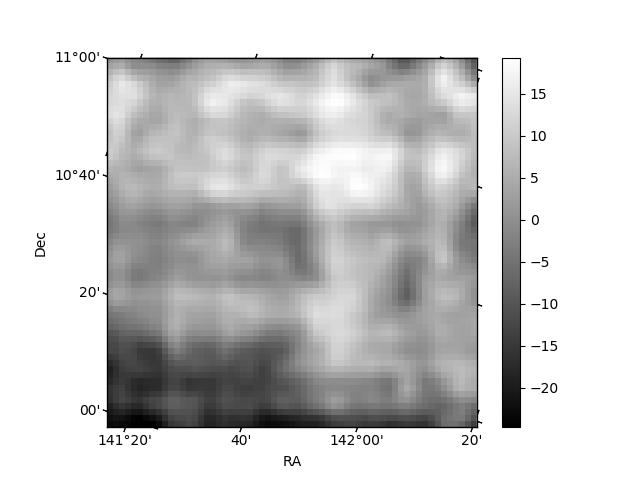
Histogram calculated using DETX and DETY for each event in the final _common_clean file
| Quadrant A | 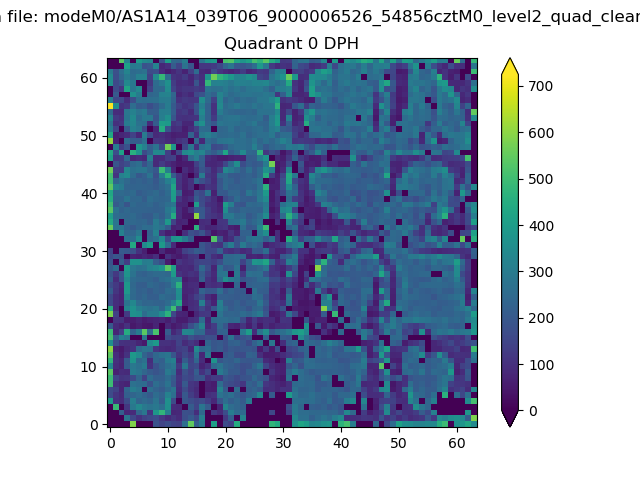 |
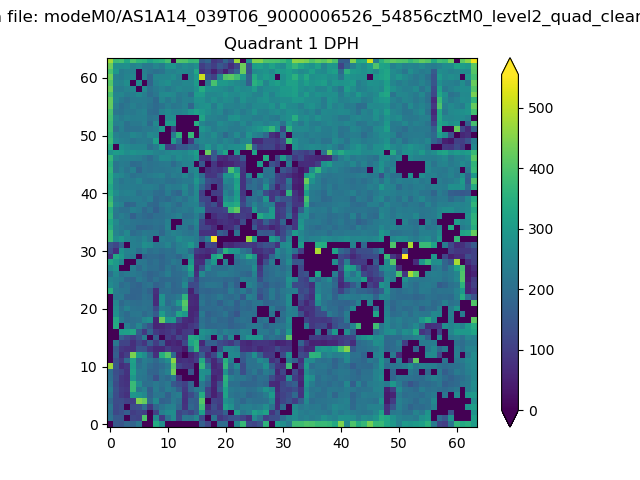 |
Quadrant B |
|---|---|---|---|
| Quadrant D | 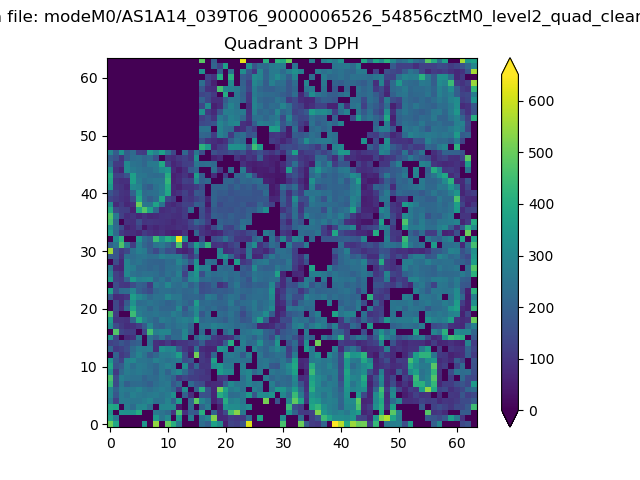 |
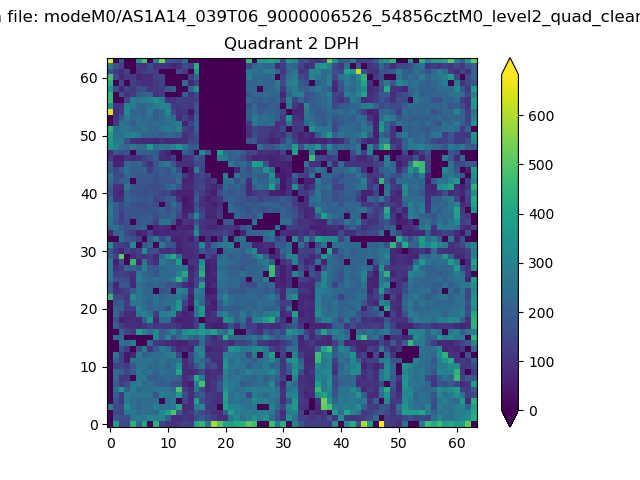 |
Quadrant C |
| Plot type | Count rate plots | Images |
|---|---|---|
| Comparison with Poisson distribution Blue bars denote a histogram of data divided into 1 sec bins. Red curve is a Poisson curve with rate = median count rate of data. |
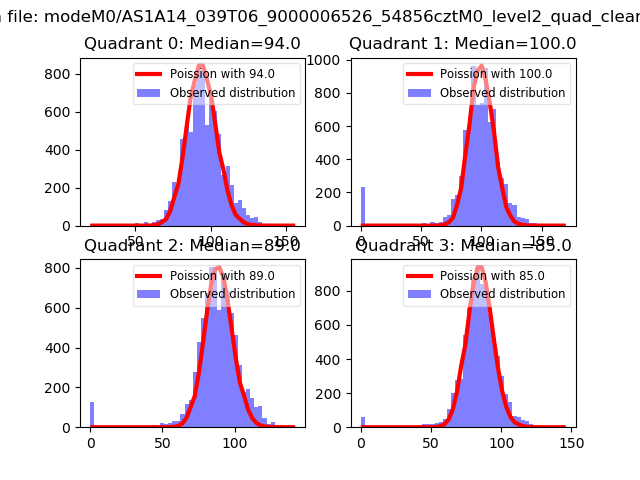 |
 |
| Quadrant-wise count rates Data is divided into 100 sec bins |
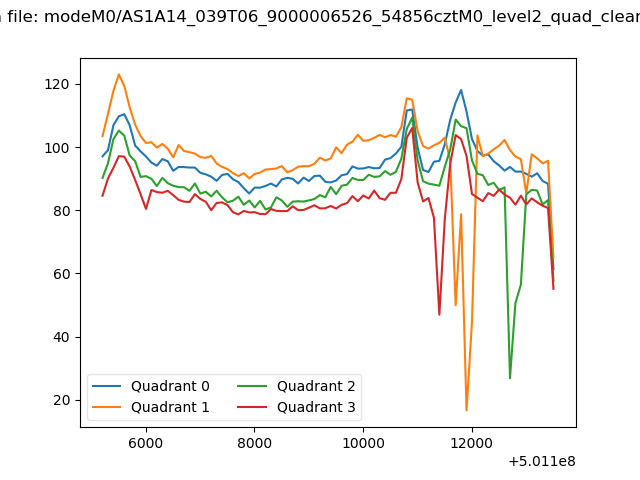 |
|
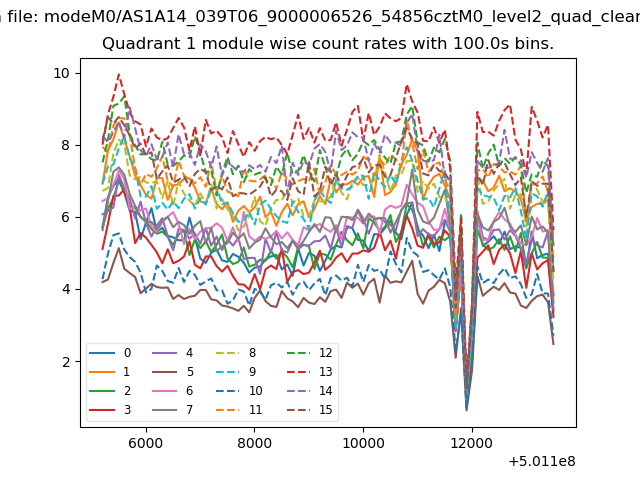
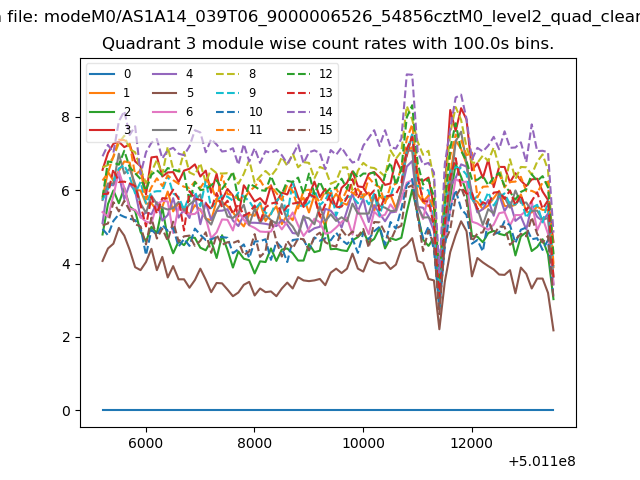
| Module-wise count rates for Quadrant A Data is divided into 100 sec bins |
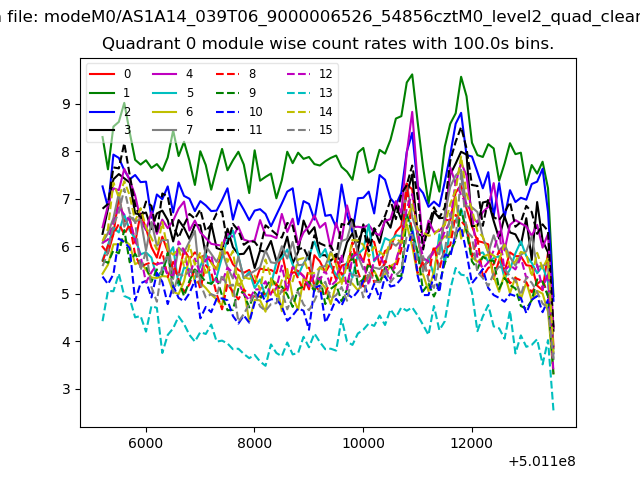 |
 |
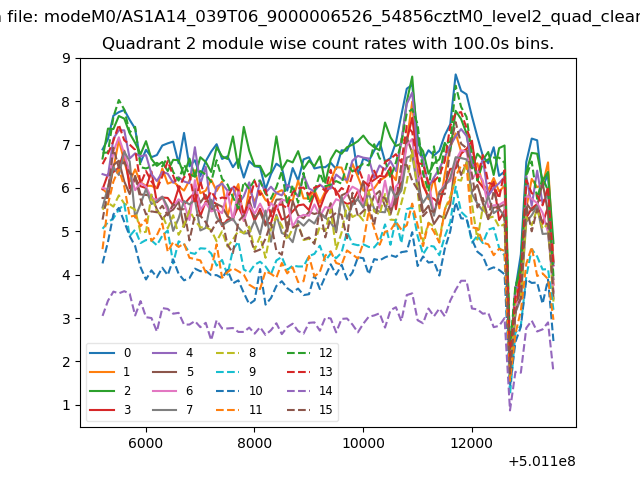
| Module-wise count rates for Quadrant B Data is divided into 100 sec bins |
 |
 |
| Module-wise count rates for Quadrant C Data is divided into 100 sec bins |
 |
 |
| Module-wise count rates for Quadrant D Data is divided into 100 sec bins |
 |
 |
| Parameter | Plot |
|---|---|
| CZT HV Monitor | 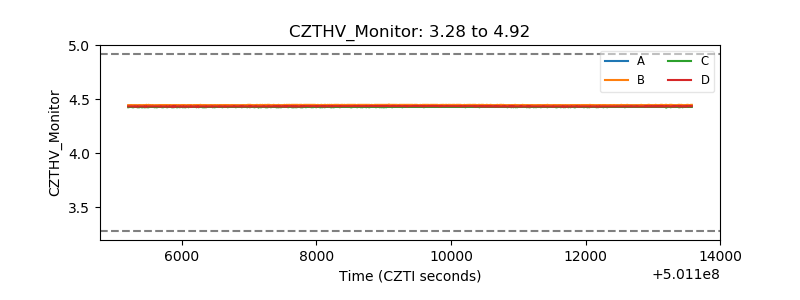 |
| D_VDD | 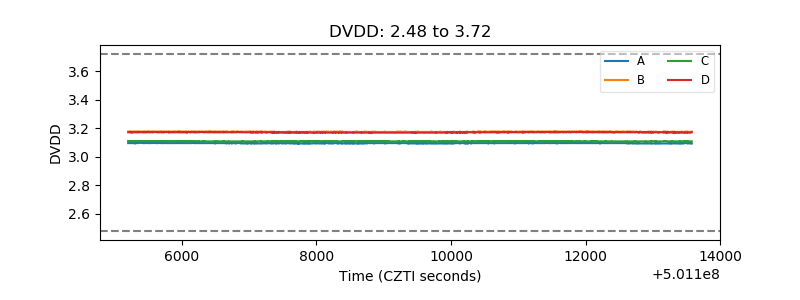 |
| Temperature 1 | 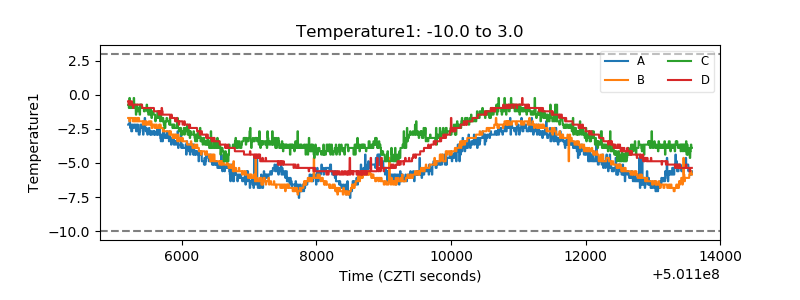 |
| Veto HV Monitor | 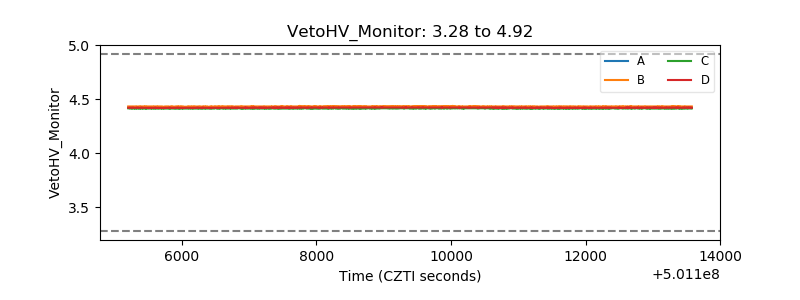 |
| Veto LLD | 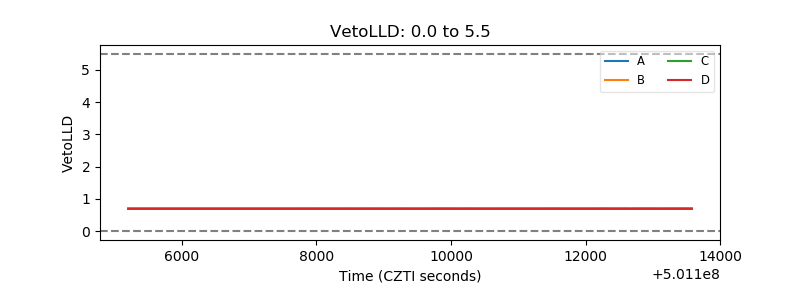 |
| Alpha Counter | 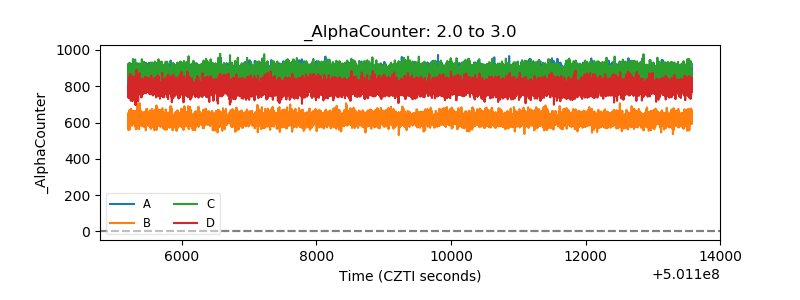 |
| _CPM_Rate | 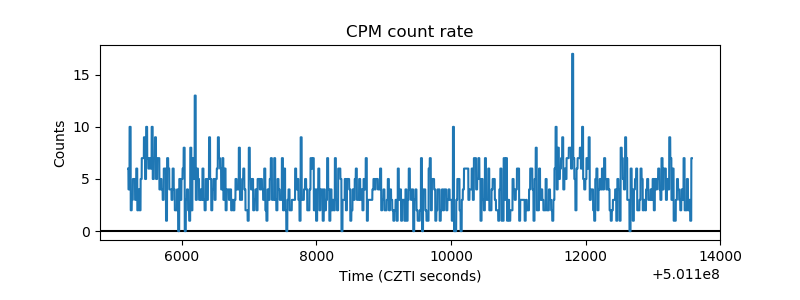 |
| CZT Counter | 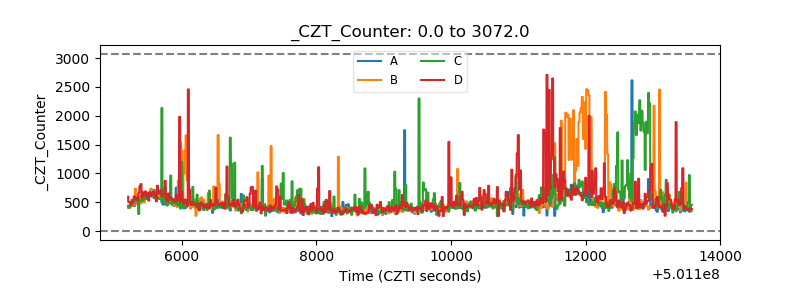 |
| +2.5 Volts monitor | 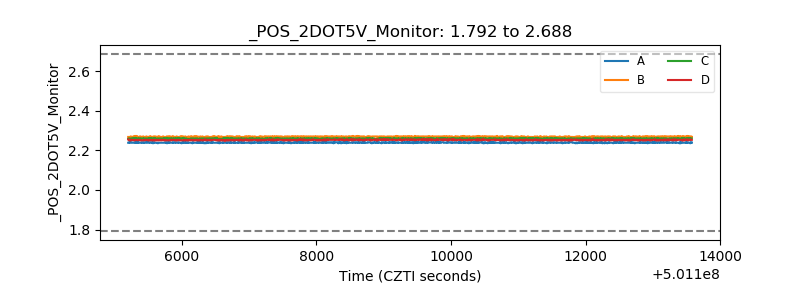 |
| +5 Volts monitor | 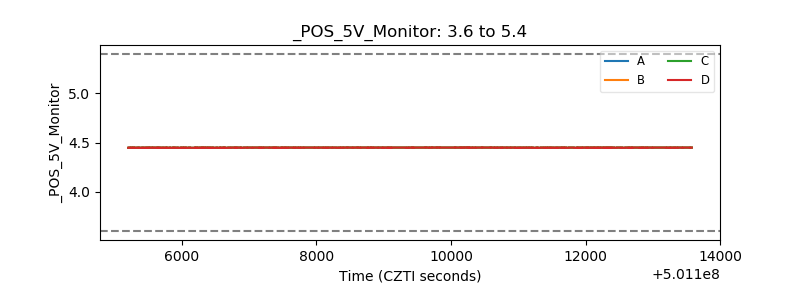 |
| _ROLL_ROT | 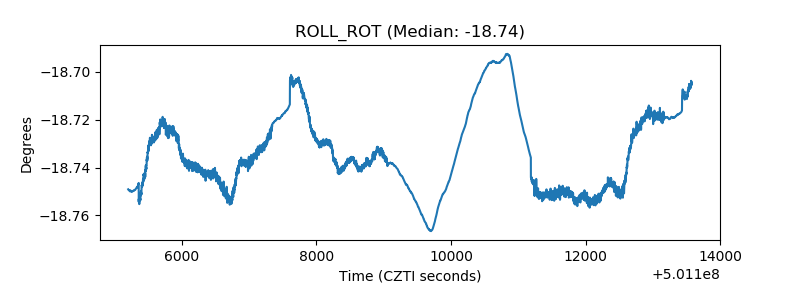 |
| _Roll_DEC | 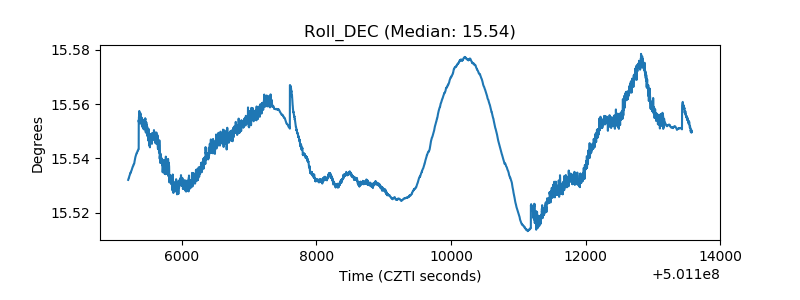 |
| _Roll_RA | 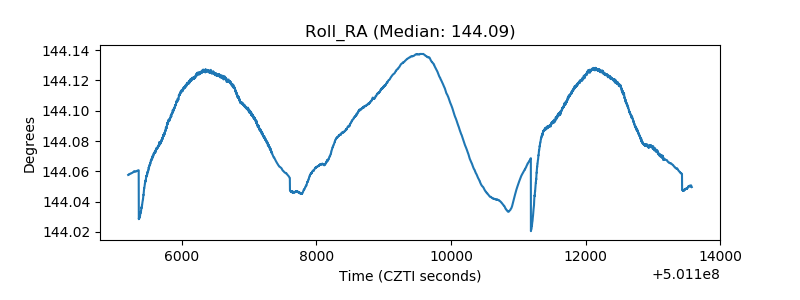 |
| Veto Counter | 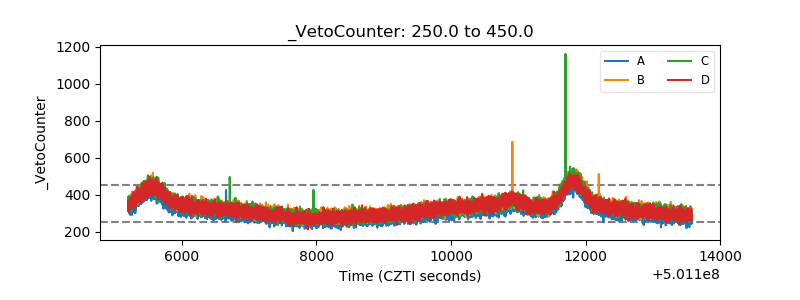 |