| Param | Original file | Final file |
|---|---|---|
| Filename | modeM0/AS1A14_039T06_9000006526_54859cztM0_level2.fits | modeM0/AS1A14_039T06_9000006526_54859cztM0_level2_quad_clean.evt |
| Size (bytes) | 1,222,205,760 | 271,857,600 |
| Size | 1.1 GB | 259.3 MB |
| Events in quadrant A | 9,606,744 | 1,773,986 |
| Events in quadrant B | 9,807,697 | 1,873,561 |
| Events in quadrant C | 11,624,115 | 1,673,341 |
| Events in quadrant D | 12,684,974 | 1,559,726 |
| Mode M9 | |||
|---|---|---|---|
| Quadrant | BADHDUFLAG | Total packets | Discarded packets |
| A | 0 | 11 | 0 |
| B | 0 | 11 | 0 |
| C | 0 | 11 | 0 |
| D | 0 | 11 | 0 |
| Mode M0 | |||
|---|---|---|---|
| Quadrant | BADHDUFLAG | Total packets | Discarded packets |
| A | 0 | 43925 | 33 |
| B | 0 | 44262 | 40 |
| C | 0 | 48948 | 55 |
| D | 0 | 52586 | 73 |
| Mode SS | |||
|---|---|---|---|
| Quadrant | BADHDUFLAG | Total packets | Discarded packets |
| A | 0 | 398 | 0 |
| B | 0 | 398 | 0 |
| C | 0 | 397 | 1 |
| D | 0 | 398 | 0 |
| Quadrant | Total seconds | Saturated seconds | Saturation percentage |
|---|---|---|---|
| A | 19602 | 448 | 2.285481% |
| B | 19598 | 658 | 3.357485% |
| C | 19598 | 593 | 3.025819% |
| D | 19599 | 919 | 4.689015% |
Noise dominated data is calculated using 1-second bins in cleaned event files. If a bin has >2000 counts, and if more than 50% of those come from <1% of pixels, then it is considered to be noise-dominated and hence unusable.
| Quadrant | # 1 sec bins | Bins with >0 counts | Bins with >2000 counts | High rate bins dominated by noise | Noise dominated (total time) | Noise dominated (detector-on time) | Marked lightcurve |
|---|---|---|---|---|---|---|---|
| A | 20829 | 19614 | 233 | 233 | 1.12% | 1.19% | 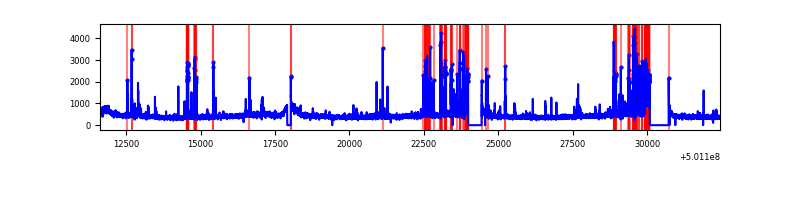 |
| B | 20830 | 19615 | 235 | 235 | 1.13% | 1.20% | 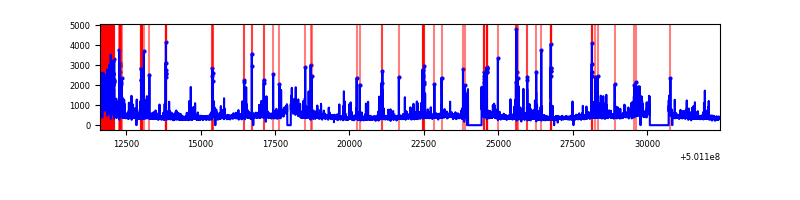 |
| C | 20830 | 19617 | 358 | 358 | 1.72% | 1.82% | 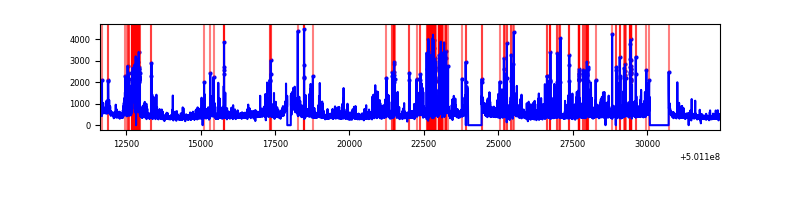 |
| D | 20830 | 19615 | 749 | 749 | 3.60% | 3.82% | 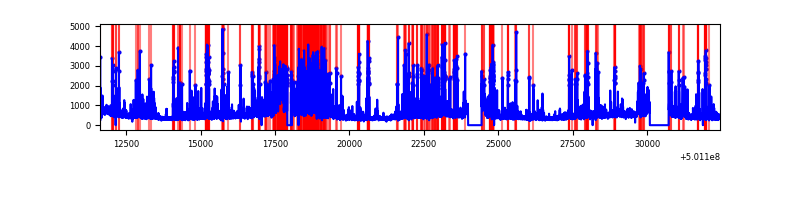 |
Top three noisy pixels from each quadrant. If the there are fewer than three noisy pixels in the level2.evt file, extra rows are filled as -1
| Pixel properties | Quadrant properties | ||||||
|---|---|---|---|---|---|---|---|
| Quadrant | DetID | PixID | Counts | Sigma | Mean | Median | Sigma |
| A | 13 | 248 | 768564 | 1499.79 | 2071 | 2015 | 511.1 |
| A | 8 | 249 | 231945 | 449.87 | 2071 | 2015 | 511.1 |
| A | 8 | 206 | 155559 | 300.42 | 2071 | 2015 | 511.1 |
| B | 5 | 185 | 881390 | 2004.62 | 2033 | 1957 | 438.7 |
| B | 10 | 247 | 415476 | 942.59 | 2033 | 1957 | 438.7 |
| B | 5 | 236 | 131510 | 295.31 | 2033 | 1957 | 438.7 |
| C | 12 | 252 | 1708723 | 3092.84 | 2001 | 1983 | 551.8 |
| C | 15 | 209 | 608645 | 1099.35 | 2001 | 1983 | 551.8 |
| C | 14 | 254 | 557278 | 1006.27 | 2001 | 1983 | 551.8 |
| D | 11 | 176 | 1578497 | 2787.27 | 1979 | 1896 | 565.6 |
| D | 11 | 129 | 1008228 | 1779.09 | 1979 | 1896 | 565.6 |
| D | 10 | 181 | 701989 | 1237.69 | 1979 | 1896 | 565.6 |
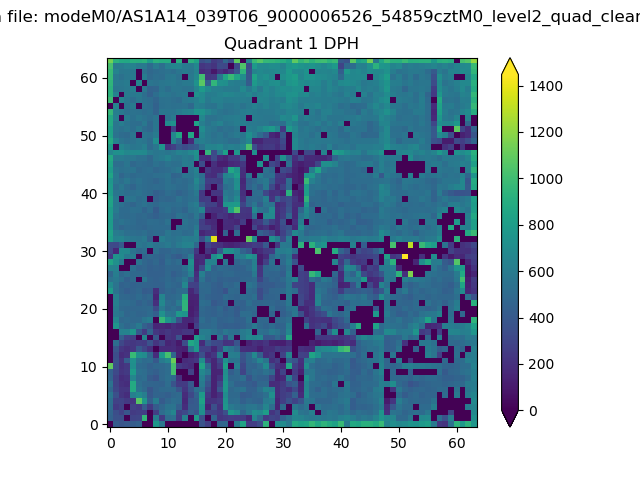
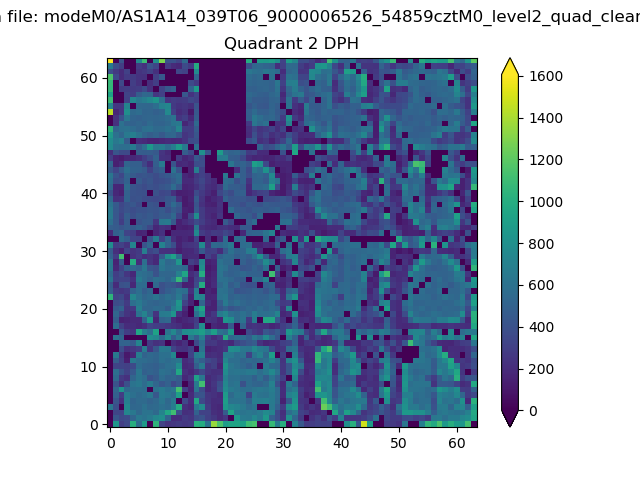
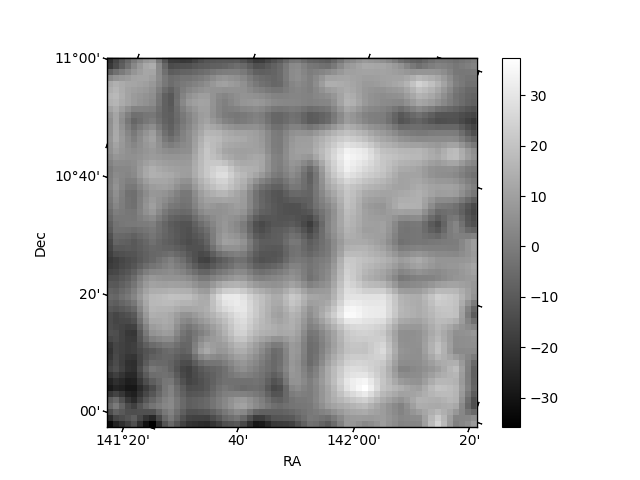
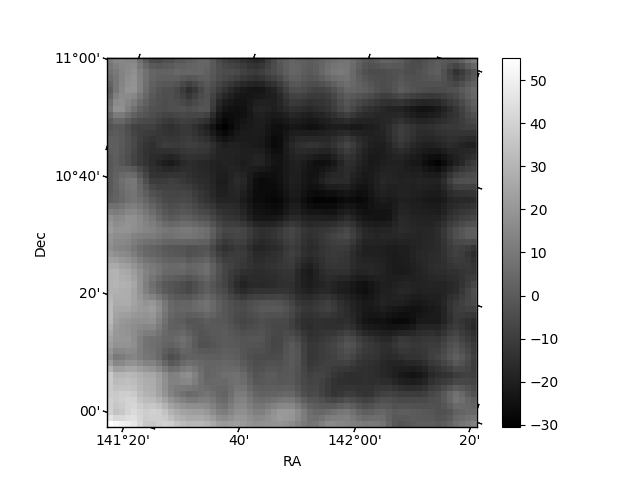
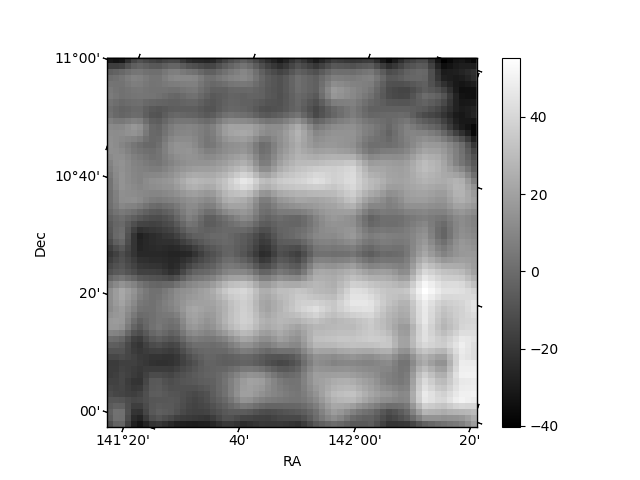
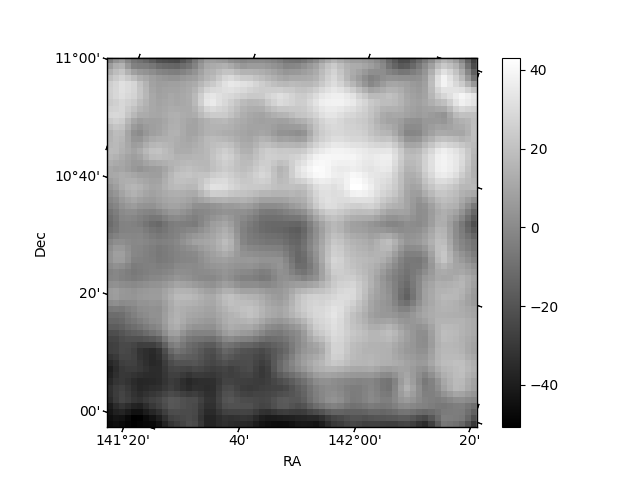
Histogram calculated using DETX and DETY for each event in the final _common_clean file
| Quadrant A |  |
 |
Quadrant B |
|---|---|---|---|
| Quadrant D | 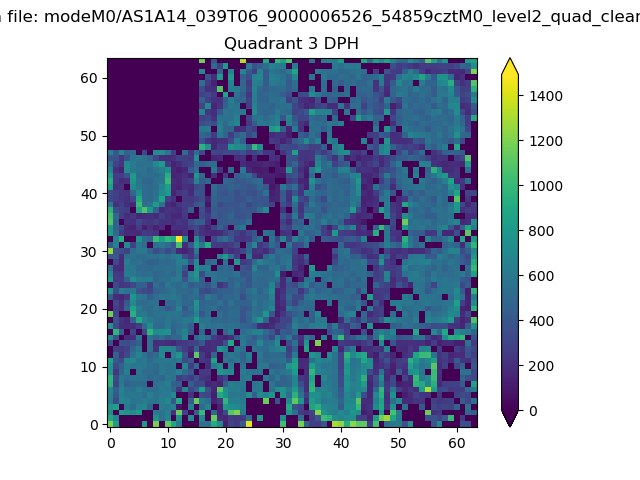 |
 |
Quadrant C |
| Plot type | Count rate plots | Images |
|---|---|---|
| Comparison with Poisson distribution Blue bars denote a histogram of data divided into 1 sec bins. Red curve is a Poisson curve with rate = median count rate of data. |
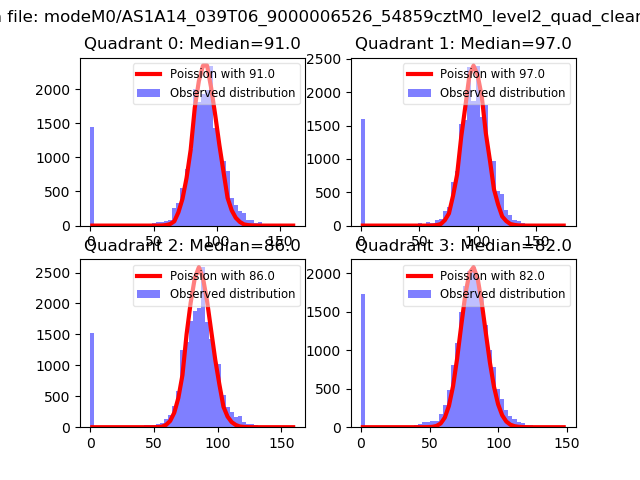 |
 |
| Quadrant-wise count rates Data is divided into 100 sec bins |
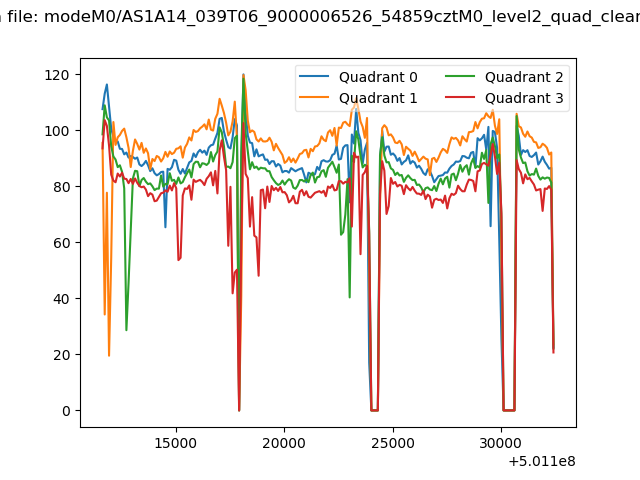 |
|
| Module-wise count rates for Quadrant A Data is divided into 100 sec bins |
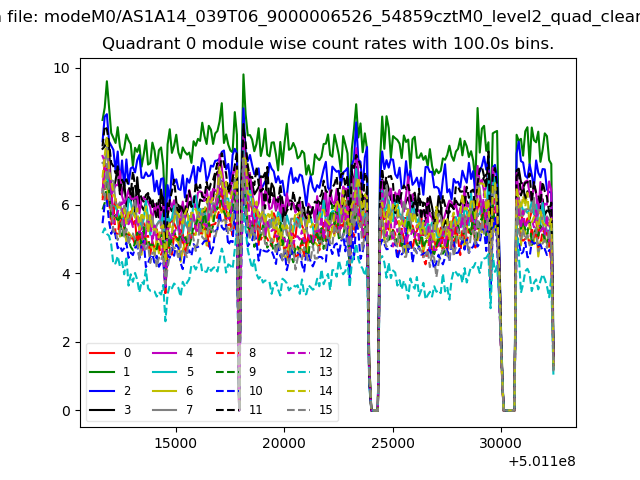 |
 |
| Module-wise count rates for Quadrant B Data is divided into 100 sec bins |
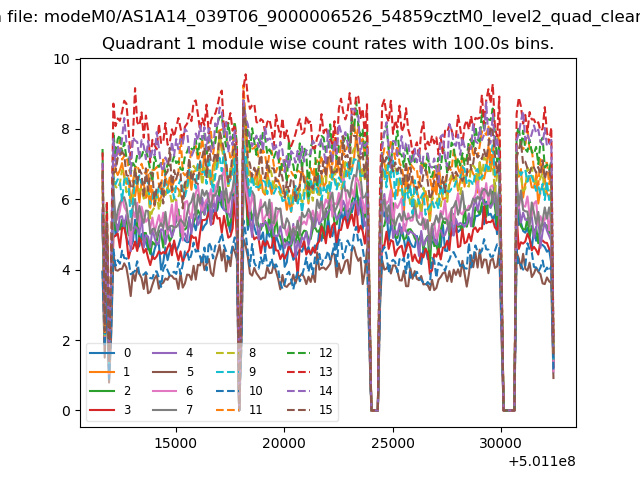 |
 |
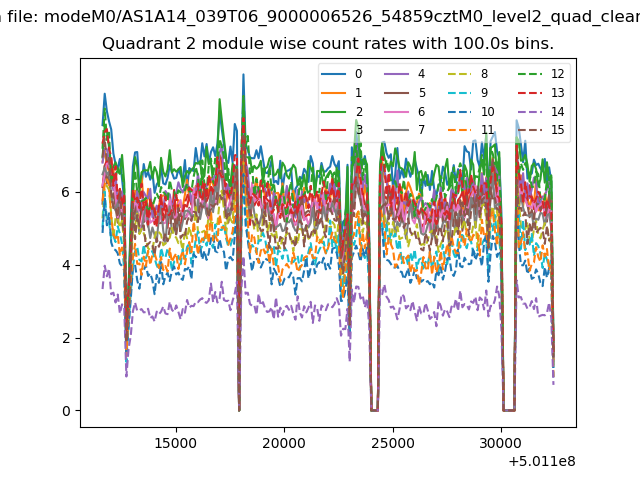
| Module-wise count rates for Quadrant C Data is divided into 100 sec bins |
 |
 |
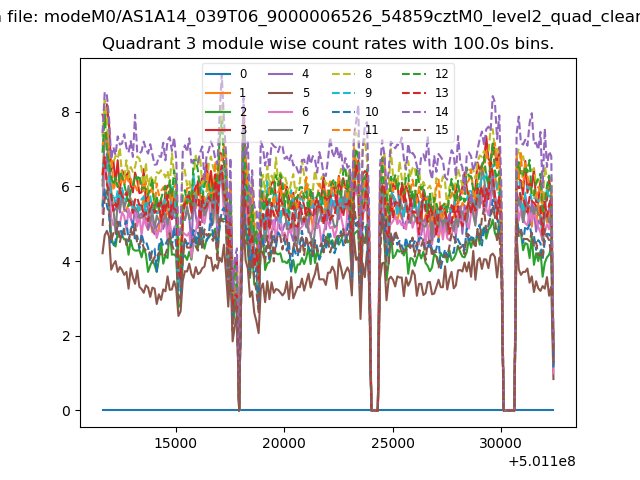
| Module-wise count rates for Quadrant D Data is divided into 100 sec bins |
 |
 |
| Parameter | Plot |
|---|---|
| CZT HV Monitor | 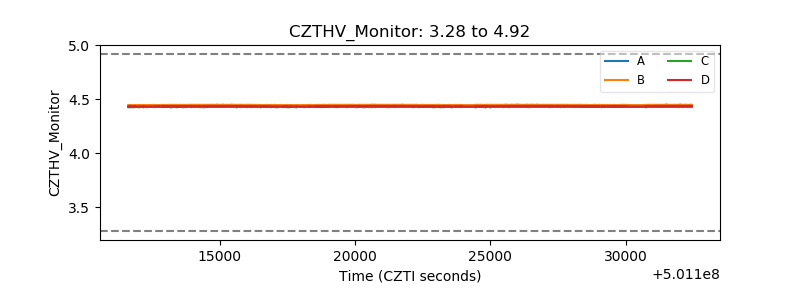 |
| D_VDD | 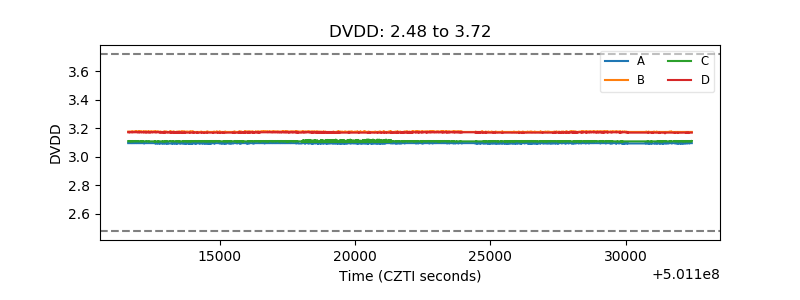 |
| Temperature 1 | 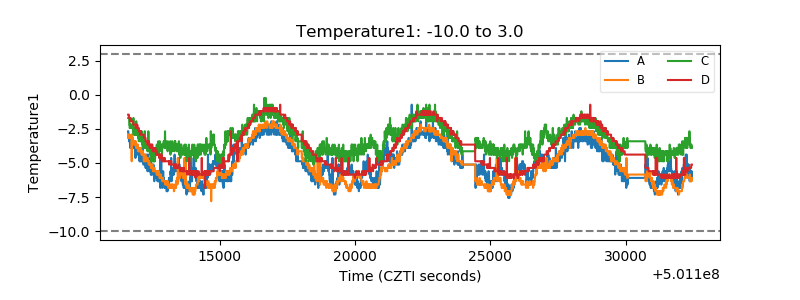 |
| Veto HV Monitor | 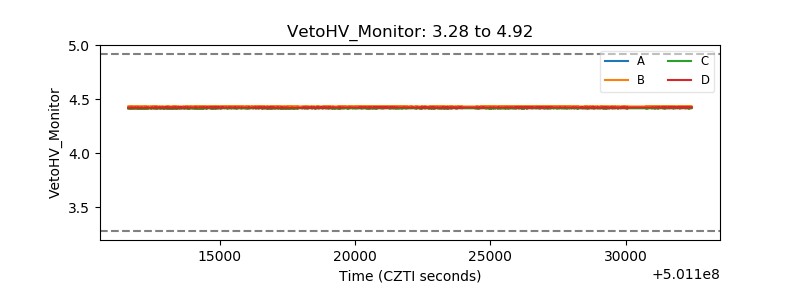 |
| Veto LLD | 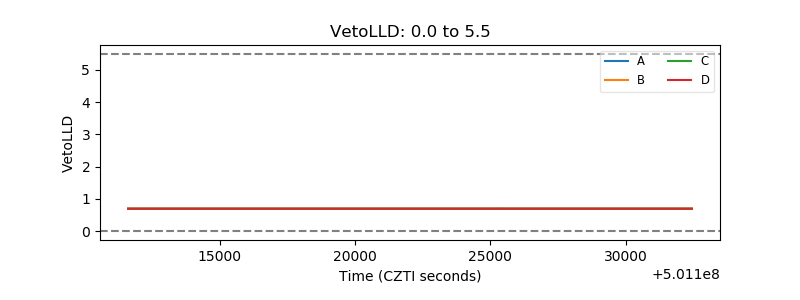 |
| Alpha Counter | 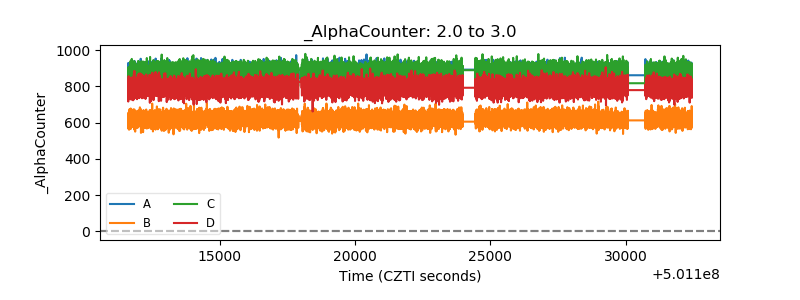 |
| _CPM_Rate | 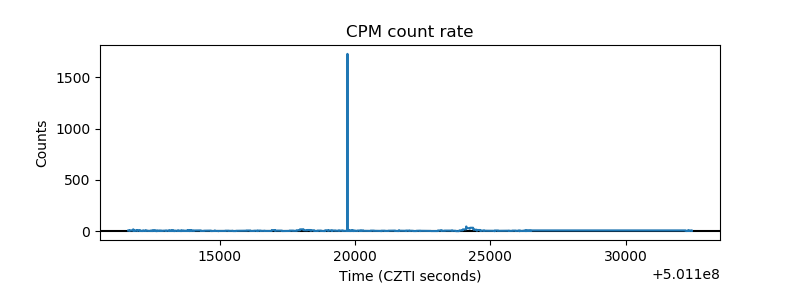 |
| CZT Counter | 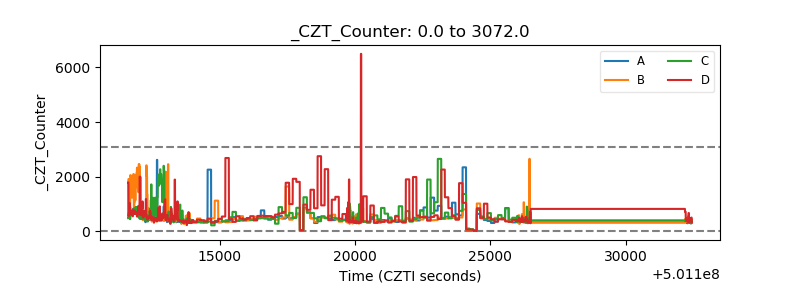 |
| +2.5 Volts monitor |  |
| +5 Volts monitor | 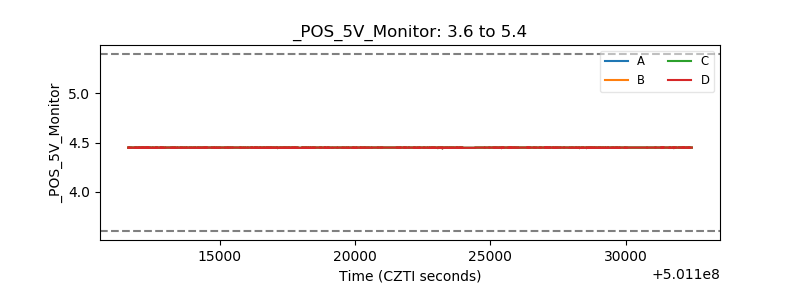 |
| _ROLL_ROT | 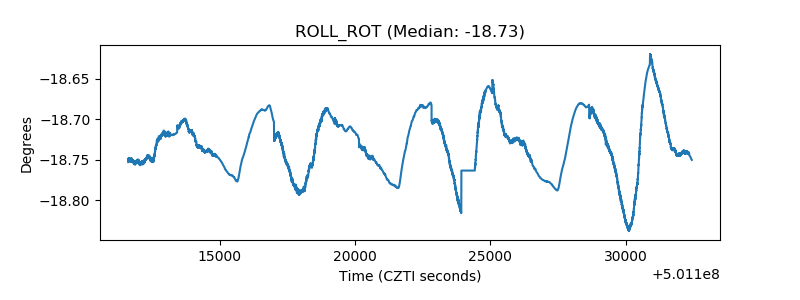 |
| _Roll_DEC | 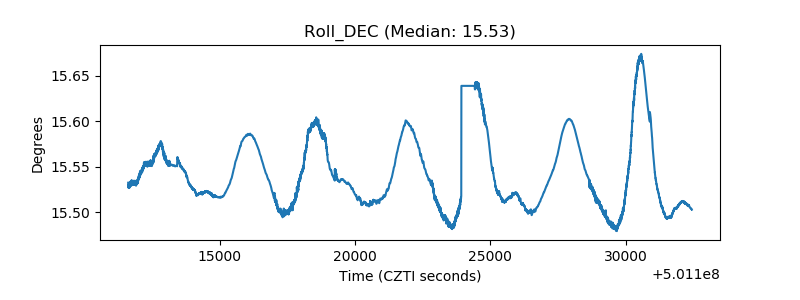 |
| _Roll_RA |  |
| Veto Counter | 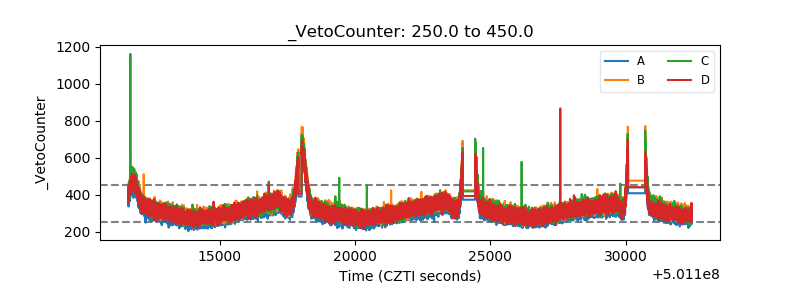 |