| Param | Original file | Final file |
|---|---|---|
| Filename | modeM0/AS1A14_039T06_9000006526_54860cztM0_level2.fits | modeM0/AS1A14_039T06_9000006526_54860cztM0_level2_quad_clean.evt |
| Size (bytes) | 424,287,360 | 106,971,840 |
| Size | 404.6 MB | 102.0 MB |
| Events in quadrant A | 3,727,211 | 683,123 |
| Events in quadrant B | 3,547,280 | 742,538 |
| Events in quadrant C | 3,895,701 | 661,502 |
| Events in quadrant D | 3,949,489 | 627,695 |
| Mode M9 | |||
|---|---|---|---|
| Quadrant | BADHDUFLAG | Total packets | Discarded packets |
| A | 0 | 14 | 0 |
| B | 0 | 14 | 0 |
| C | 0 | 14 | 0 |
| D | 0 | 14 | 0 |
| Mode M0 | |||
|---|---|---|---|
| Quadrant | BADHDUFLAG | Total packets | Discarded packets |
| A | 0 | 17145 | 14 |
| B | 0 | 16407 | 25 |
| C | 0 | 17271 | 18 |
| D | 0 | 17497 | 19 |
| Mode SS | |||
|---|---|---|---|
| Quadrant | BADHDUFLAG | Total packets | Discarded packets |
| A | 0 | 156 | 0 |
| B | 0 | 156 | 0 |
| C | 0 | 156 | 0 |
| D | 0 | 156 | 0 |
| Quadrant | Total seconds | Saturated seconds | Saturation percentage |
|---|---|---|---|
| A | 7530 | 261 | 3.466135% |
| B | 7527 | 131 | 1.740401% |
| C | 7529 | 115 | 1.527427% |
| D | 7530 | 96 | 1.274900% |
Noise dominated data is calculated using 1-second bins in cleaned event files. If a bin has >2000 counts, and if more than 50% of those come from <1% of pixels, then it is considered to be noise-dominated and hence unusable.
| Quadrant | # 1 sec bins | Bins with >0 counts | Bins with >2000 counts | High rate bins dominated by noise | Noise dominated (total time) | Noise dominated (detector-on time) | Marked lightcurve |
|---|---|---|---|---|---|---|---|
| A | 8971 | 7537 | 146 | 146 | 1.63% | 1.94% | 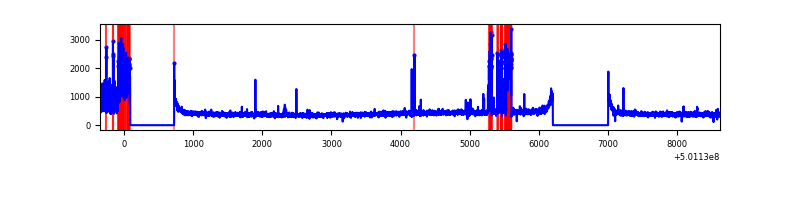 |
| B | 8970 | 7537 | 22 | 22 | 0.25% | 0.29% | 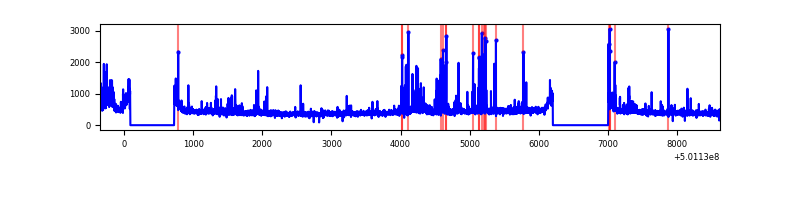 |
| C | 8971 | 7538 | 58 | 58 | 0.65% | 0.77% | 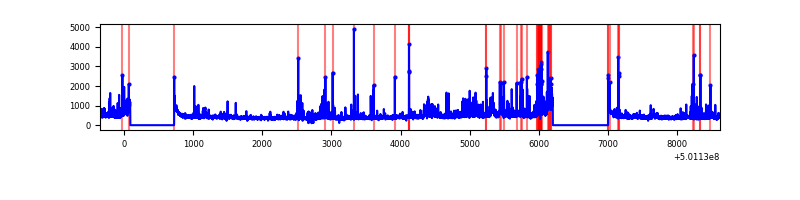 |
| D | 8971 | 7538 | 77 | 77 | 0.86% | 1.02% | 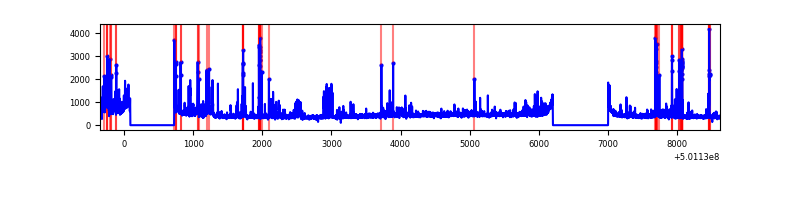 |
Top three noisy pixels from each quadrant. If the there are fewer than three noisy pixels in the level2.evt file, extra rows are filled as -1
| Pixel properties | Quadrant properties | ||||||
|---|---|---|---|---|---|---|---|
| Quadrant | DetID | PixID | Counts | Sigma | Mean | Median | Sigma |
| A | 8 | 206 | 312214 | 1599.31 | 787 | 767 | 194.7 |
| A | 8 | 249 | 231165 | 1183.11 | 787 | 767 | 194.7 |
| A | 13 | 248 | 86069 | 438.03 | 787 | 767 | 194.7 |
| B | 5 | 185 | 105207 | 614.56 | 787 | 759 | 170.0 |
| B | 10 | 247 | 94490 | 551.51 | 787 | 759 | 170.0 |
| B | 5 | 236 | 74317 | 432.81 | 787 | 759 | 170.0 |
| C | 14 | 254 | 280603 | 1320.93 | 770 | 765 | 211.8 |
| C | 12 | 252 | 222391 | 1046.15 | 770 | 765 | 211.8 |
| C | 15 | 209 | 149206 | 700.69 | 770 | 765 | 211.8 |
| D | 10 | 181 | 277329 | 1261.79 | 769 | 737 | 219.2 |
| D | 11 | 129 | 266951 | 1214.45 | 769 | 737 | 219.2 |
| D | 8 | 240 | 84933 | 384.1 | 769 | 737 | 219.2 |
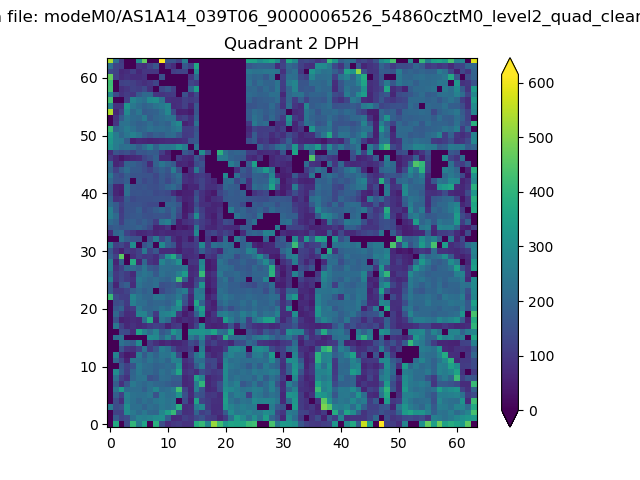
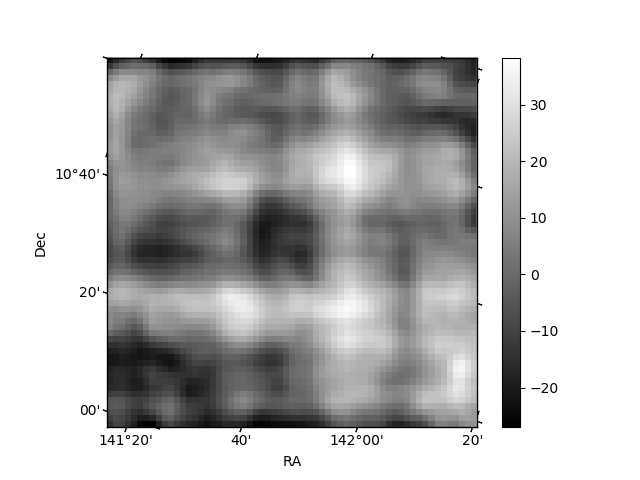
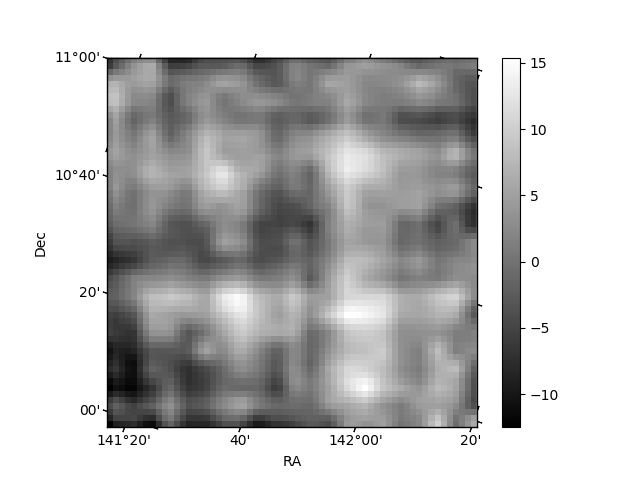
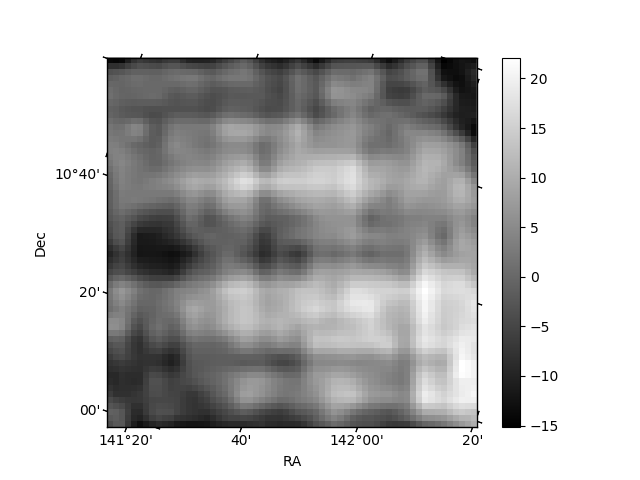
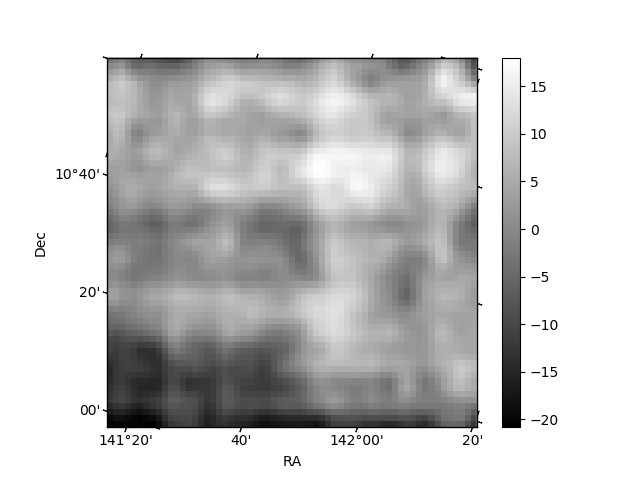
Histogram calculated using DETX and DETY for each event in the final _common_clean file
| Quadrant A | 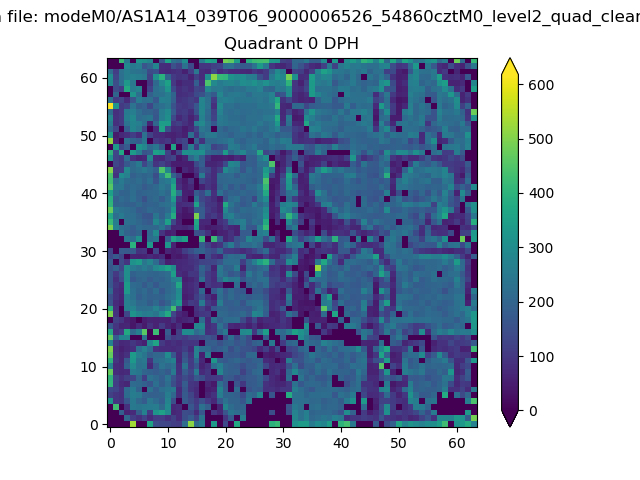 |
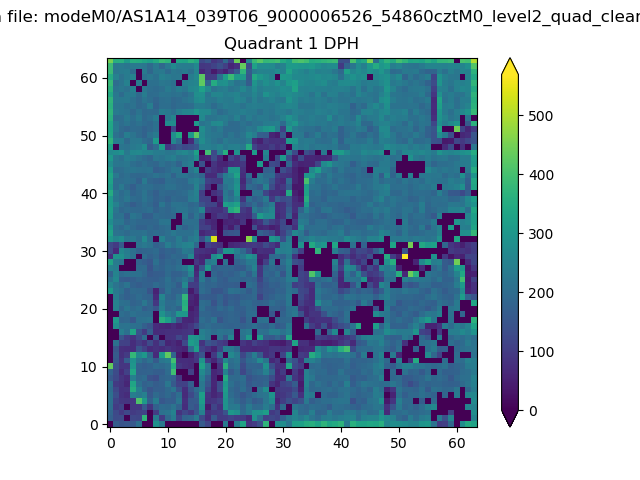 |
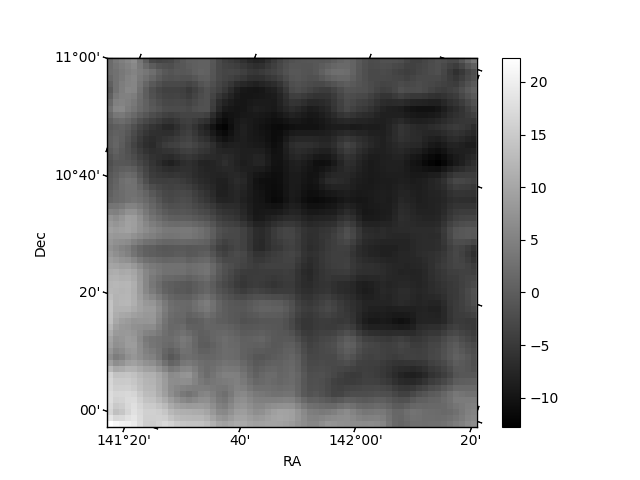
Quadrant B |
|---|---|---|---|
| Quadrant D | 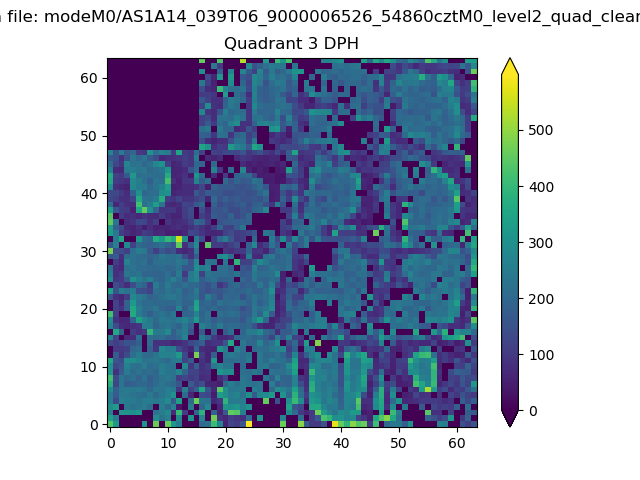 |
 |
Quadrant C |
| Plot type | Count rate plots | Images |
|---|---|---|
| Comparison with Poisson distribution Blue bars denote a histogram of data divided into 1 sec bins. Red curve is a Poisson curve with rate = median count rate of data. |
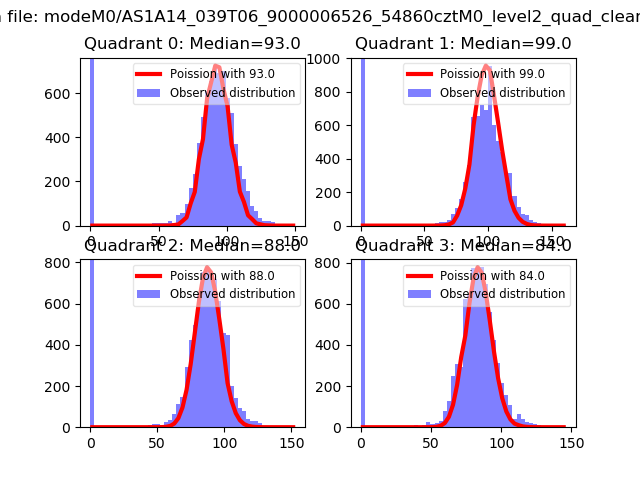 |
 |
| Quadrant-wise count rates Data is divided into 100 sec bins |
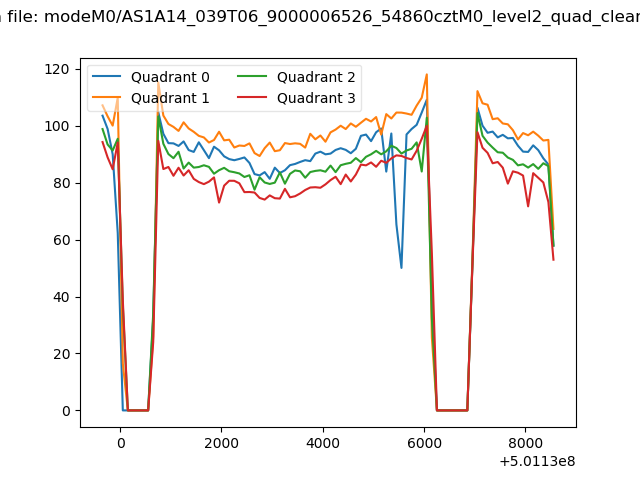 |
|
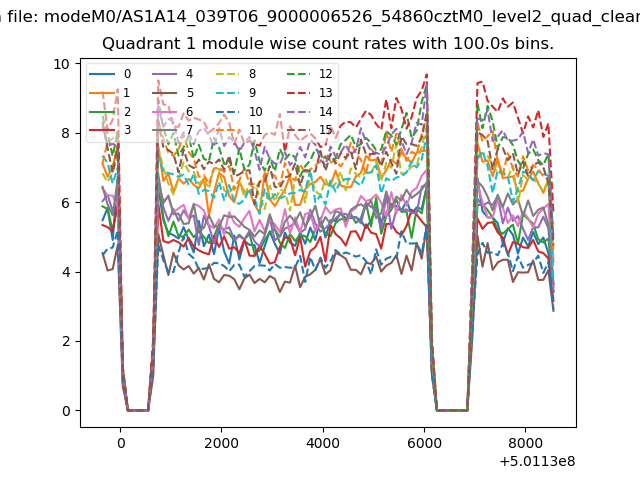
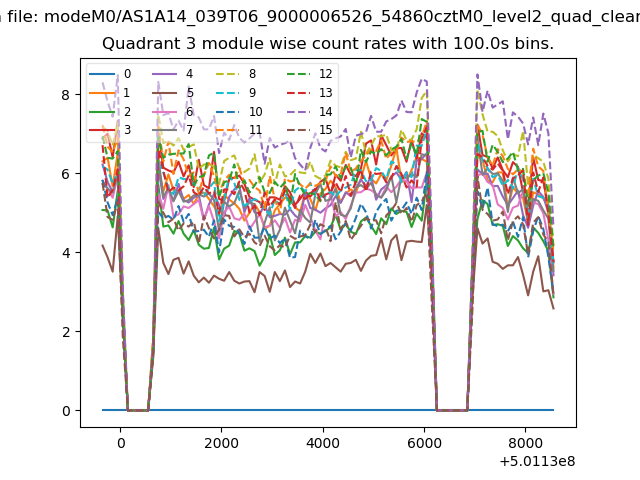
| Module-wise count rates for Quadrant A Data is divided into 100 sec bins |
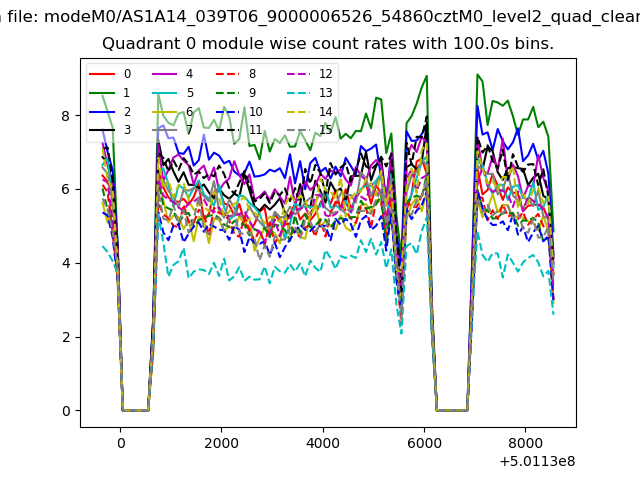 |
 |
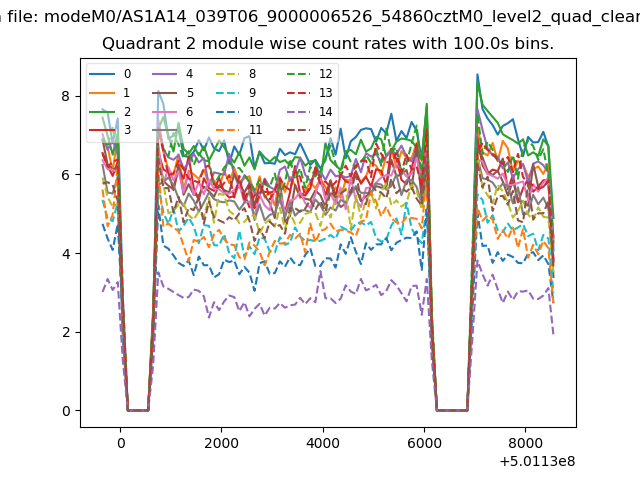
| Module-wise count rates for Quadrant B Data is divided into 100 sec bins |
 |
 |
| Module-wise count rates for Quadrant C Data is divided into 100 sec bins |
 |
 |
| Module-wise count rates for Quadrant D Data is divided into 100 sec bins |
 |
 |
| Parameter | Plot |
|---|---|
| CZT HV Monitor | 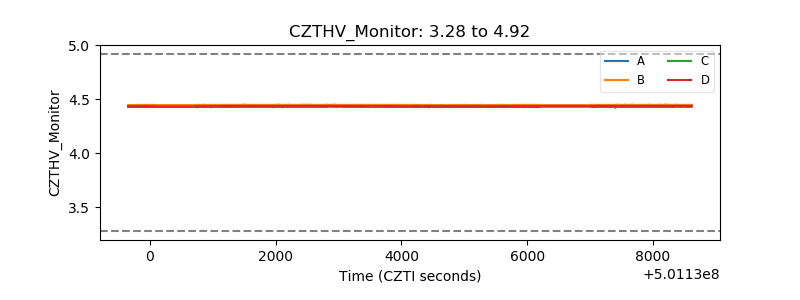 |
| D_VDD | 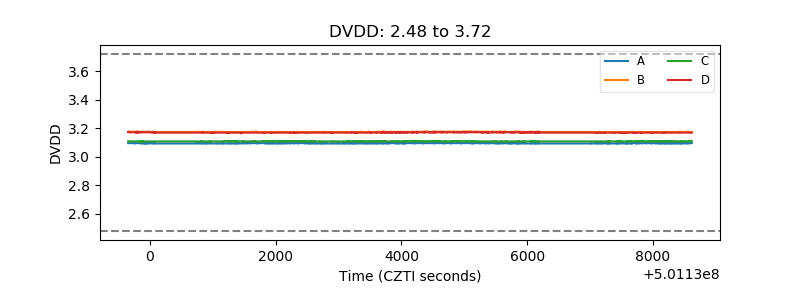 |
| Temperature 1 | 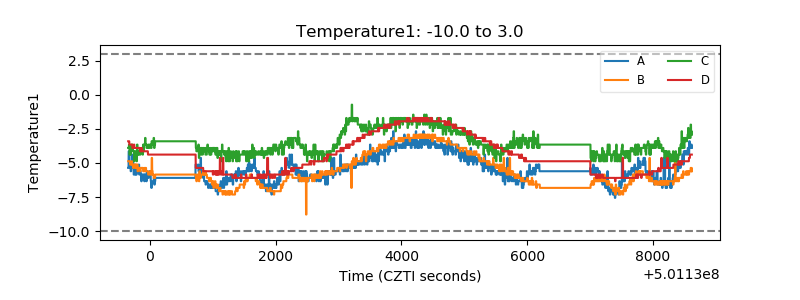 |
| Veto HV Monitor | 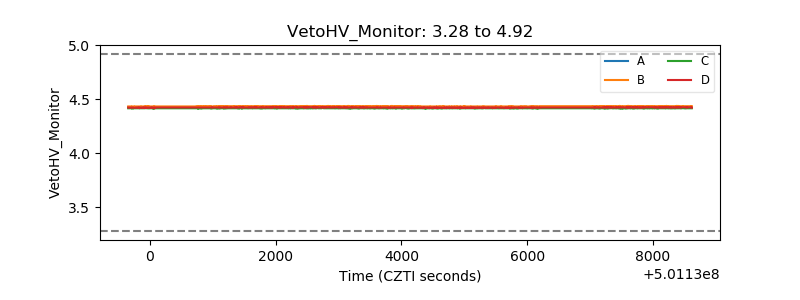 |
| Veto LLD | 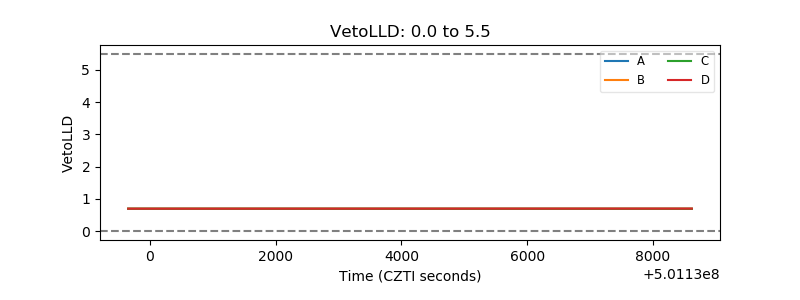 |
| Alpha Counter | 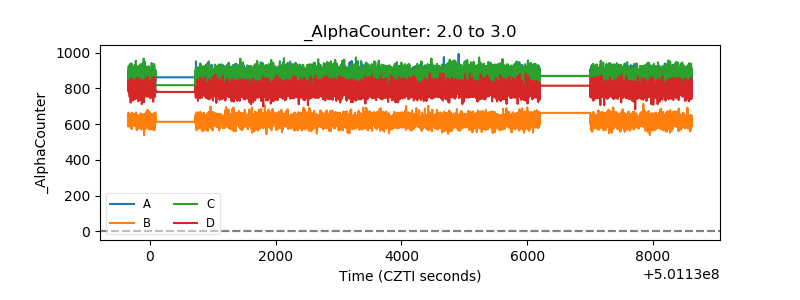 |
| _CPM_Rate | 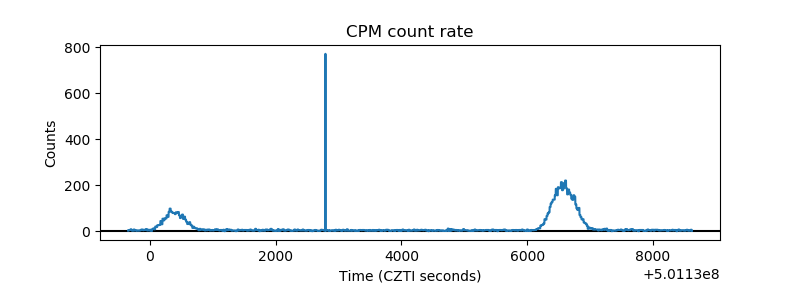 |
| CZT Counter | 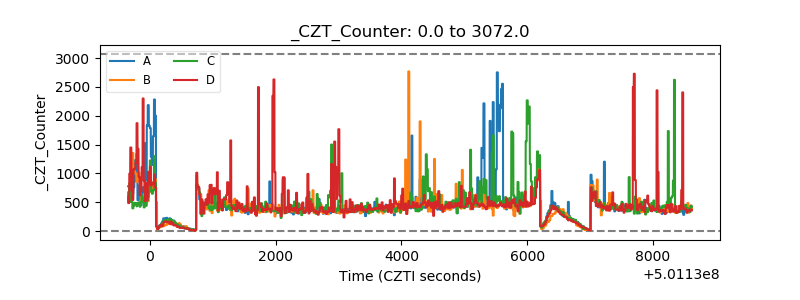 |
| +2.5 Volts monitor |  |
| +5 Volts monitor | 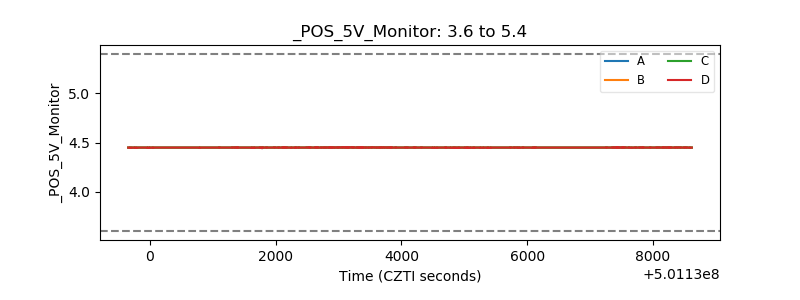 |
| _ROLL_ROT | 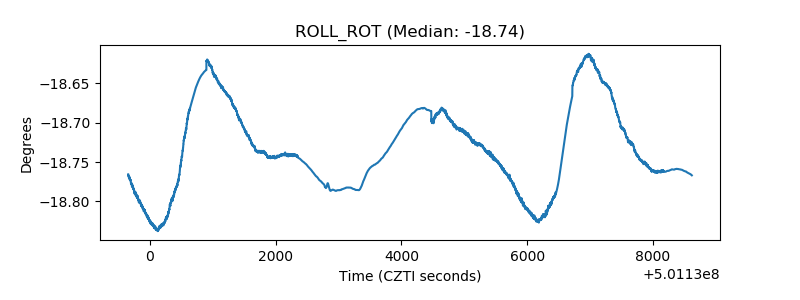 |
| _Roll_DEC | 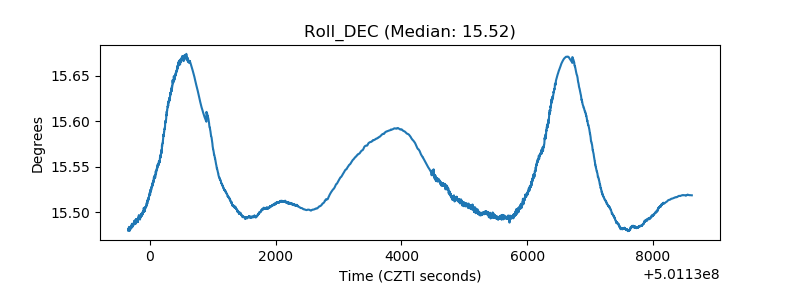 |
| _Roll_RA | 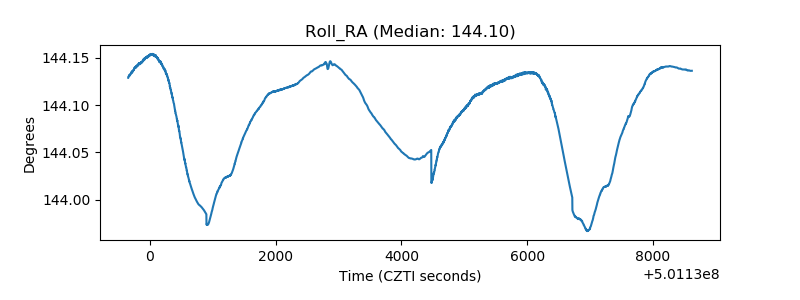 |
| Veto Counter | 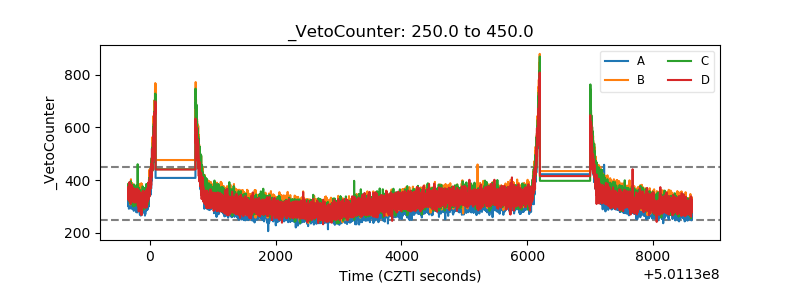 |