| Param | Original file | Final file |
|---|---|---|
| Filename | modeM0/AS1A14_039T06_9000006526_54863cztM0_level2.fits | modeM0/AS1A14_039T06_9000006526_54863cztM0_level2_quad_clean.evt |
| Size (bytes) | 345,729,600 | 87,399,360 |
| Size | 329.7 MB | 83.4 MB |
| Events in quadrant A | 3,064,226 | 563,337 |
| Events in quadrant B | 2,679,935 | 613,139 |
| Events in quadrant C | 3,465,841 | 541,169 |
| Events in quadrant D | 3,121,615 | 511,408 |
| Mode M9 | |||
|---|---|---|---|
| Quadrant | BADHDUFLAG | Total packets | Discarded packets |
| A | 0 | 11 | 0 |
| B | 0 | 11 | 0 |
| C | 0 | 11 | 0 |
| D | 0 | 11 | 0 |
| Mode M0 | |||
|---|---|---|---|
| Quadrant | BADHDUFLAG | Total packets | Discarded packets |
| A | 0 | 13572 | 5 |
| B | 0 | 12472 | 1 |
| C | 0 | 14473 | 1 |
| D | 0 | 13504 | 1 |
| Mode SS | |||
|---|---|---|---|
| Quadrant | BADHDUFLAG | Total packets | Discarded packets |
| A | 0 | 120 | 0 |
| B | 0 | 120 | 0 |
| C | 0 | 120 | 0 |
| D | 0 | 120 | 0 |
| Quadrant | Total seconds | Saturated seconds | Saturation percentage |
|---|---|---|---|
| A | 5980 | 166 | 2.775920% |
| B | 5983 | 77 | 1.286980% |
| C | 5983 | 91 | 1.520976% |
| D | 5983 | 86 | 1.437406% |
Noise dominated data is calculated using 1-second bins in cleaned event files. If a bin has >2000 counts, and if more than 50% of those come from <1% of pixels, then it is considered to be noise-dominated and hence unusable.
| Quadrant | # 1 sec bins | Bins with >0 counts | Bins with >2000 counts | High rate bins dominated by noise | Noise dominated (total time) | Noise dominated (detector-on time) | Marked lightcurve |
|---|---|---|---|---|---|---|---|
| A | 7007 | 5981 | 104 | 104 | 1.48% | 1.74% | 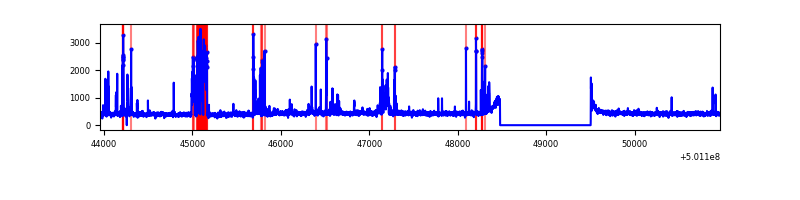 |
| B | 7008 | 5983 | 2 | 2 | 0.03% | 0.03% | 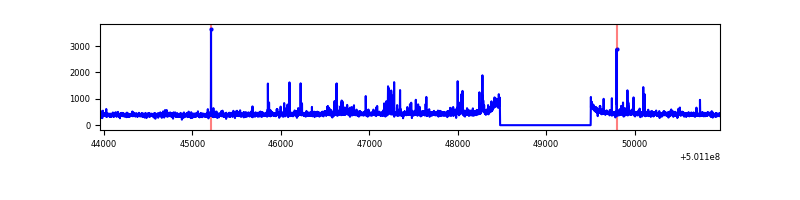 |
| C | 7008 | 5984 | 52 | 52 | 0.74% | 0.87% | 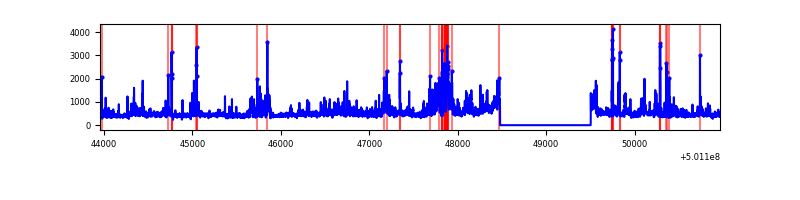 |
| D | 7008 | 5984 | 49 | 49 | 0.70% | 0.82% | 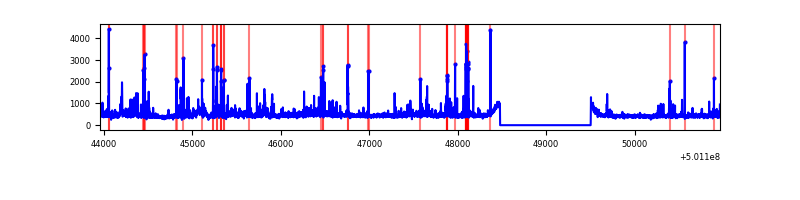 |
Top three noisy pixels from each quadrant. If the there are fewer than three noisy pixels in the level2.evt file, extra rows are filled as -1
| Pixel properties | Quadrant properties | ||||||
|---|---|---|---|---|---|---|---|
| Quadrant | DetID | PixID | Counts | Sigma | Mean | Median | Sigma |
| A | 0 | 250 | 252742 | 1600.6 | 640 | 625 | 157.5 |
| A | 0 | 8 | 187172 | 1184.32 | 640 | 625 | 157.5 |
| A | 5 | 241 | 74185 | 467.01 | 640 | 625 | 157.5 |
| B | 5 | 185 | 67933 | 497.08 | 631 | 608 | 135.4 |
| B | 10 | 245 | 21281 | 152.63 | 631 | 608 | 135.4 |
| B | 10 | 247 | 19006 | 135.84 | 631 | 608 | 135.4 |
| C | 12 | 252 | 566809 | 3330.54 | 619 | 614 | 170.0 |
| C | 14 | 254 | 223139 | 1308.96 | 619 | 614 | 170.0 |
| C | 6 | 223 | 141491 | 828.68 | 619 | 614 | 170.0 |
| D | 2 | 252 | 117471 | 653.3 | 624 | 596 | 178.9 |
| D | 8 | 160 | 107776 | 599.11 | 624 | 596 | 178.9 |
| D | 15 | 94 | 57790 | 319.7 | 624 | 596 | 178.9 |
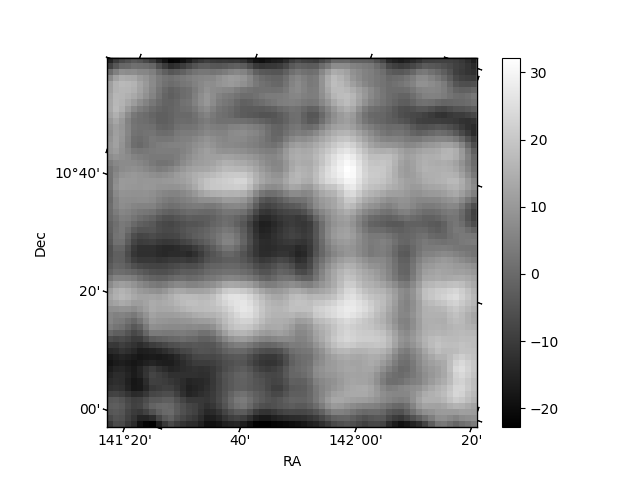
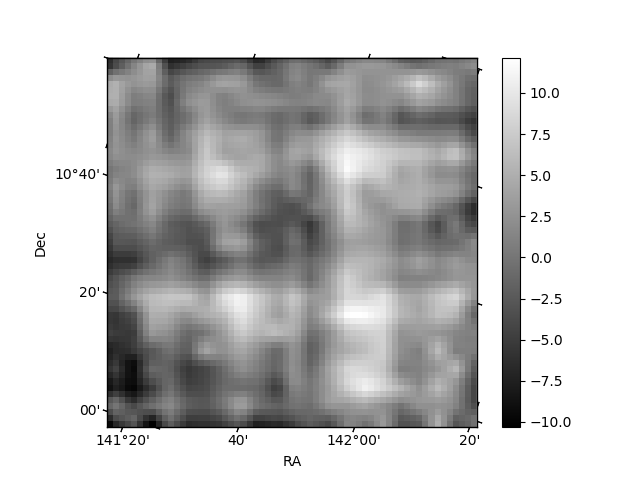
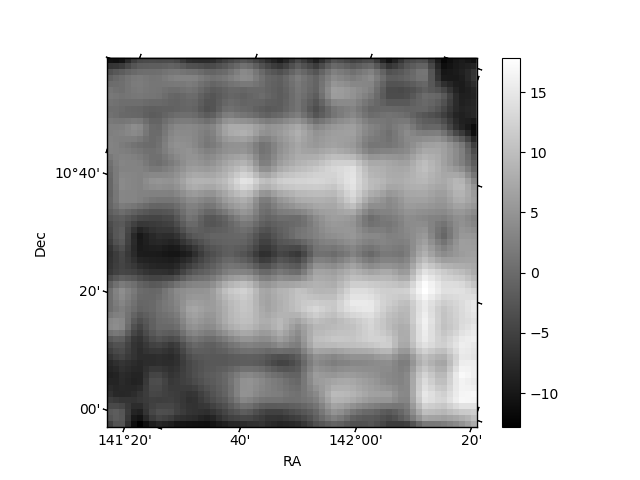
Histogram calculated using DETX and DETY for each event in the final _common_clean file
| Quadrant A | 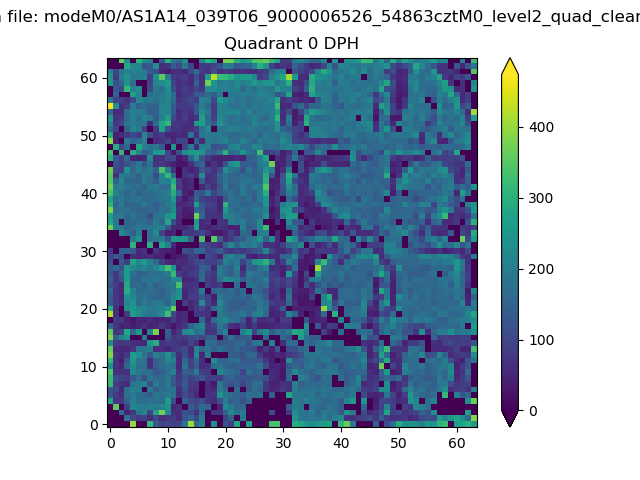 |
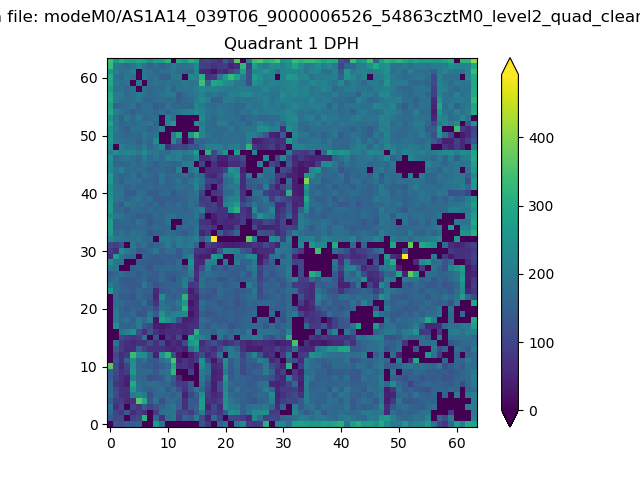 |
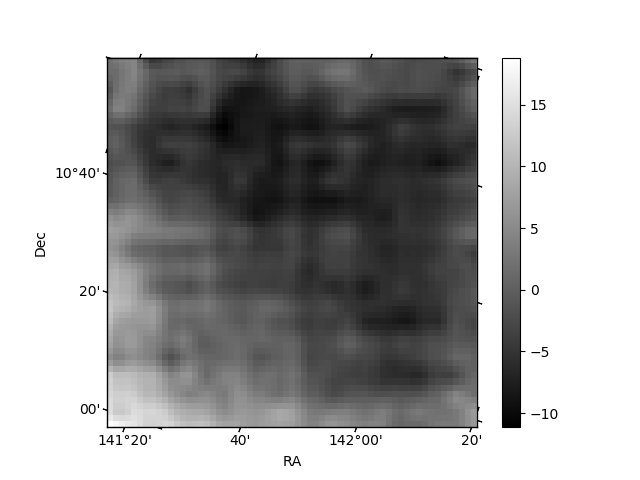
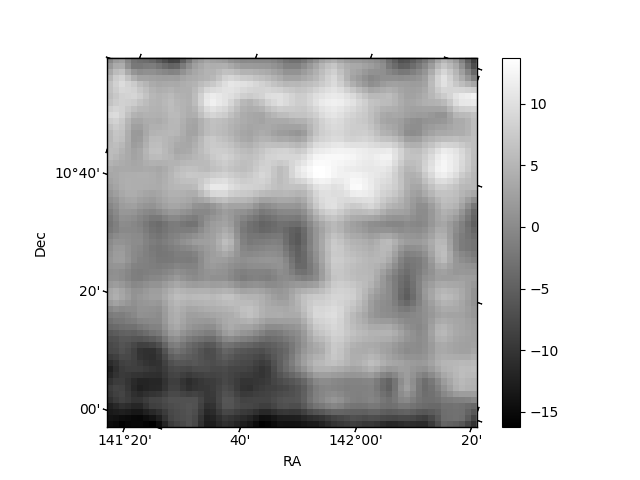
Quadrant B |
|---|---|---|---|
| Quadrant D | 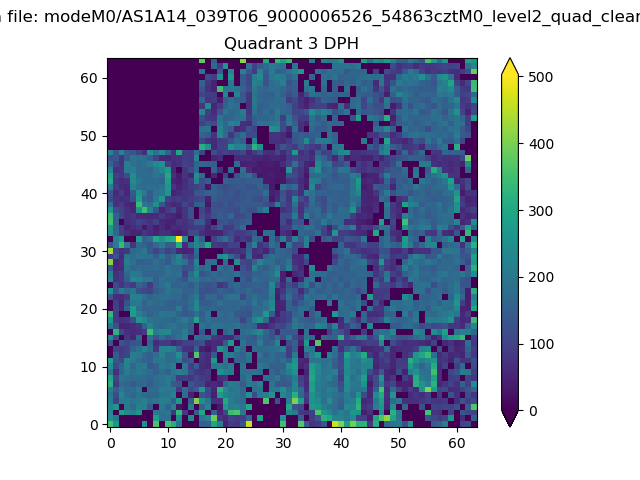 |
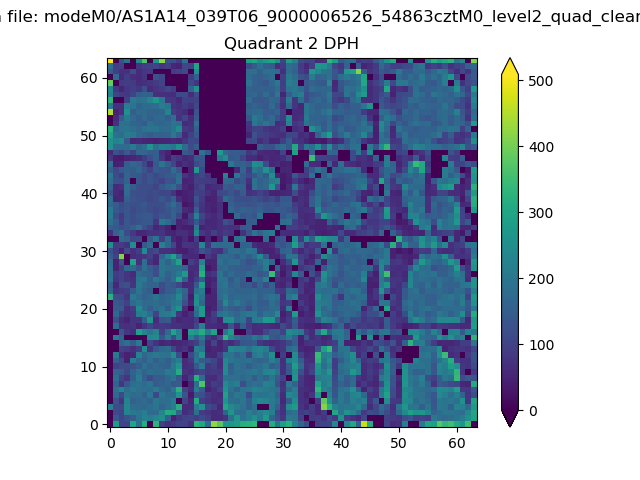 |
Quadrant C |
| Plot type | Count rate plots | Images |
|---|---|---|
| Comparison with Poisson distribution Blue bars denote a histogram of data divided into 1 sec bins. Red curve is a Poisson curve with rate = median count rate of data. |
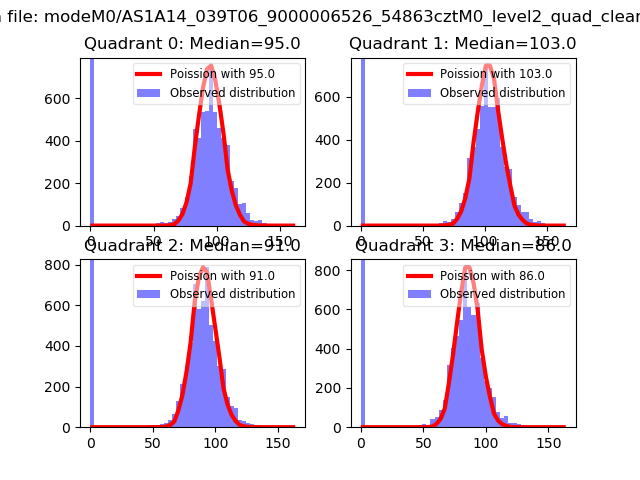 |
 |
| Quadrant-wise count rates Data is divided into 100 sec bins |
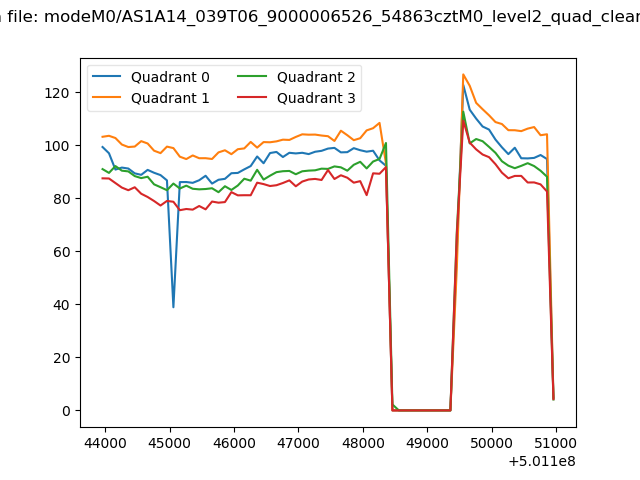 |
|
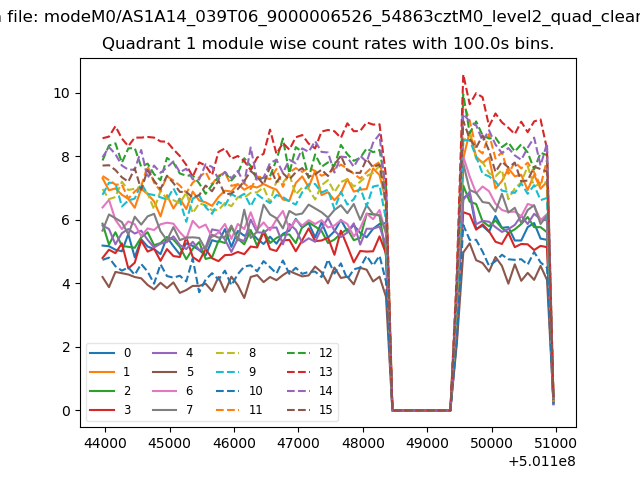
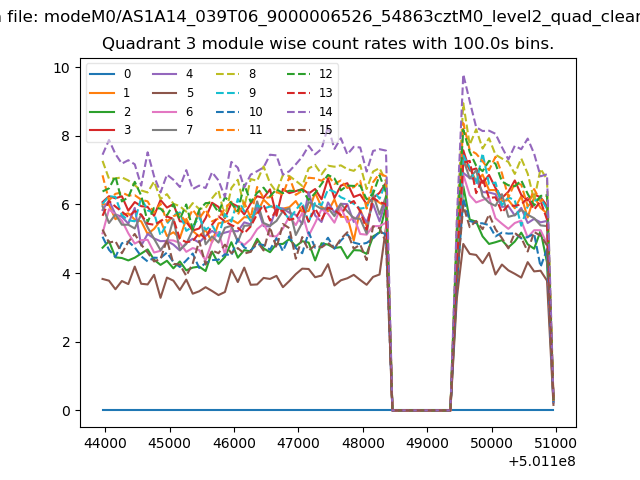
| Module-wise count rates for Quadrant A Data is divided into 100 sec bins |
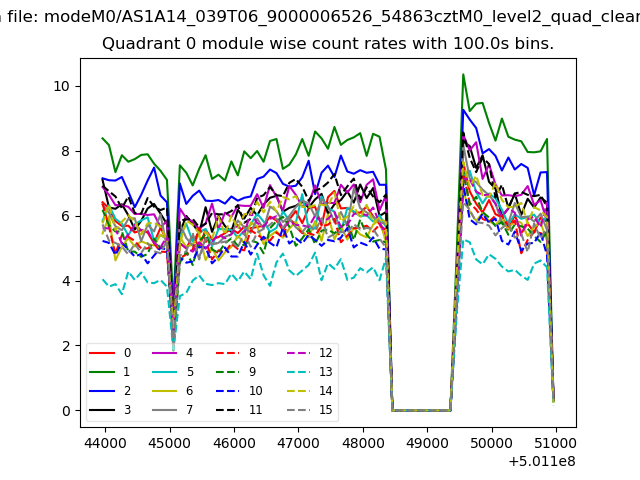 |
 |
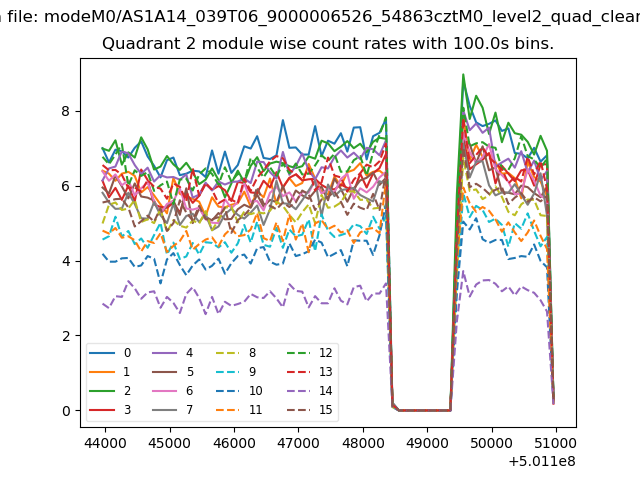
| Module-wise count rates for Quadrant B Data is divided into 100 sec bins |
 |
 |
| Module-wise count rates for Quadrant C Data is divided into 100 sec bins |
 |
 |
| Module-wise count rates for Quadrant D Data is divided into 100 sec bins |
 |
 |
| Parameter | Plot |
|---|---|
| CZT HV Monitor | 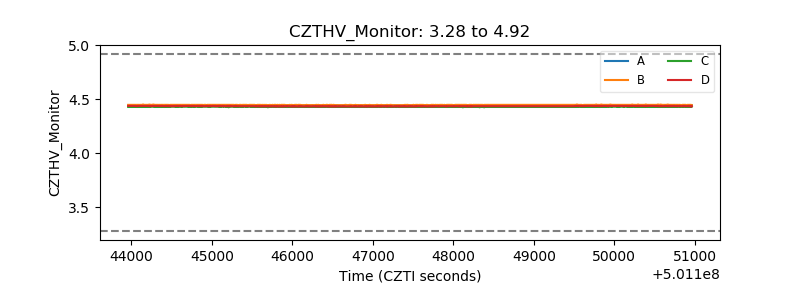 |
| D_VDD | 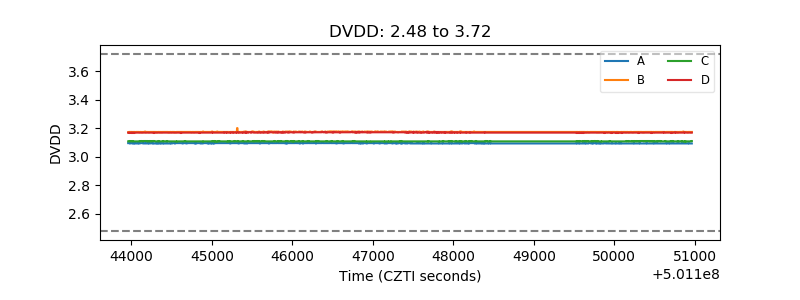 |
| Temperature 1 | 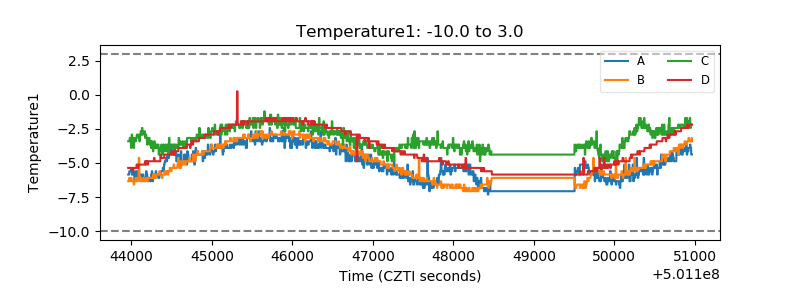 |
| Veto HV Monitor | 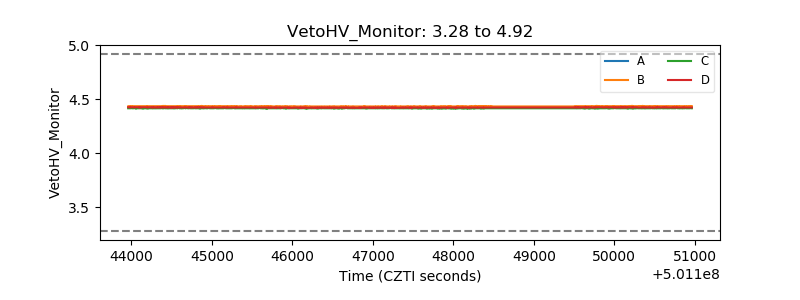 |
| Veto LLD | 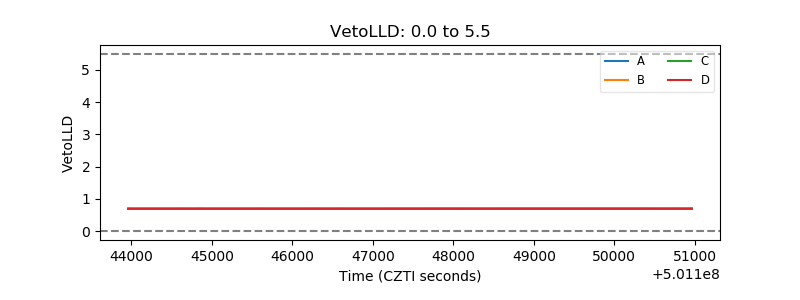 |
| Alpha Counter | 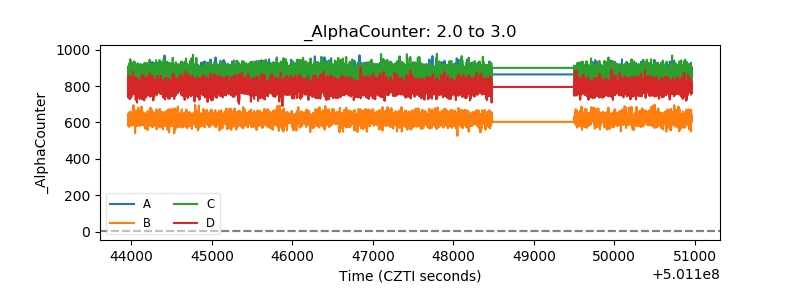 |
| _CPM_Rate | 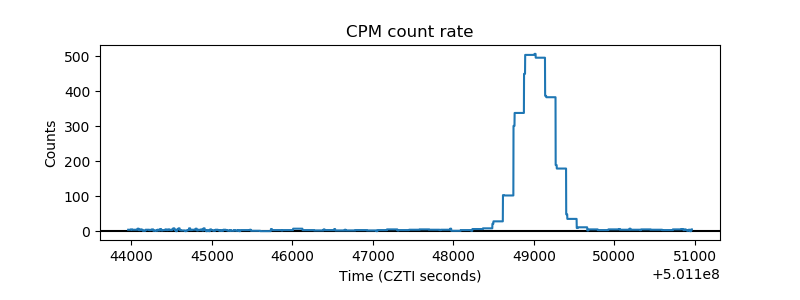 |
| CZT Counter | 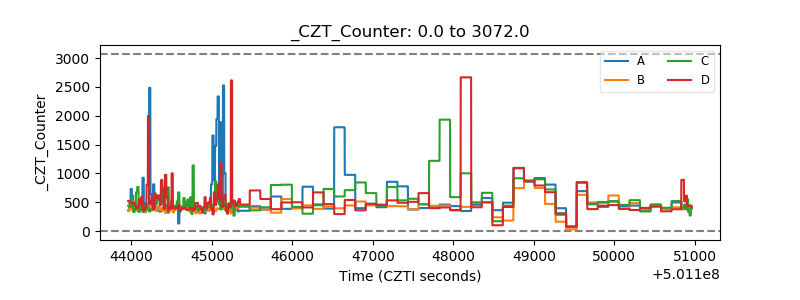 |
| +2.5 Volts monitor | 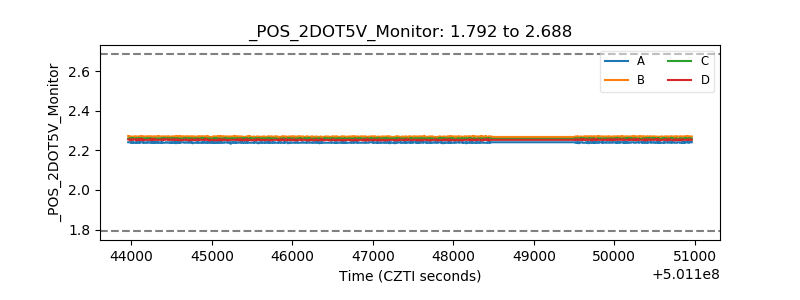 |
| +5 Volts monitor | 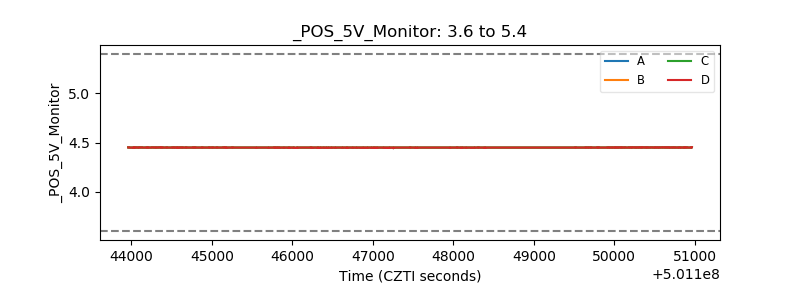 |
| _ROLL_ROT | 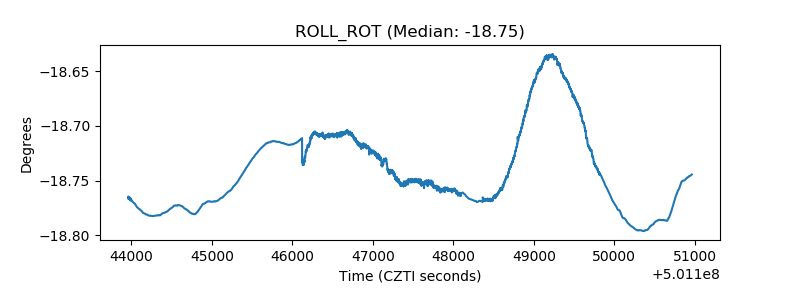 |
| _Roll_DEC | 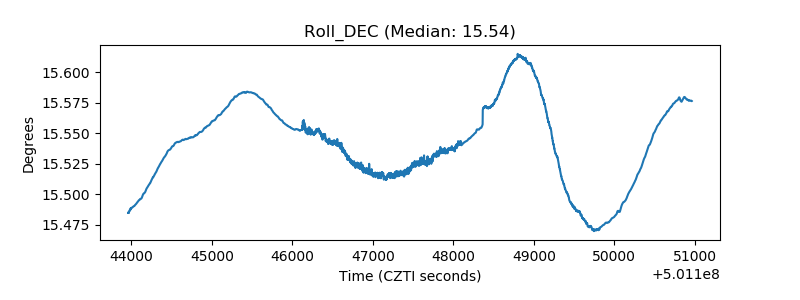 |
| _Roll_RA | 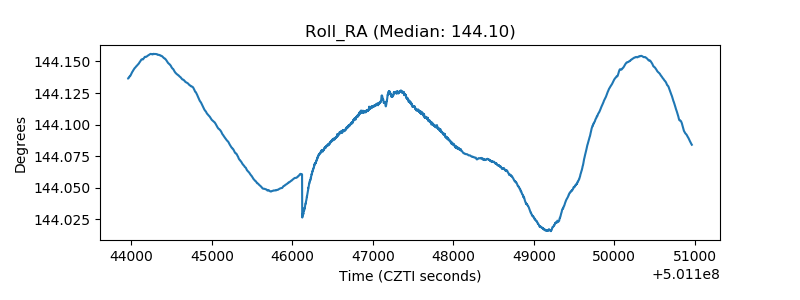 |
| Veto Counter | 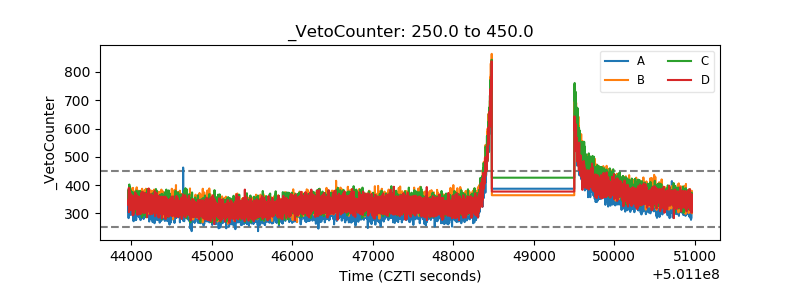 |