| Param | Original file | Final file |
|---|---|---|
| Filename | modeM0/AS1A14_039T06_9000006526_54864cztM0_level2.fits | modeM0/AS1A14_039T06_9000006526_54864cztM0_level2_quad_clean.evt |
| Size (bytes) | 375,531,840 | 96,888,960 |
| Size | 358.1 MB | 92.4 MB |
| Events in quadrant A | 3,434,501 | 632,897 |
| Events in quadrant B | 2,980,991 | 683,625 |
| Events in quadrant C | 3,759,513 | 595,969 |
| Events in quadrant D | 3,221,168 | 569,951 |
| Mode M9 | |||
|---|---|---|---|
| Quadrant | BADHDUFLAG | Total packets | Discarded packets |
| A | 0 | 15 | 0 |
| B | 0 | 16 | 0 |
| C | 0 | 16 | 0 |
| D | 0 | 16 | 0 |
| Mode M0 | |||
|---|---|---|---|
| Quadrant | BADHDUFLAG | Total packets | Discarded packets |
| A | 0 | 14876 | 2 |
| B | 0 | 13511 | 5 |
| C | 0 | 15634 | 2 |
| D | 0 | 14122 | 2 |
| Mode SS | |||
|---|---|---|---|
| Quadrant | BADHDUFLAG | Total packets | Discarded packets |
| A | 0 | 130 | 0 |
| B | 0 | 130 | 0 |
| C | 0 | 130 | 0 |
| D | 0 | 130 | 0 |
| Quadrant | Total seconds | Saturated seconds | Saturation percentage |
|---|---|---|---|
| A | 6481 | 202 | 3.116803% |
| B | 6479 | 125 | 1.929310% |
| C | 6480 | 246 | 3.796296% |
| D | 6480 | 121 | 1.867284% |
Noise dominated data is calculated using 1-second bins in cleaned event files. If a bin has >2000 counts, and if more than 50% of those come from <1% of pixels, then it is considered to be noise-dominated and hence unusable.
| Quadrant | # 1 sec bins | Bins with >0 counts | Bins with >2000 counts | High rate bins dominated by noise | Noise dominated (total time) | Noise dominated (detector-on time) | Marked lightcurve |
|---|---|---|---|---|---|---|---|
| A | 7546 | 6481 | 83 | 83 | 1.10% | 1.28% | 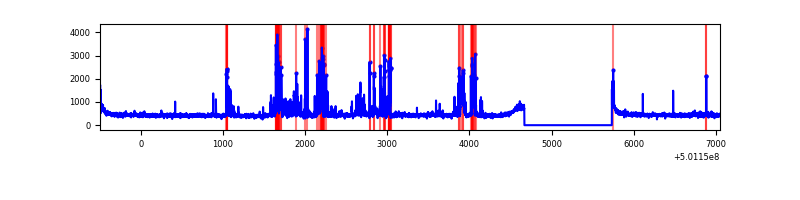 |
| B | 7546 | 6480 | 7 | 7 | 0.09% | 0.11% | 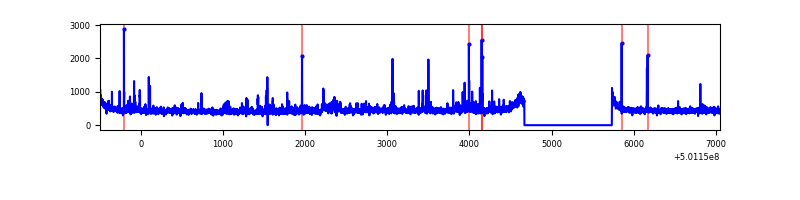 |
| C | 7545 | 6480 | 147 | 147 | 1.95% | 2.27% | 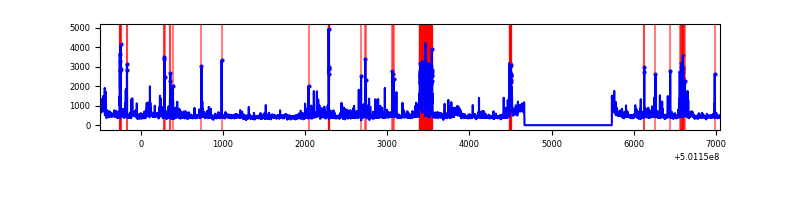 |
| D | 7545 | 6480 | 23 | 23 | 0.30% | 0.35% | 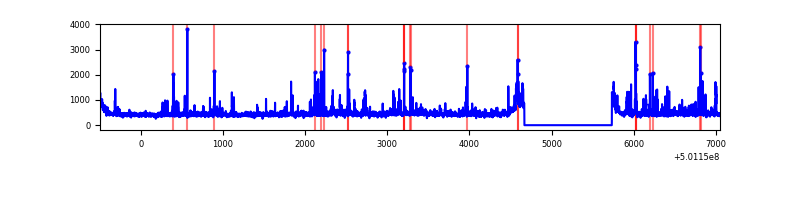 |
Top three noisy pixels from each quadrant. If the there are fewer than three noisy pixels in the level2.evt file, extra rows are filled as -1
| Pixel properties | Quadrant properties | ||||||
|---|---|---|---|---|---|---|---|
| Quadrant | DetID | PixID | Counts | Sigma | Mean | Median | Sigma |
| A | 0 | 8 | 508965 | 2865.62 | 720 | 703 | 177.4 |
| A | 8 | 206 | 67257 | 375.23 | 720 | 703 | 177.4 |
| A | 5 | 241 | 22647 | 123.72 | 720 | 703 | 177.4 |
| B | 2 | 249 | 64353 | 421.69 | 706 | 680 | 151.0 |
| B | 10 | 247 | 36818 | 239.33 | 706 | 680 | 151.0 |
| B | 10 | 245 | 27967 | 180.71 | 706 | 680 | 151.0 |
| C | 4 | 5 | 362792 | 1914.28 | 690 | 685 | 189.2 |
| C | 14 | 254 | 244332 | 1288.04 | 690 | 685 | 189.2 |
| C | 12 | 252 | 215094 | 1133.47 | 690 | 685 | 189.2 |
| D | 11 | 129 | 75391 | 377.88 | 700 | 671 | 197.7 |
| D | 7 | 129 | 68466 | 342.86 | 700 | 671 | 197.7 |
| D | 5 | 173 | 55357 | 276.56 | 700 | 671 | 197.7 |
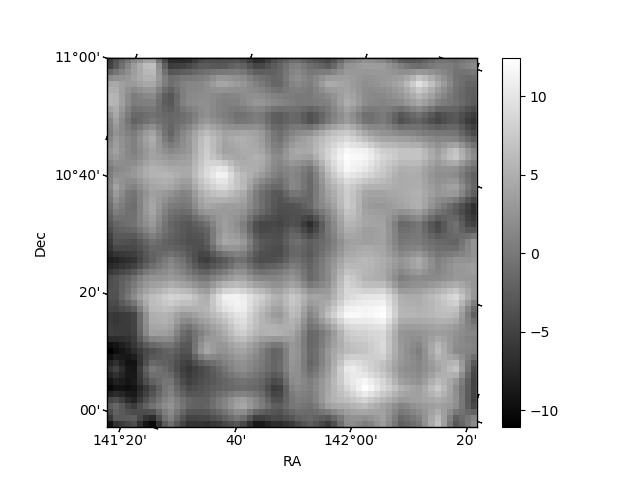
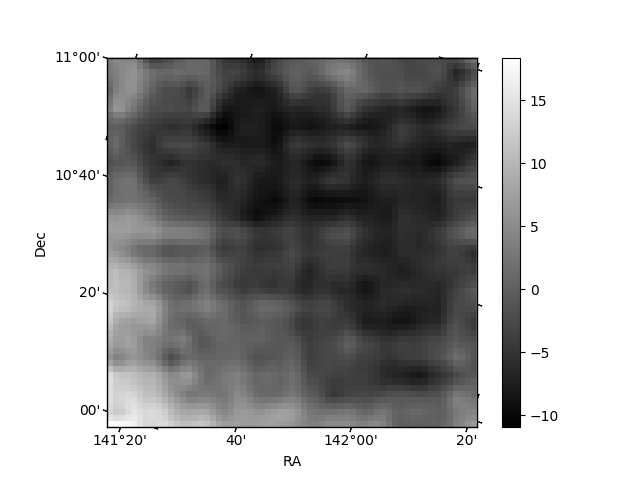
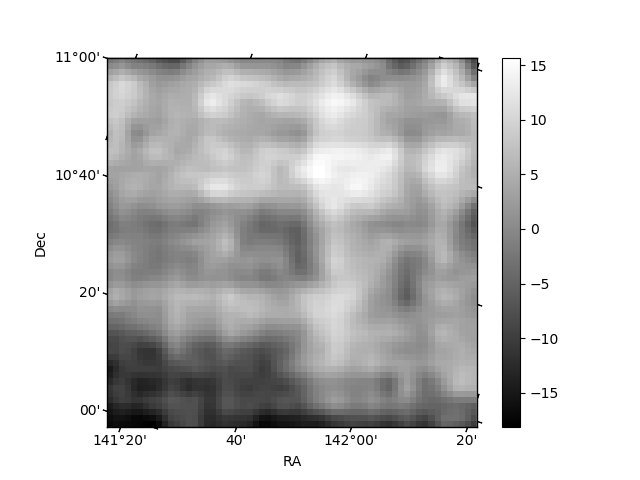
Histogram calculated using DETX and DETY for each event in the final _common_clean file
| Quadrant A | 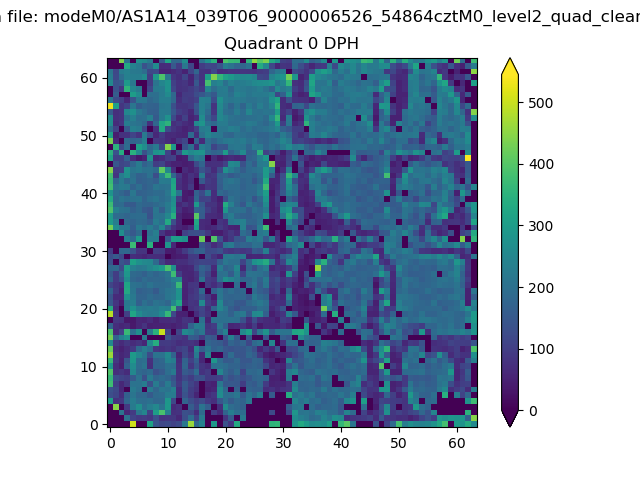 |
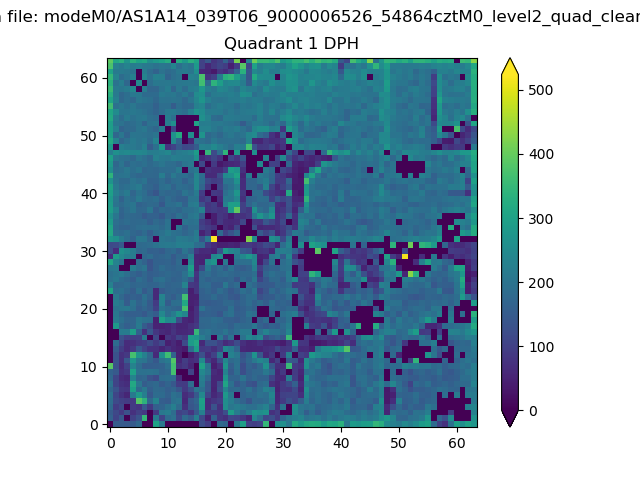 |
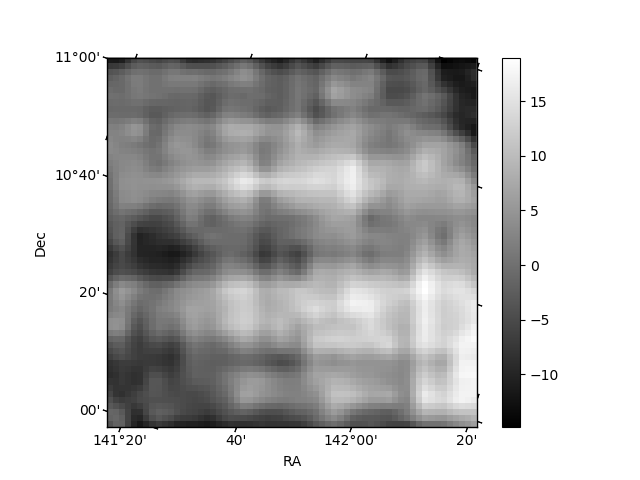
Quadrant B |
|---|---|---|---|
| Quadrant D | 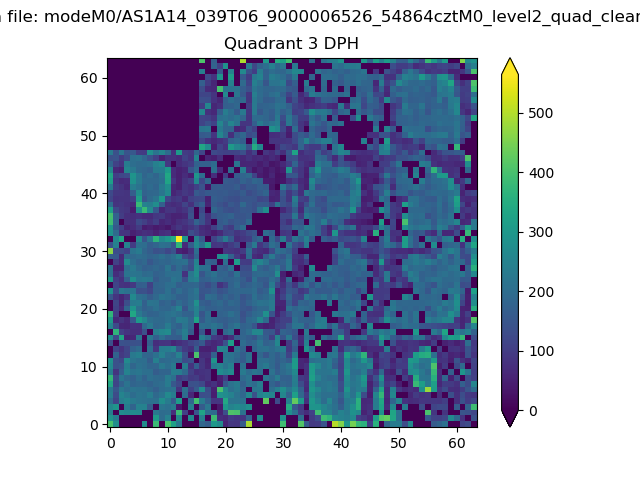 |
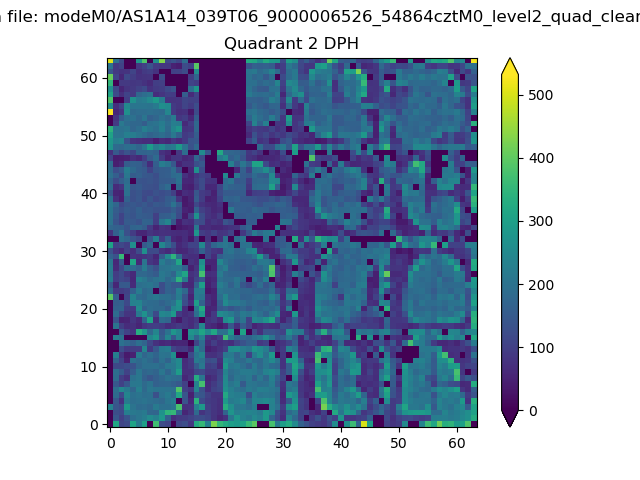 |
Quadrant C |
| Plot type | Count rate plots | Images |
|---|---|---|
| Comparison with Poisson distribution Blue bars denote a histogram of data divided into 1 sec bins. Red curve is a Poisson curve with rate = median count rate of data. |
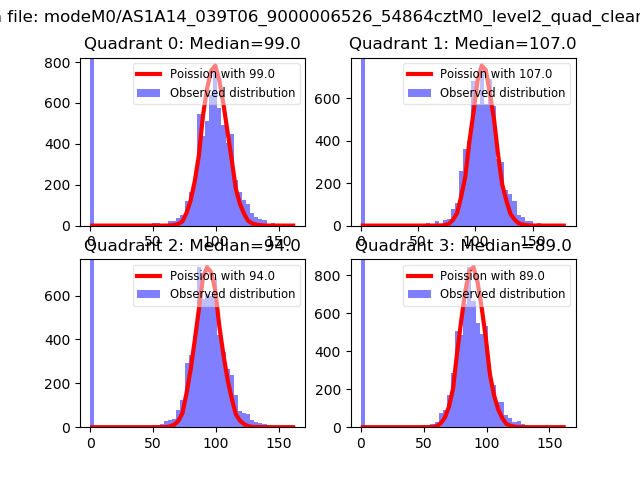 |
 |
| Quadrant-wise count rates Data is divided into 100 sec bins |
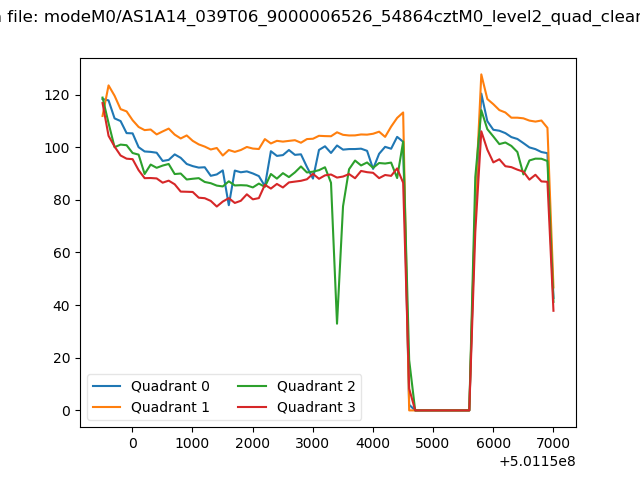 |
|
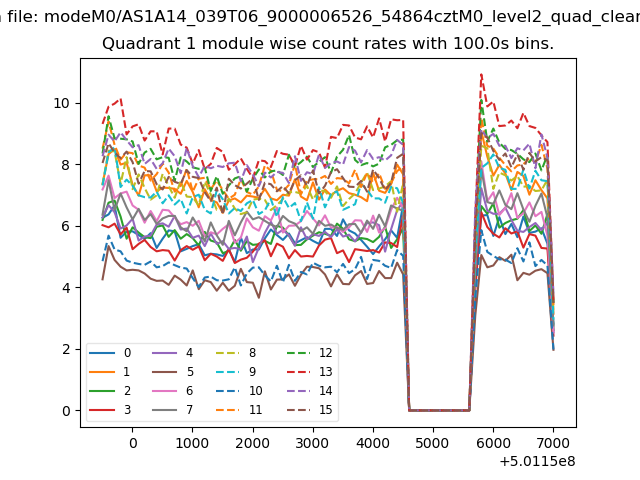
| Module-wise count rates for Quadrant A Data is divided into 100 sec bins |
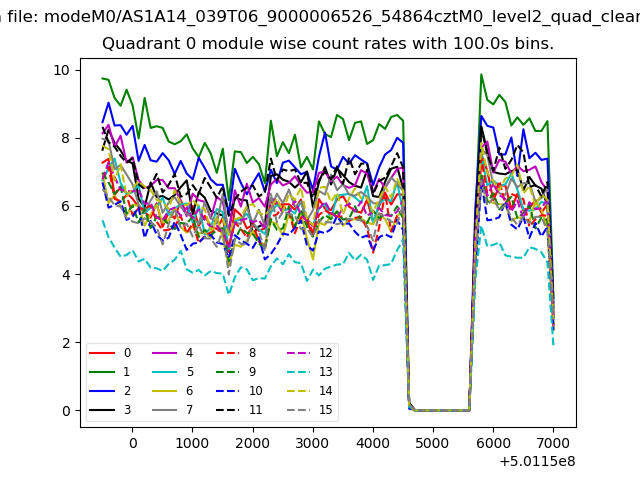 |
 |
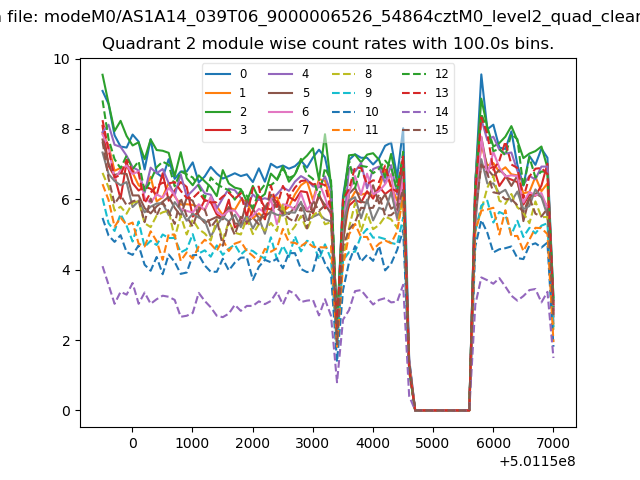
| Module-wise count rates for Quadrant B Data is divided into 100 sec bins |
 |
 |
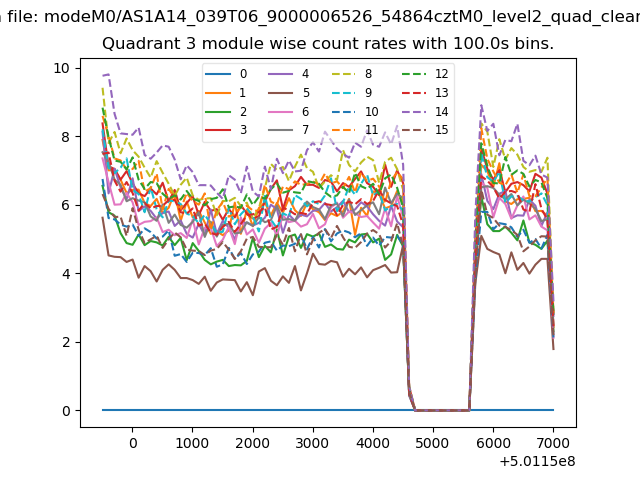
| Module-wise count rates for Quadrant C Data is divided into 100 sec bins |
 |
 |
| Module-wise count rates for Quadrant D Data is divided into 100 sec bins |
 |
 |
| Parameter | Plot |
|---|---|
| CZT HV Monitor | 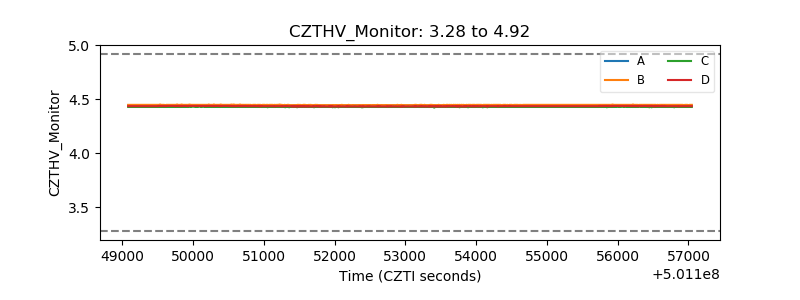 |
| D_VDD | 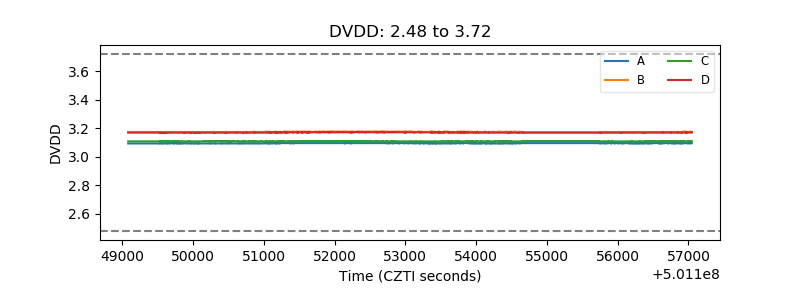 |
| Temperature 1 | 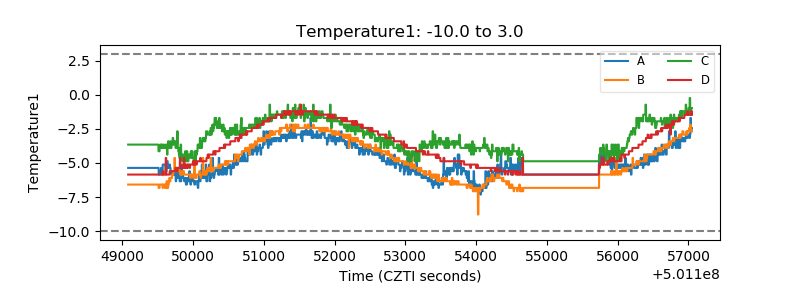 |
| Veto HV Monitor | 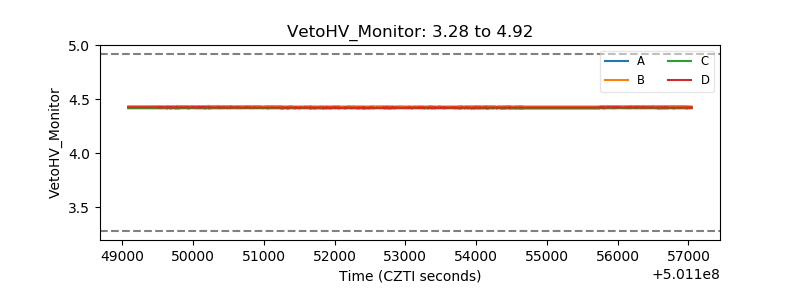 |
| Veto LLD | 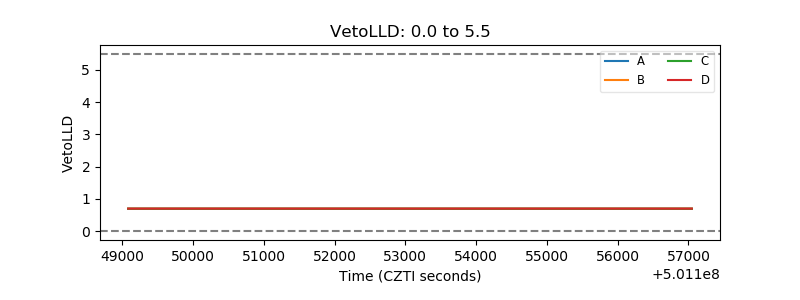 |
| Alpha Counter | 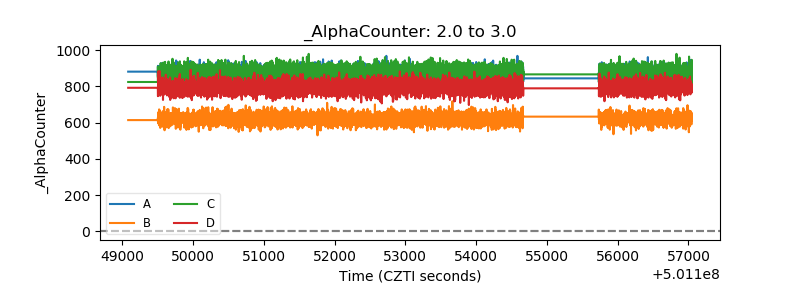 |
| _CPM_Rate | 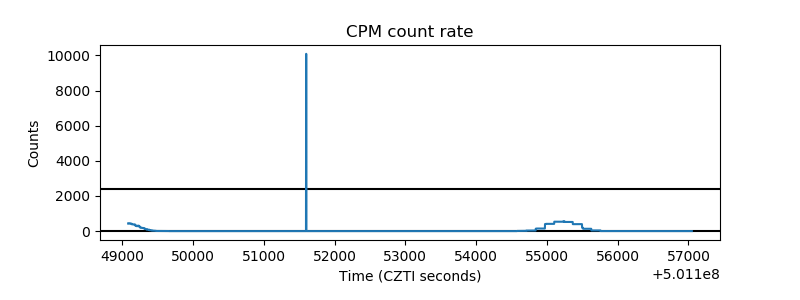 |
| CZT Counter | 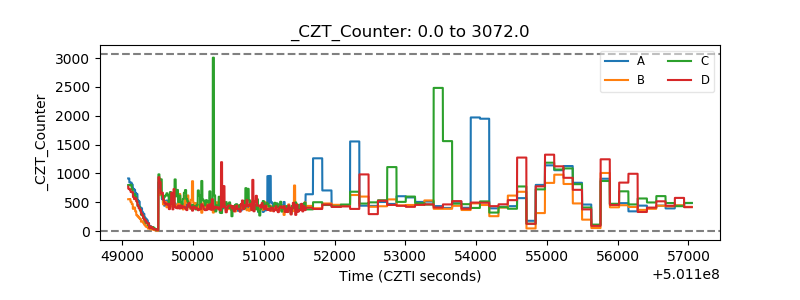 |
| +2.5 Volts monitor |  |
| +5 Volts monitor |  |
| _ROLL_ROT | 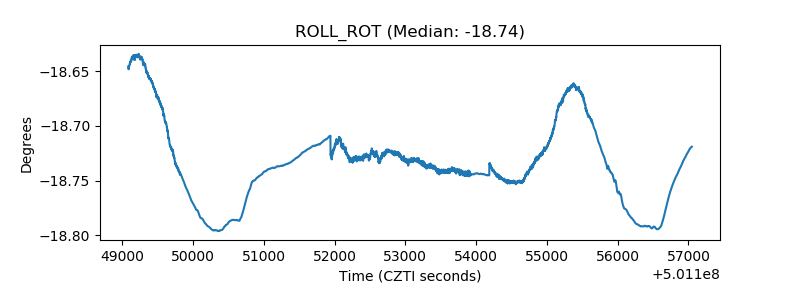 |
| _Roll_DEC | 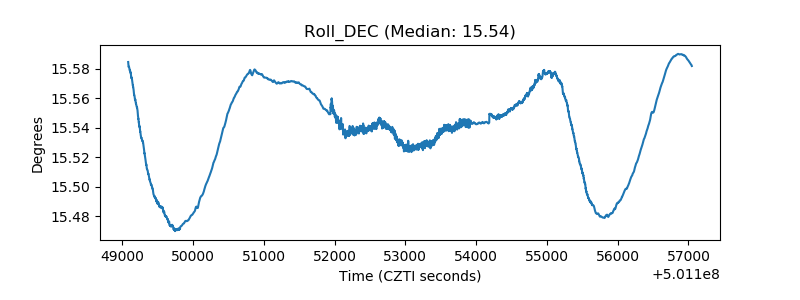 |
| _Roll_RA | 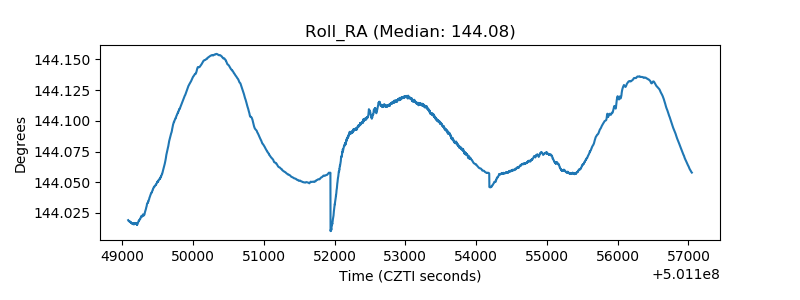 |
| Veto Counter | 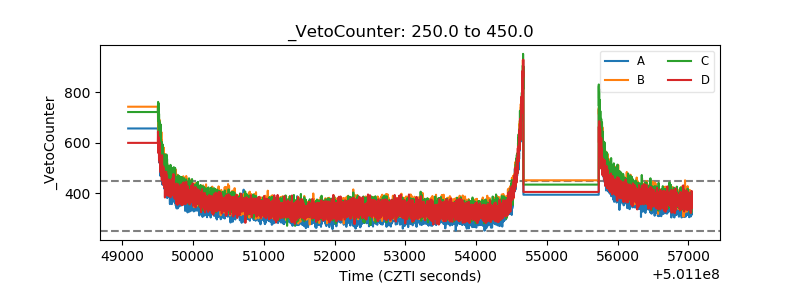 |