| Param | Original file | Final file |
|---|---|---|
| Filename | modeM0/AS1A14_039T06_9000006526_54865cztM0_level2.fits | modeM0/AS1A14_039T06_9000006526_54865cztM0_level2_quad_clean.evt |
| Size (bytes) | 447,779,520 | 96,145,920 |
| Size | 427.0 MB | 91.7 MB |
| Events in quadrant A | 3,486,317 | 637,423 |
| Events in quadrant B | 3,148,321 | 691,962 |
| Events in quadrant C | 4,177,677 | 592,067 |
| Events in quadrant D | 5,256,997 | 536,381 |
| Mode M9 | |||
|---|---|---|---|
| Quadrant | BADHDUFLAG | Total packets | Discarded packets |
| A | 0 | 11 | 0 |
| B | 0 | 11 | 0 |
| C | 0 | 11 | 0 |
| D | 0 | 11 | 0 |
| Mode M0 | |||
|---|---|---|---|
| Quadrant | BADHDUFLAG | Total packets | Discarded packets |
| A | 0 | 14964 | 3 |
| B | 0 | 13942 | 2 |
| C | 0 | 16899 | 2 |
| D | 0 | 20069 | 2 |
| Mode SS | |||
|---|---|---|---|
| Quadrant | BADHDUFLAG | Total packets | Discarded packets |
| A | 0 | 132 | 0 |
| B | 0 | 132 | 0 |
| C | 0 | 132 | 0 |
| D | 0 | 132 | 0 |
| Quadrant | Total seconds | Saturated seconds | Saturation percentage |
|---|---|---|---|
| A | 6503 | 218 | 3.352299% |
| B | 6503 | 124 | 1.906812% |
| C | 6503 | 333 | 5.120714% |
| D | 6504 | 639 | 9.824723% |
Noise dominated data is calculated using 1-second bins in cleaned event files. If a bin has >2000 counts, and if more than 50% of those come from <1% of pixels, then it is considered to be noise-dominated and hence unusable.
| Quadrant | # 1 sec bins | Bins with >0 counts | Bins with >2000 counts | High rate bins dominated by noise | Noise dominated (total time) | Noise dominated (detector-on time) | Marked lightcurve |
|---|---|---|---|---|---|---|---|
| A | 7598 | 6503 | 109 | 109 | 1.43% | 1.68% | 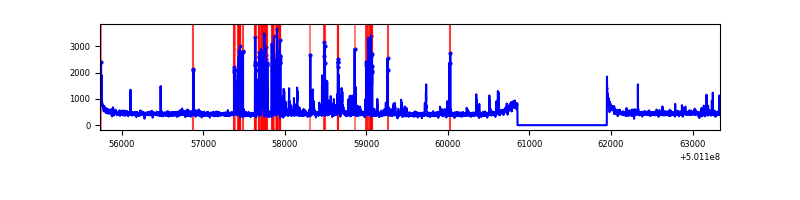 |
| B | 7598 | 6503 | 29 | 29 | 0.38% | 0.45% | 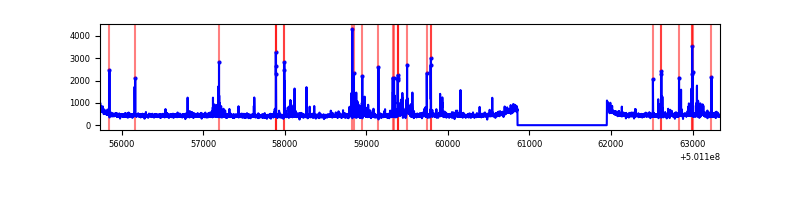 |
| C | 7598 | 6503 | 246 | 246 | 3.24% | 3.78% | 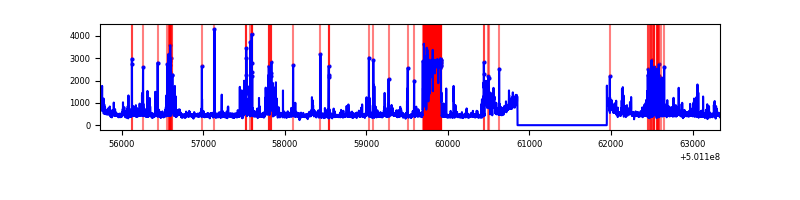 |
| D | 7598 | 6503 | 539 | 539 | 7.09% | 8.29% | 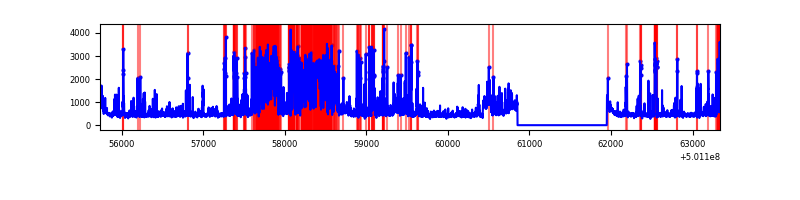 |
Top three noisy pixels from each quadrant. If the there are fewer than three noisy pixels in the level2.evt file, extra rows are filled as -1
| Pixel properties | Quadrant properties | ||||||
|---|---|---|---|---|---|---|---|
| Quadrant | DetID | PixID | Counts | Sigma | Mean | Median | Sigma |
| A | 13 | 248 | 427555 | 2368.76 | 729 | 711 | 180.2 |
| A | 0 | 8 | 175163 | 968.12 | 729 | 711 | 180.2 |
| A | 3 | 14 | 18533 | 98.9 | 729 | 711 | 180.2 |
| B | 5 | 185 | 120691 | 776.28 | 717 | 690 | 154.6 |
| B | 10 | 247 | 79538 | 510.07 | 717 | 690 | 154.6 |
| B | 7 | 252 | 27837 | 175.61 | 717 | 690 | 154.6 |
| C | 4 | 5 | 608062 | 3196.26 | 697 | 690 | 190.0 |
| C | 12 | 252 | 337256 | 1771.16 | 697 | 690 | 190.0 |
| C | 14 | 254 | 160945 | 843.33 | 697 | 690 | 190.0 |
| D | 12 | 6 | 1170052 | 5989.29 | 689 | 660 | 195.2 |
| D | 11 | 176 | 403436 | 2062.9 | 689 | 660 | 195.2 |
| D | 10 | 181 | 213977 | 1092.55 | 689 | 660 | 195.2 |
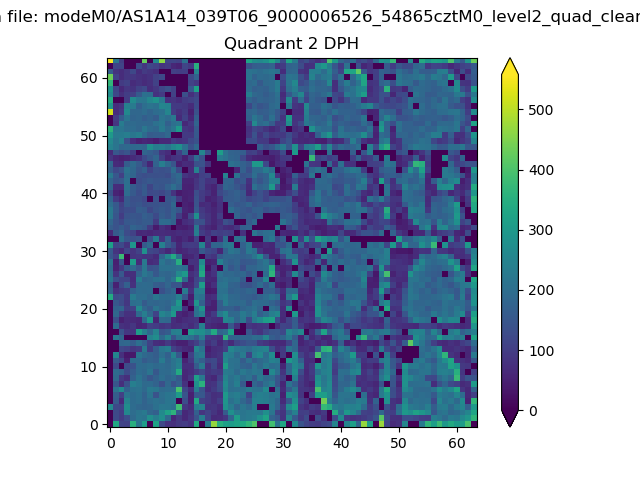
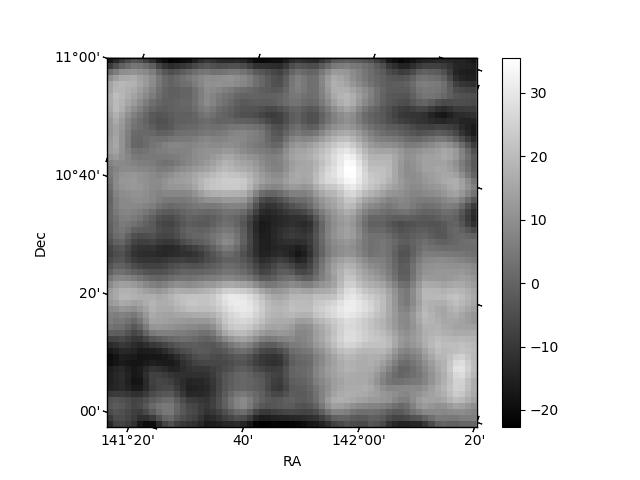
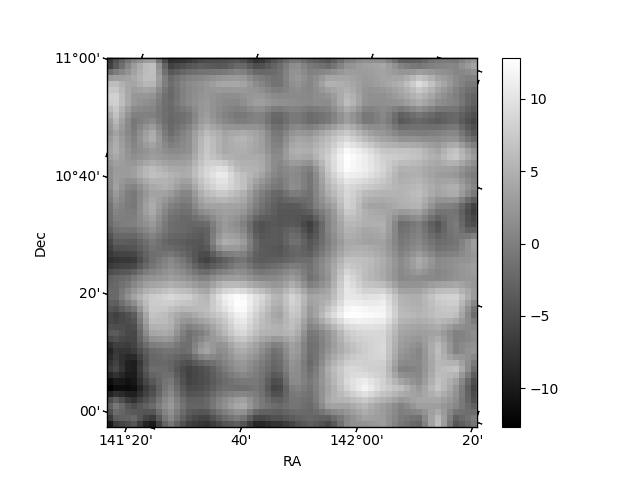
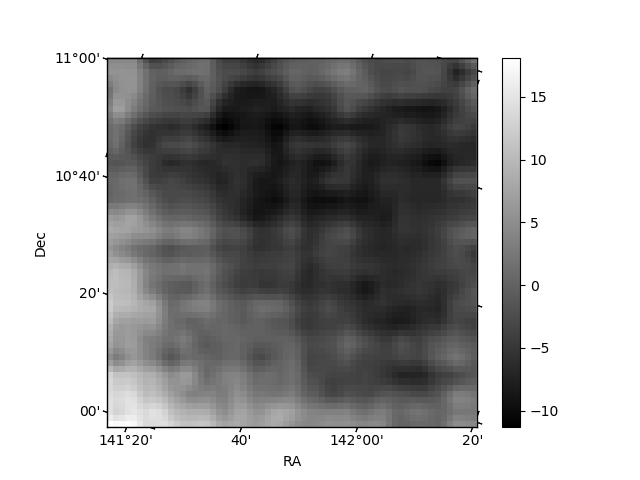
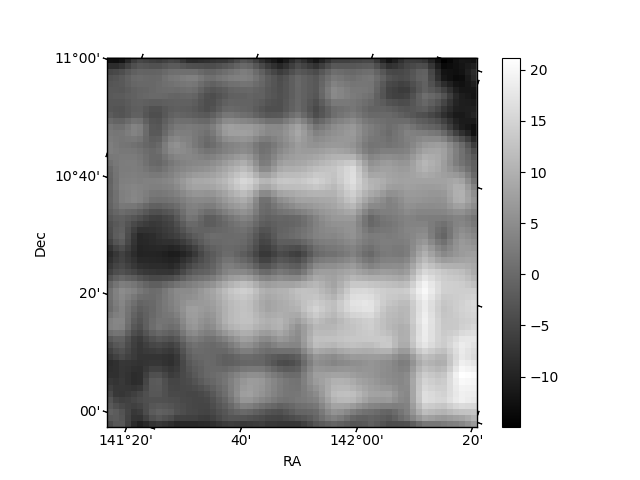
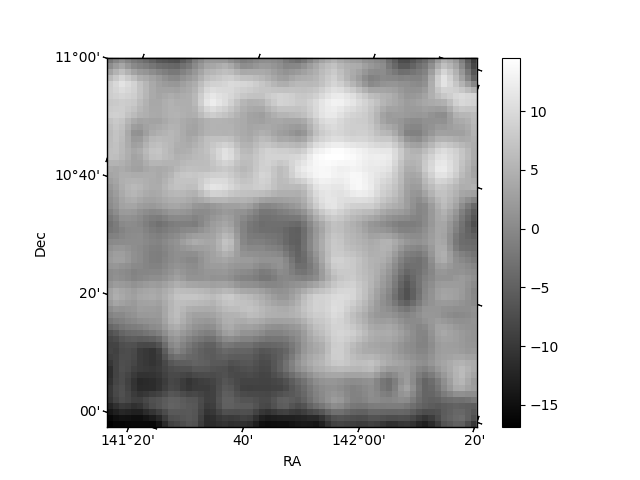
Histogram calculated using DETX and DETY for each event in the final _common_clean file
| Quadrant A | 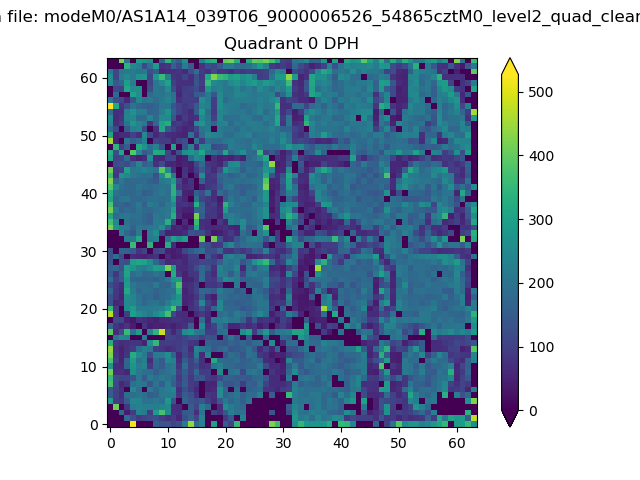 |
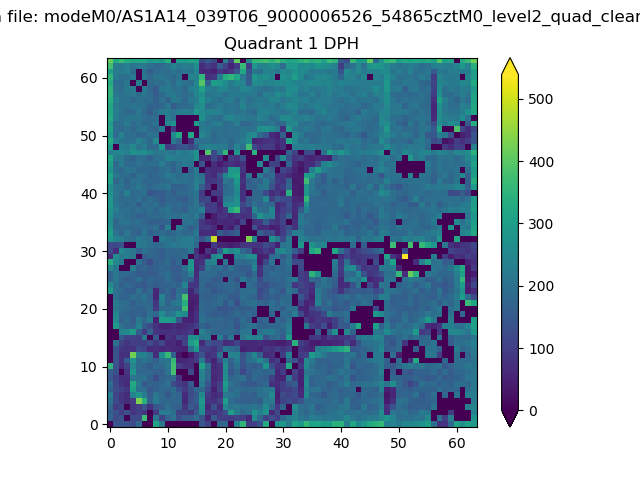 |
Quadrant B |
|---|---|---|---|
| Quadrant D | 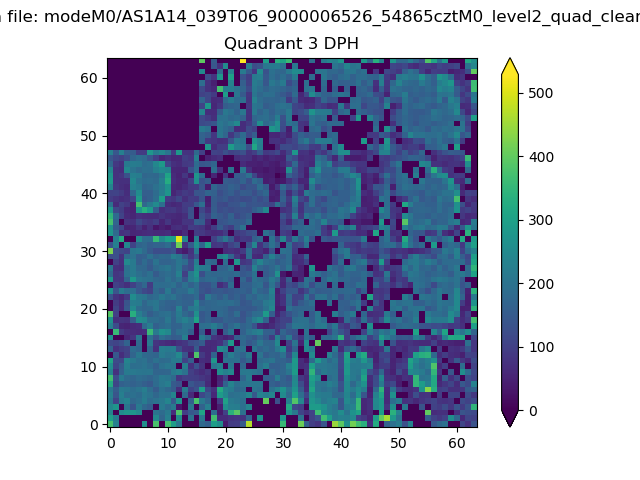 |
 |
Quadrant C |
| Plot type | Count rate plots | Images |
|---|---|---|
| Comparison with Poisson distribution Blue bars denote a histogram of data divided into 1 sec bins. Red curve is a Poisson curve with rate = median count rate of data. |
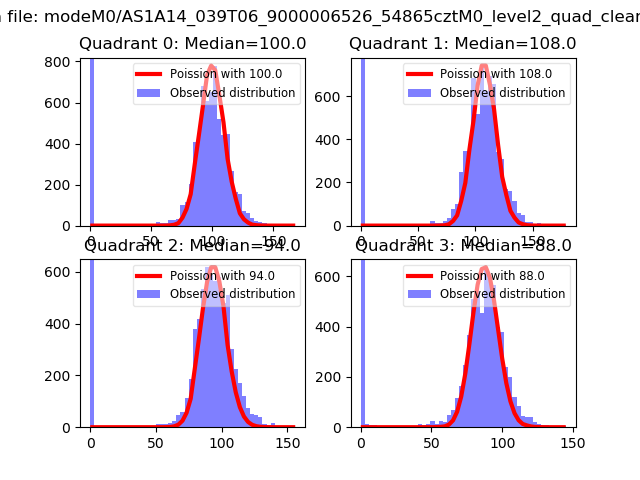 |
 |
| Quadrant-wise count rates Data is divided into 100 sec bins |
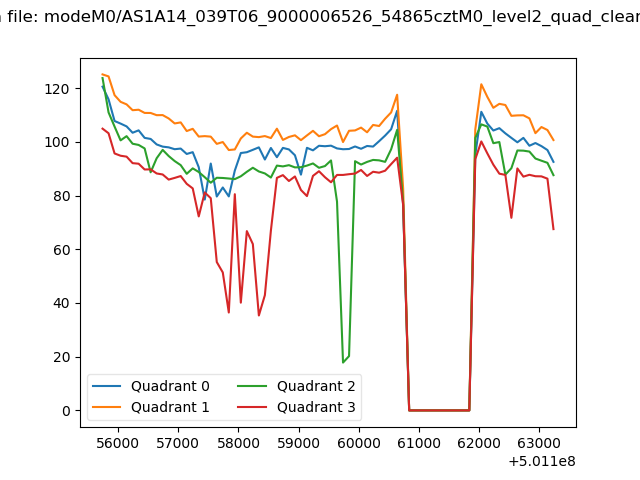 |
|
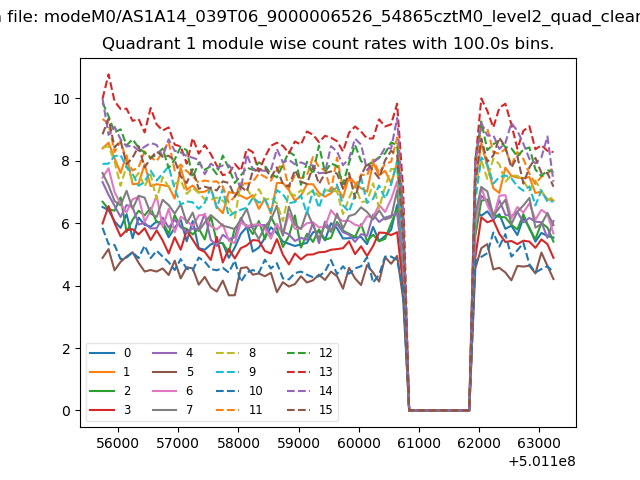
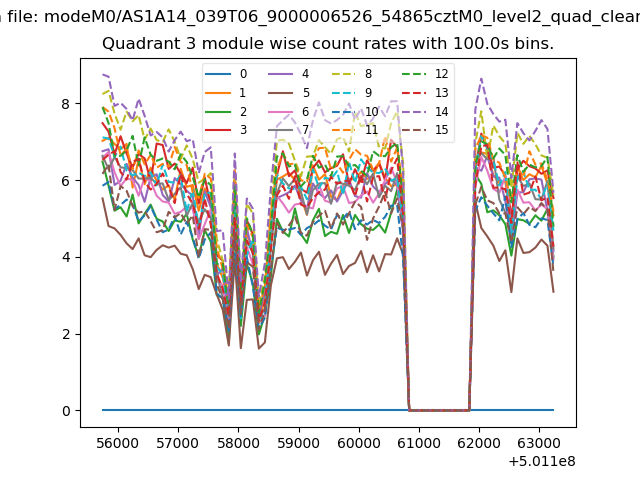
| Module-wise count rates for Quadrant A Data is divided into 100 sec bins |
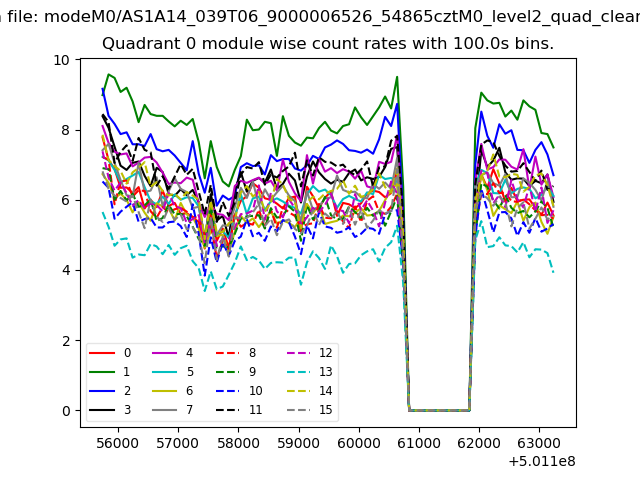 |
 |
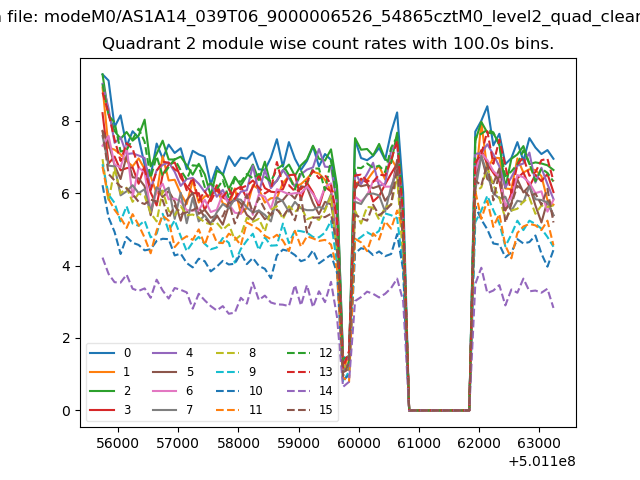
| Module-wise count rates for Quadrant B Data is divided into 100 sec bins |
 |
 |
| Module-wise count rates for Quadrant C Data is divided into 100 sec bins |
 |
 |
| Module-wise count rates for Quadrant D Data is divided into 100 sec bins |
 |
 |
| Parameter | Plot |
|---|---|
| CZT HV Monitor | 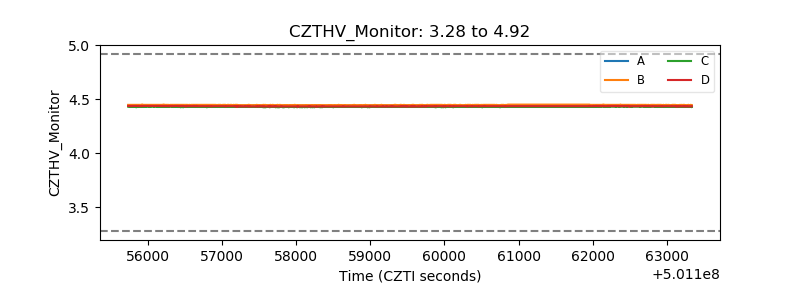 |
| D_VDD | 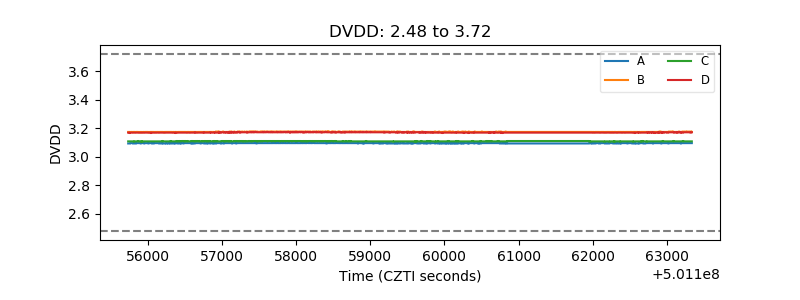 |
| Temperature 1 | 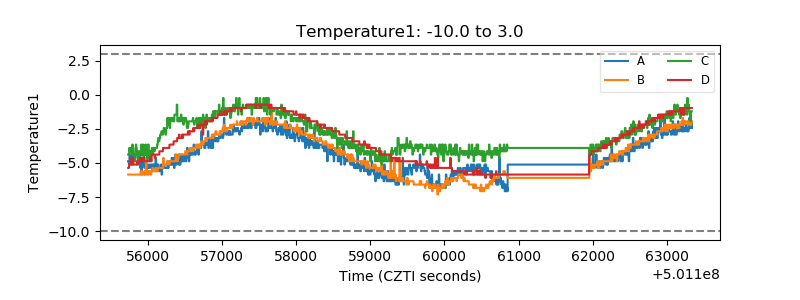 |
| Veto HV Monitor | 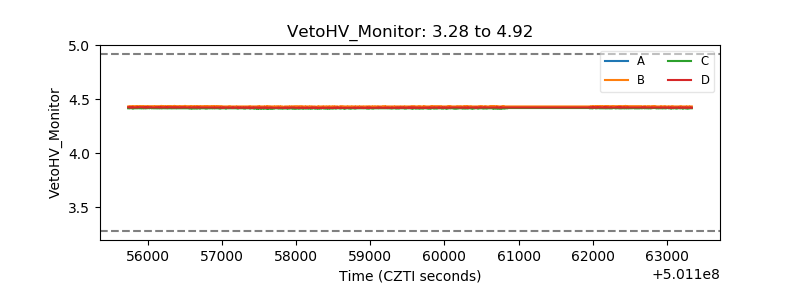 |
| Veto LLD | 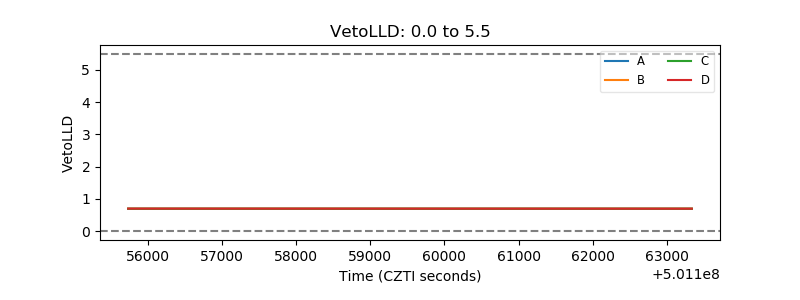 |
| Alpha Counter | 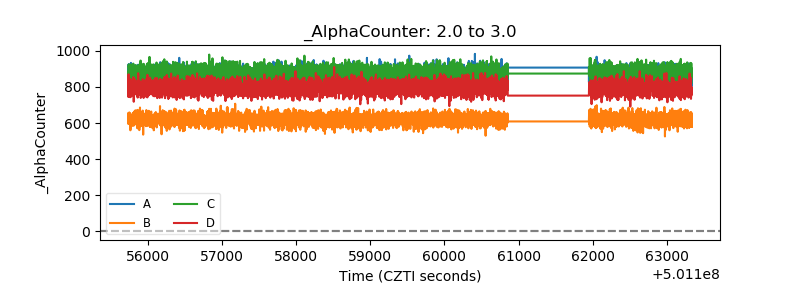 |
| _CPM_Rate | 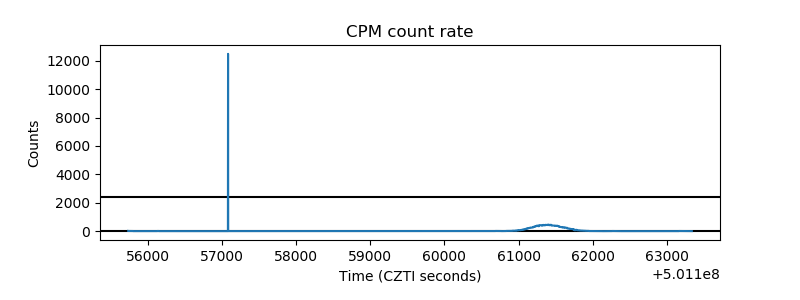 |
| CZT Counter | 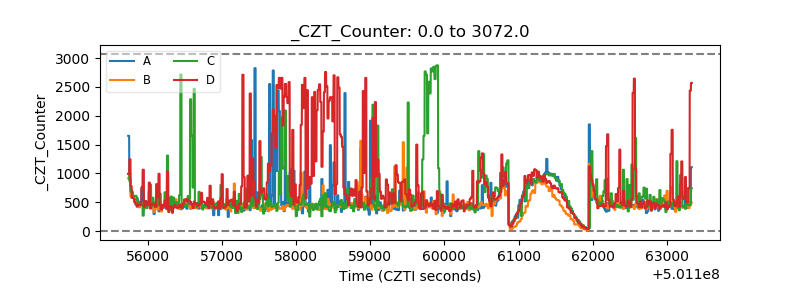 |
| +2.5 Volts monitor | 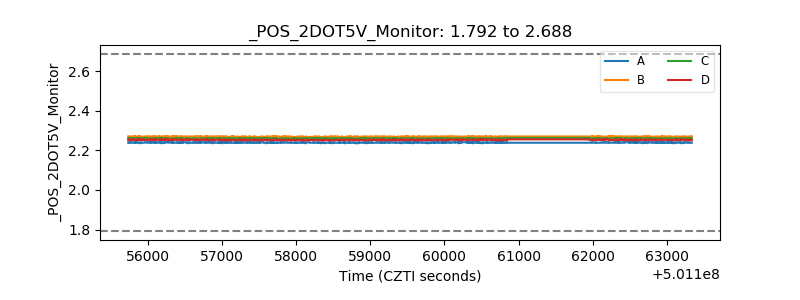 |
| +5 Volts monitor | 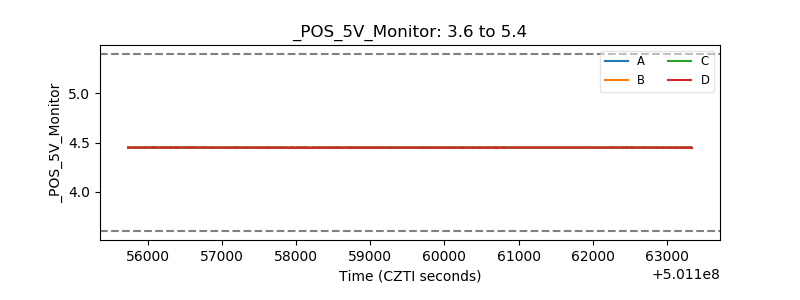 |
| _ROLL_ROT | 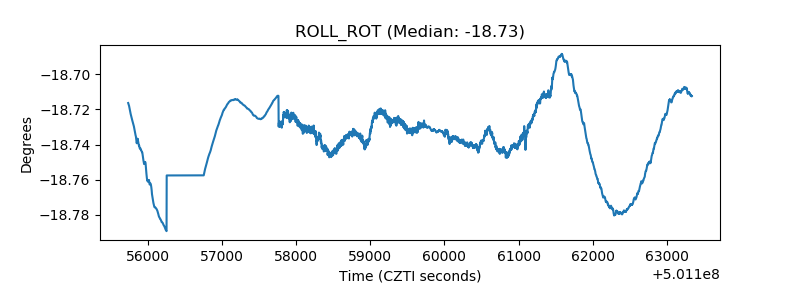 |
| _Roll_DEC | 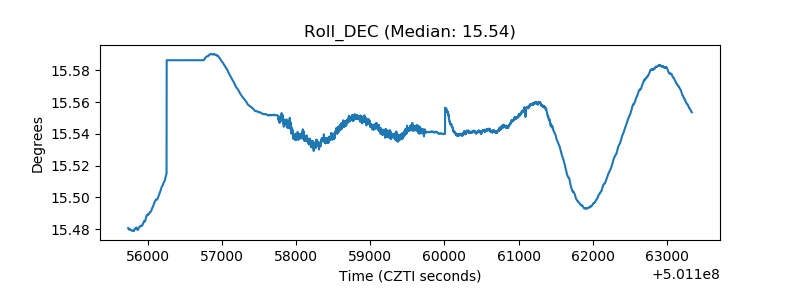 |
| _Roll_RA | 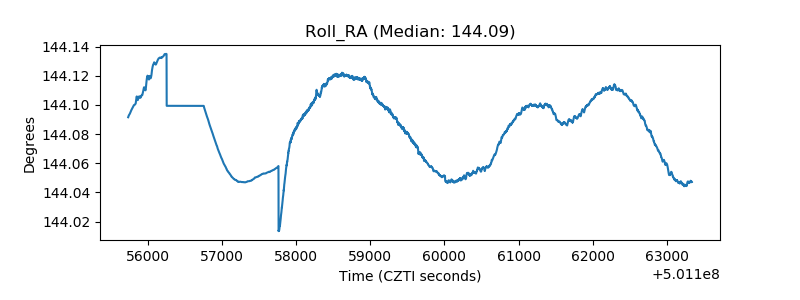 |
| Veto Counter | 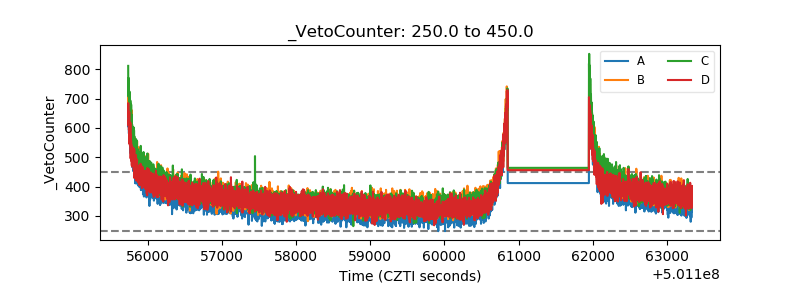 |