| Param | Original file | Final file |
|---|---|---|
| Filename | modeM0/AS1A14_039T06_9000006526_54866cztM0_level2.fits | modeM0/AS1A14_039T06_9000006526_54866cztM0_level2_quad_clean.evt |
| Size (bytes) | 1,358,187,840 | 318,876,480 |
| Size | 1.3 GB | 304.1 MB |
| Events in quadrant A | 11,406,911 | 2,086,337 |
| Events in quadrant B | 10,380,226 | 2,259,001 |
| Events in quadrant C | 13,121,922 | 1,966,243 |
| Events in quadrant D | 13,678,452 | 1,843,129 |
| Mode M9 | |||
|---|---|---|---|
| Quadrant | BADHDUFLAG | Total packets | Discarded packets |
| A | 0 | 43 | 0 |
| B | 0 | 43 | 0 |
| C | 0 | 43 | 0 |
| D | 0 | 43 | 0 |
| Mode M0 | |||
|---|---|---|---|
| Quadrant | BADHDUFLAG | Total packets | Discarded packets |
| A | 0 | 49743 | 4 |
| B | 0 | 46564 | 4 |
| C | 0 | 54052 | 6 |
| D | 0 | 55708 | 4 |
| Mode SS | |||
|---|---|---|---|
| Quadrant | BADHDUFLAG | Total packets | Discarded packets |
| A | 0 | 444 | 0 |
| B | 0 | 444 | 0 |
| C | 0 | 444 | 0 |
| D | 0 | 444 | 0 |
| Quadrant | Total seconds | Saturated seconds | Saturation percentage |
|---|---|---|---|
| A | 21800 | 678 | 3.110092% |
| B | 21801 | 404 | 1.853126% |
| C | 21800 | 801 | 3.674312% |
| D | 21801 | 986 | 4.522728% |
Noise dominated data is calculated using 1-second bins in cleaned event files. If a bin has >2000 counts, and if more than 50% of those come from <1% of pixels, then it is considered to be noise-dominated and hence unusable.
| Quadrant | # 1 sec bins | Bins with >0 counts | Bins with >2000 counts | High rate bins dominated by noise | Noise dominated (total time) | Noise dominated (detector-on time) | Marked lightcurve |
|---|---|---|---|---|---|---|---|
| A | 26040 | 21800 | 331 | 331 | 1.27% | 1.52% | 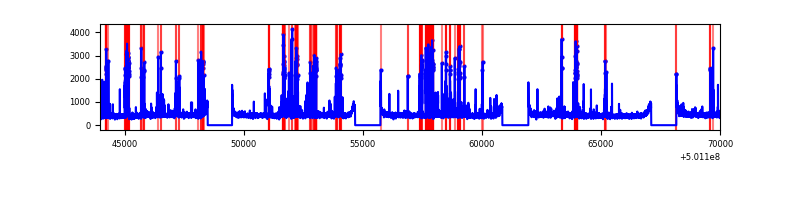 |
| B | 26041 | 21801 | 58 | 58 | 0.22% | 0.27% | 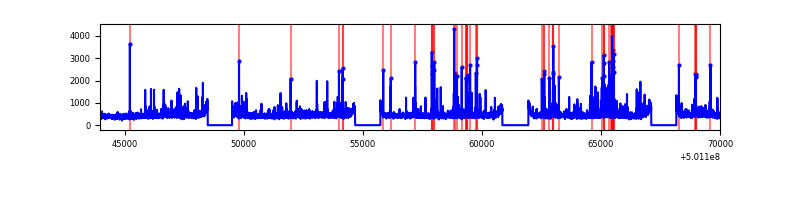 |
| C | 26041 | 21802 | 519 | 519 | 1.99% | 2.38% | 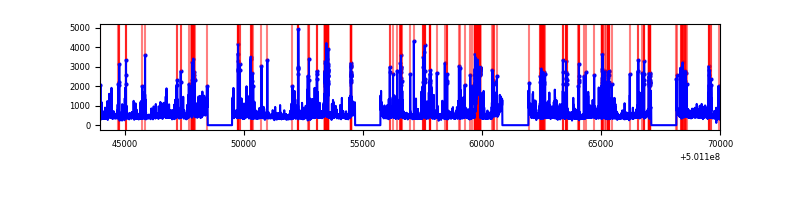 |
| D | 26041 | 21802 | 724 | 724 | 2.78% | 3.32% | 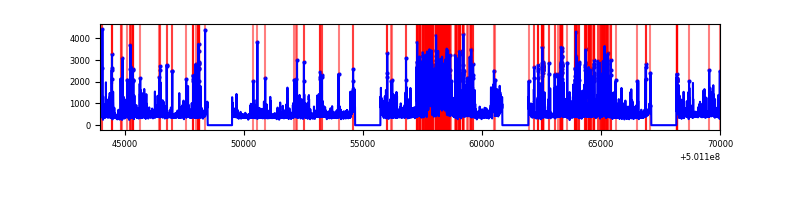 |
Top three noisy pixels from each quadrant. If the there are fewer than three noisy pixels in the level2.evt file, extra rows are filled as -1
| Pixel properties | Quadrant properties | ||||||
|---|---|---|---|---|---|---|---|
| Quadrant | DetID | PixID | Counts | Sigma | Mean | Median | Sigma |
| A | 0 | 8 | 1056917 | 1797.46 | 2397 | 2334 | 586.7 |
| A | 13 | 248 | 440136 | 746.2 | 2397 | 2334 | 586.7 |
| A | 0 | 250 | 266298 | 449.91 | 2397 | 2334 | 586.7 |
| B | 5 | 185 | 451755 | 897.02 | 2355 | 2266 | 501.1 |
| B | 10 | 247 | 238095 | 470.63 | 2355 | 2266 | 501.1 |
| B | 2 | 249 | 79418 | 153.97 | 2355 | 2266 | 501.1 |
| C | 12 | 252 | 1298339 | 2074.81 | 2300 | 2278 | 624.7 |
| C | 4 | 5 | 1132202 | 1808.85 | 2300 | 2278 | 624.7 |
| C | 14 | 254 | 813891 | 1299.28 | 2300 | 2278 | 624.7 |
| D | 12 | 6 | 1210206 | 1855.74 | 2310 | 2214 | 650.9 |
| D | 11 | 176 | 745952 | 1142.55 | 2310 | 2214 | 650.9 |
| D | 11 | 129 | 399578 | 610.44 | 2310 | 2214 | 650.9 |
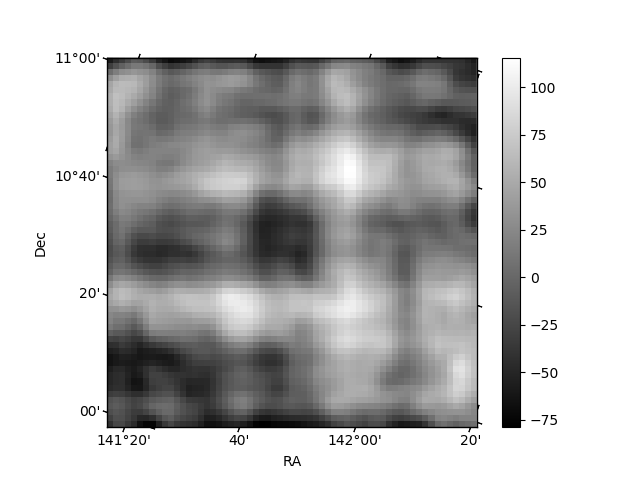
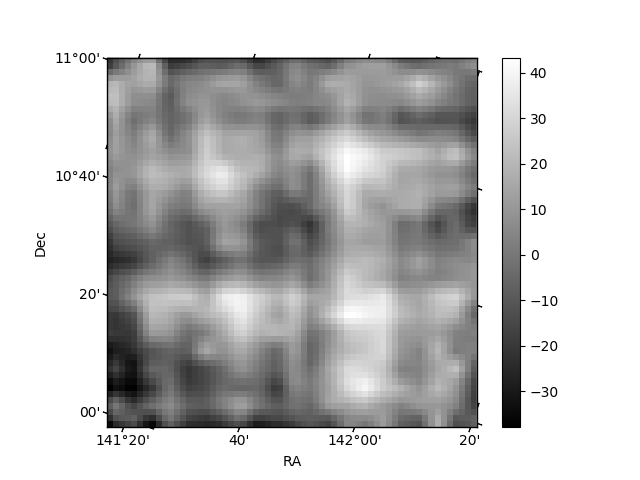
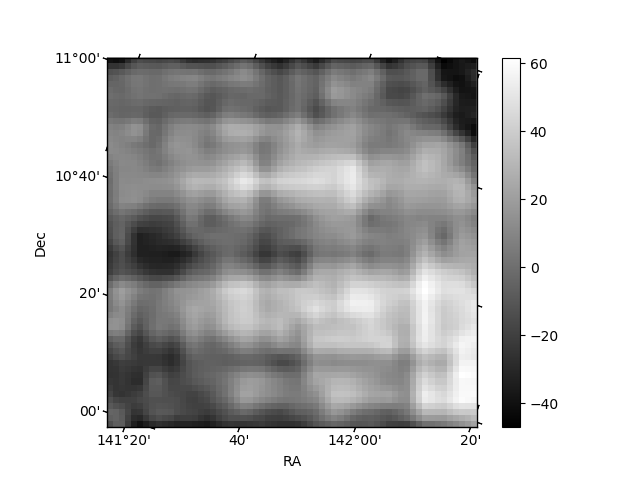
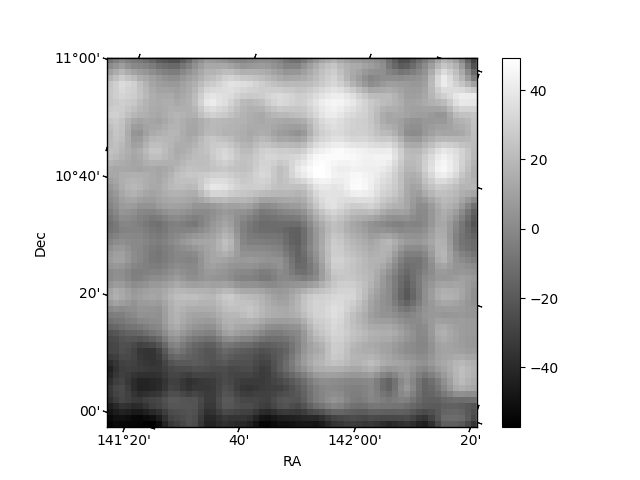
Histogram calculated using DETX and DETY for each event in the final _common_clean file
| Quadrant A | 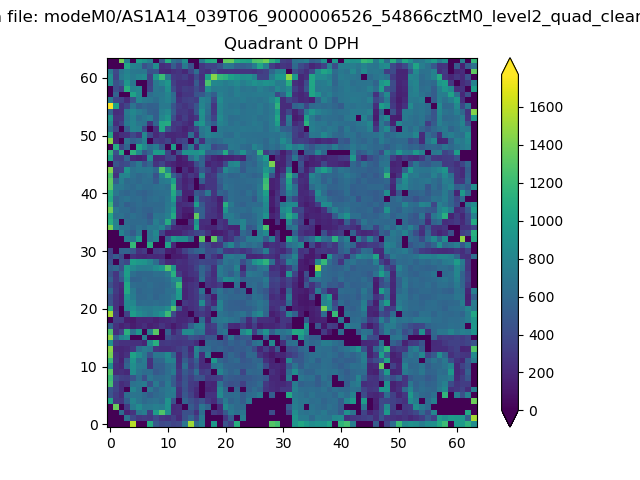 |
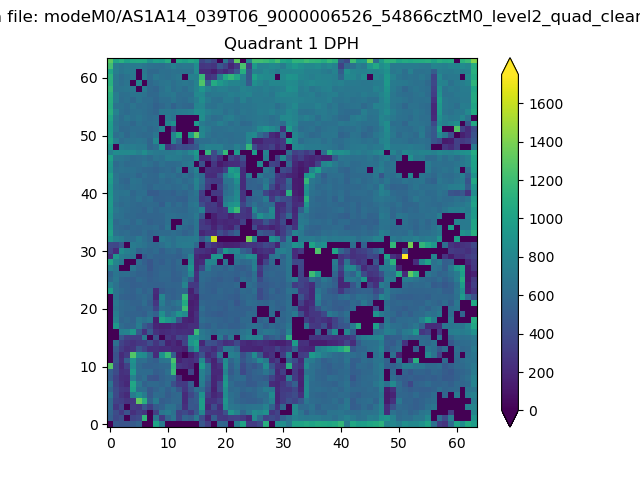 |
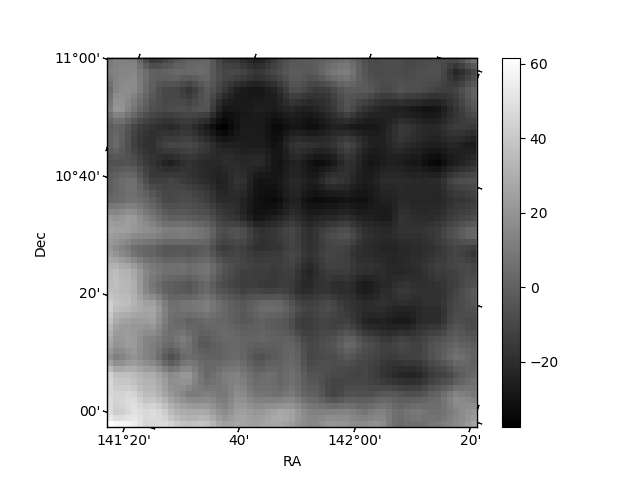
Quadrant B |
|---|---|---|---|
| Quadrant D | 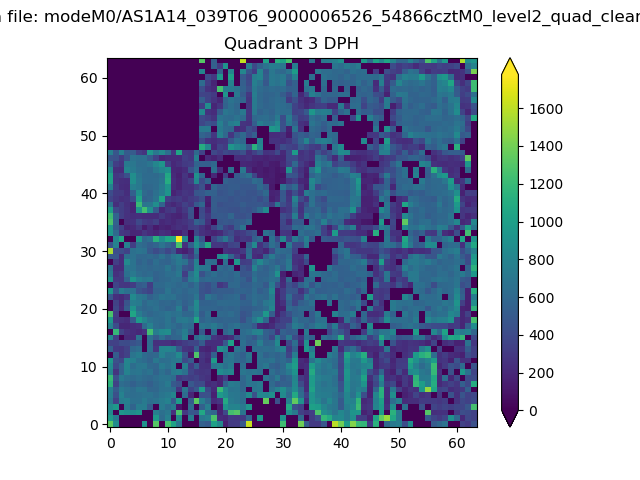 |
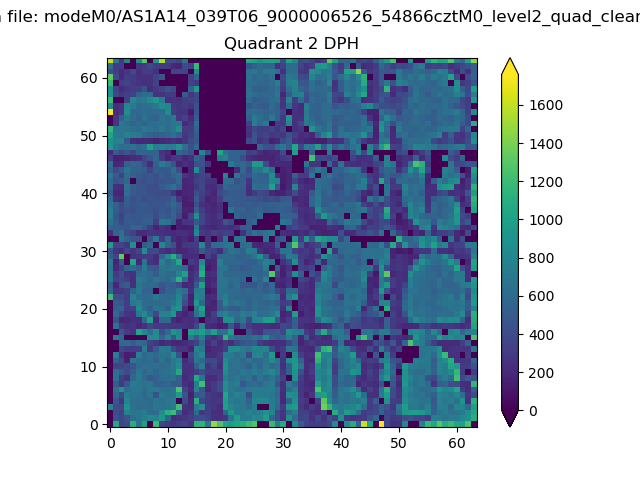 |
Quadrant C |
| Plot type | Count rate plots | Images |
|---|---|---|
| Comparison with Poisson distribution Blue bars denote a histogram of data divided into 1 sec bins. Red curve is a Poisson curve with rate = median count rate of data. |
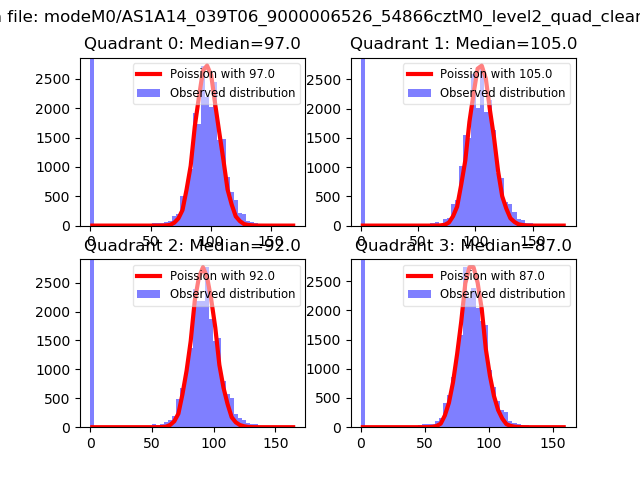 |
 |
| Quadrant-wise count rates Data is divided into 100 sec bins |
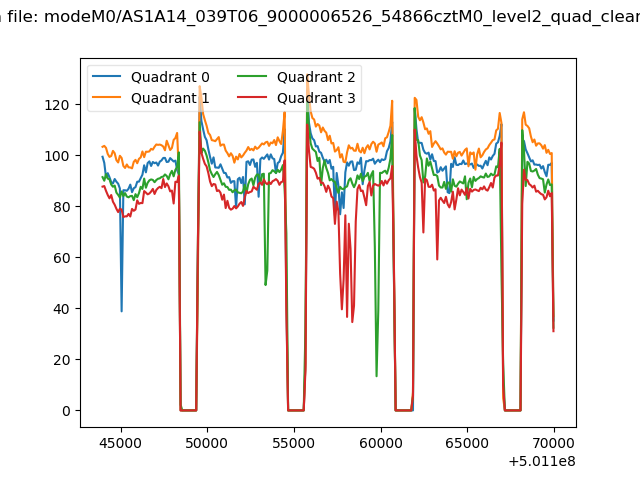 |
|
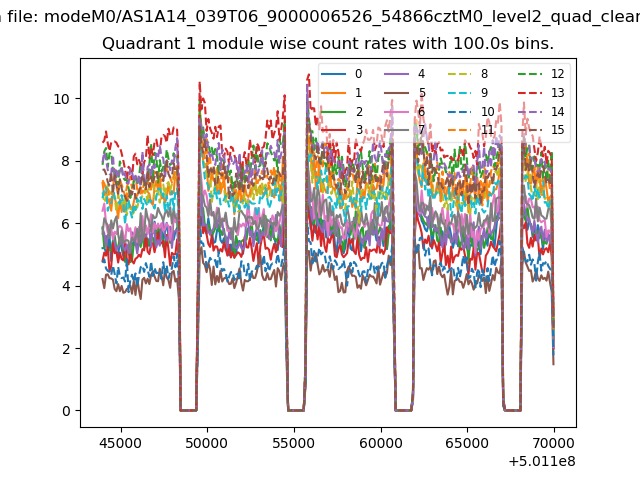
| Module-wise count rates for Quadrant A Data is divided into 100 sec bins |
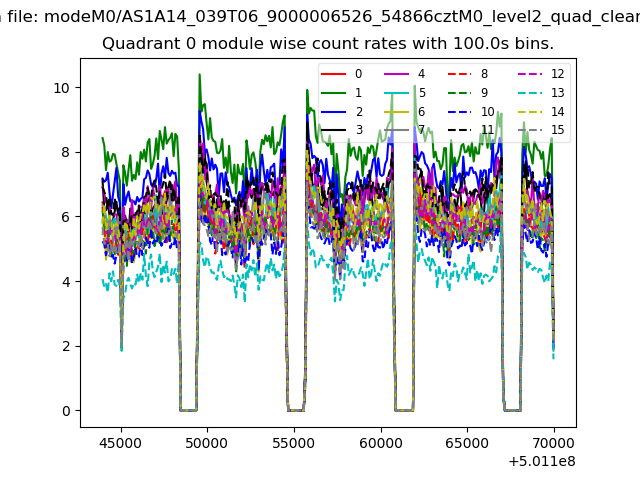 |
 |
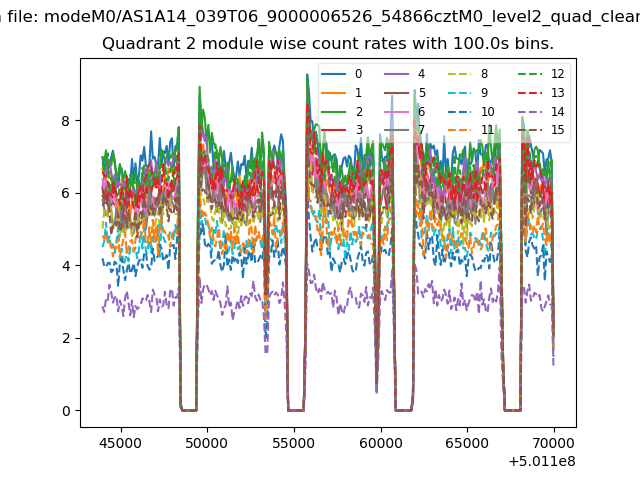
| Module-wise count rates for Quadrant B Data is divided into 100 sec bins |
 |
 |
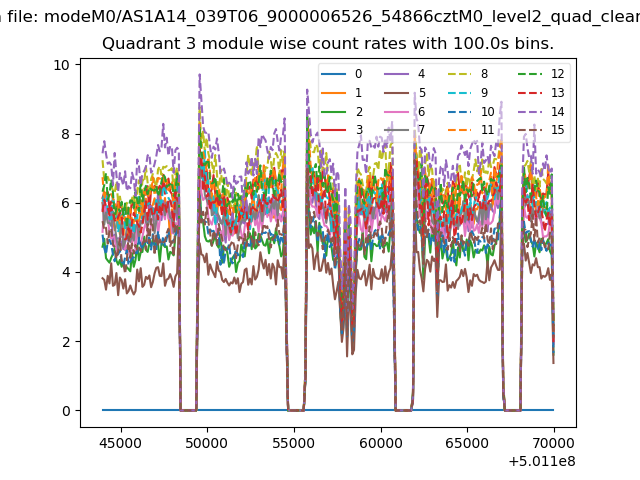
| Module-wise count rates for Quadrant C Data is divided into 100 sec bins |
 |
 |
| Module-wise count rates for Quadrant D Data is divided into 100 sec bins |
 |
 |
| Parameter | Plot |
|---|---|
| CZT HV Monitor | 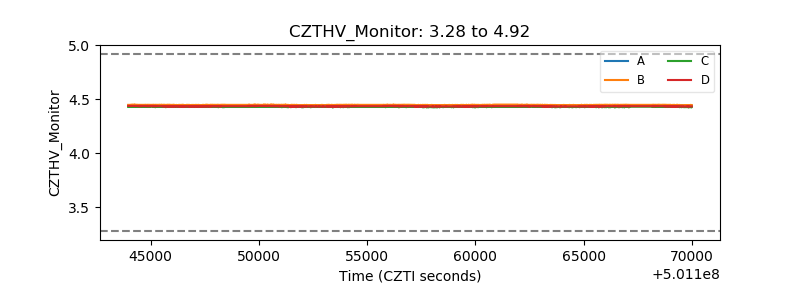 |
| D_VDD | 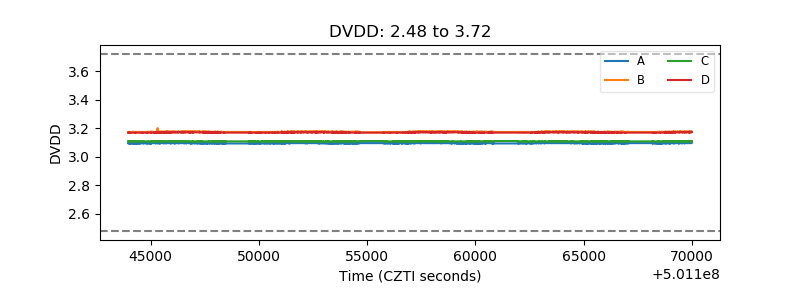 |
| Temperature 1 | 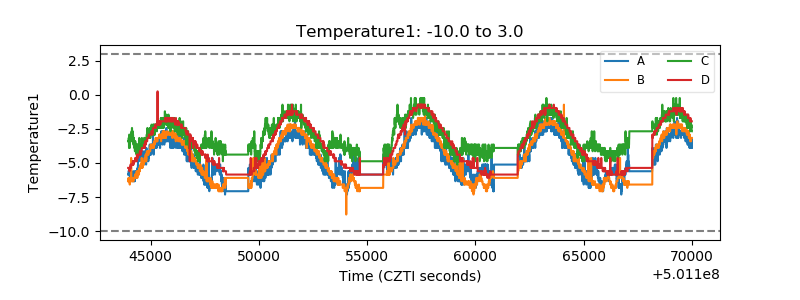 |
| Veto HV Monitor |  |
| Veto LLD | 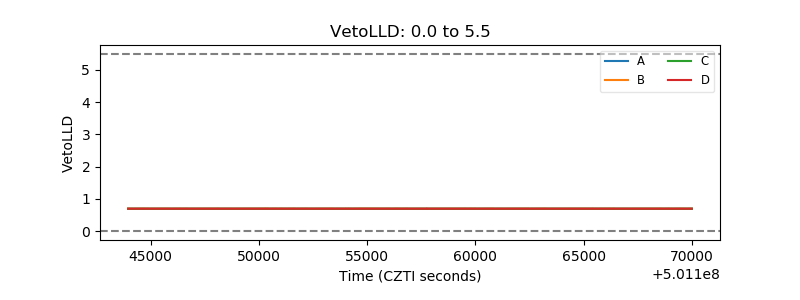 |
| Alpha Counter | 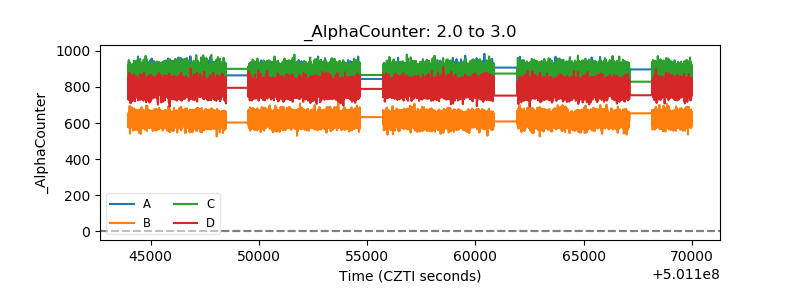 |
| _CPM_Rate | 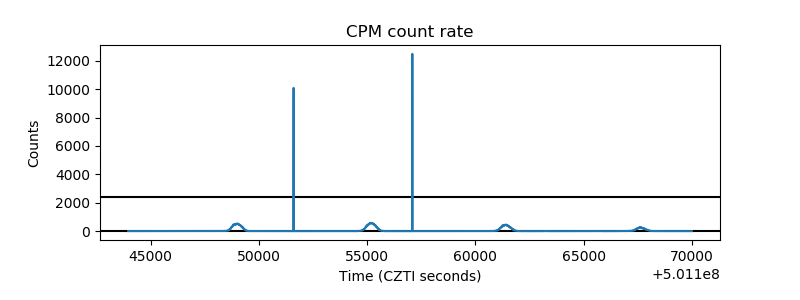 |
| CZT Counter | 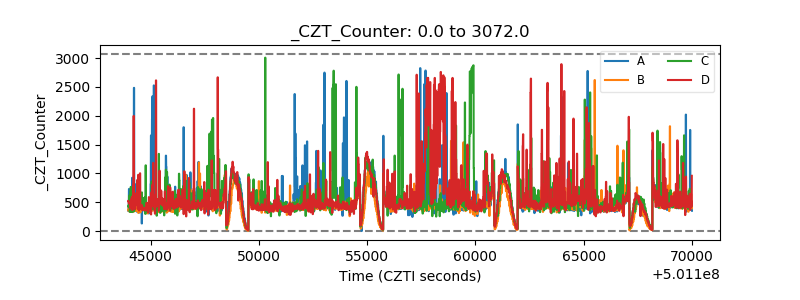 |
| +2.5 Volts monitor | 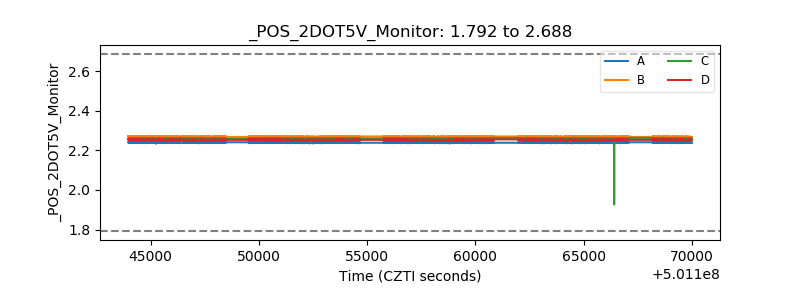 |
| +5 Volts monitor | 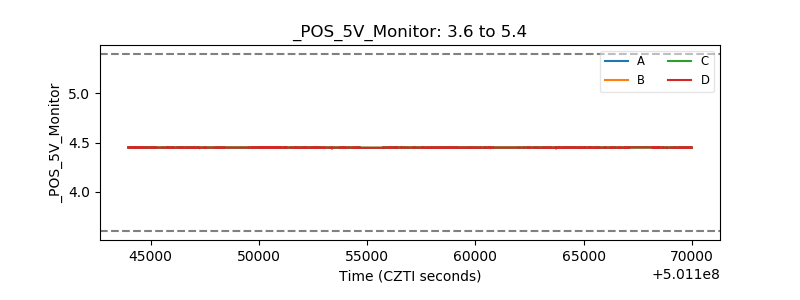 |
| _ROLL_ROT | 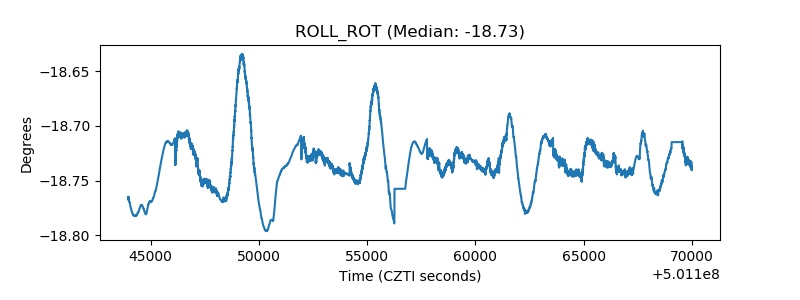 |
| _Roll_DEC | 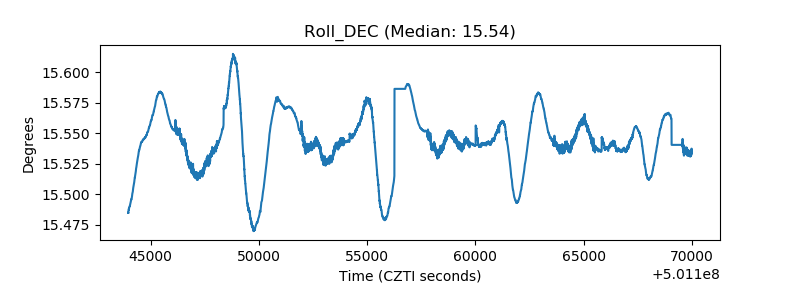 |
| _Roll_RA | 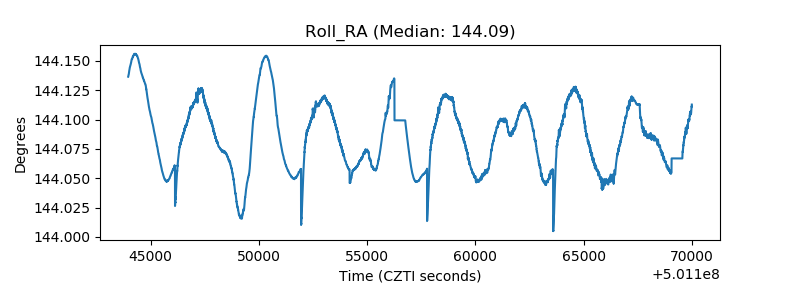 |
| Veto Counter | 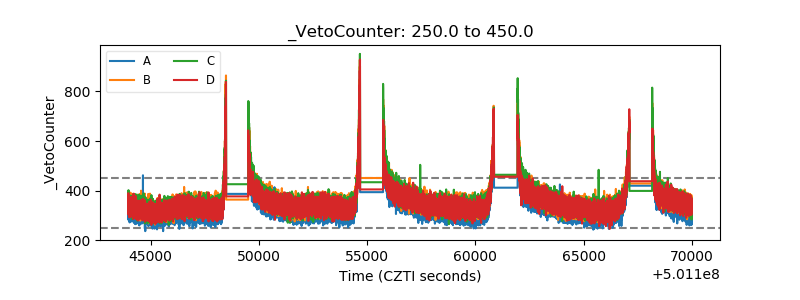 |