| Param | Original file | Final file |
|---|---|---|
| Filename | modeM0/AS1A14_039T06_9000006526_54867cztM0_level2.fits | modeM0/AS1A14_039T06_9000006526_54867cztM0_level2_quad_clean.evt |
| Size (bytes) | 699,814,080 | 160,571,520 |
| Size | 667.4 MB | 153.1 MB |
| Events in quadrant A | 5,255,799 | 1,059,102 |
| Events in quadrant B | 5,543,041 | 1,120,840 |
| Events in quadrant C | 6,657,550 | 988,182 |
| Events in quadrant D | 7,586,299 | 925,045 |
| Mode M9 | |||
|---|---|---|---|
| Quadrant | BADHDUFLAG | Total packets | Discarded packets |
| A | 0 | 18 | 0 |
| B | 0 | 18 | 0 |
| C | 0 | 18 | 0 |
| D | 0 | 18 | 0 |
| Mode M0 | |||
|---|---|---|---|
| Quadrant | BADHDUFLAG | Total packets | Discarded packets |
| A | 0 | 23895 | 2 |
| B | 0 | 24364 | 2 |
| C | 0 | 27574 | 4 |
| D | 0 | 30230 | 2 |
| Mode SS | |||
|---|---|---|---|
| Quadrant | BADHDUFLAG | Total packets | Discarded packets |
| A | 0 | 226 | 0 |
| B | 0 | 226 | 0 |
| C | 0 | 226 | 0 |
| D | 0 | 226 | 0 |
| Quadrant | Total seconds | Saturated seconds | Saturation percentage |
|---|---|---|---|
| A | 11111 | 258 | 2.322023% |
| B | 11111 | 283 | 2.547025% |
| C | 11111 | 386 | 3.474035% |
| D | 11111 | 553 | 4.977050% |
Noise dominated data is calculated using 1-second bins in cleaned event files. If a bin has >2000 counts, and if more than 50% of those come from <1% of pixels, then it is considered to be noise-dominated and hence unusable.
| Quadrant | # 1 sec bins | Bins with >0 counts | Bins with >2000 counts | High rate bins dominated by noise | Noise dominated (total time) | Noise dominated (detector-on time) | Marked lightcurve |
|---|---|---|---|---|---|---|---|
| A | 12986 | 11111 | 59 | 59 | 0.45% | 0.53% | 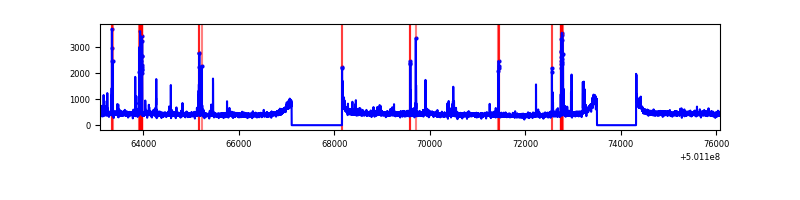 |
| B | 12986 | 11111 | 48 | 48 | 0.37% | 0.43% | 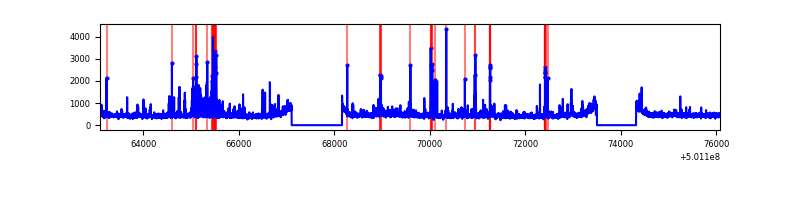 |
| C | 12986 | 11111 | 216 | 216 | 1.66% | 1.94% | 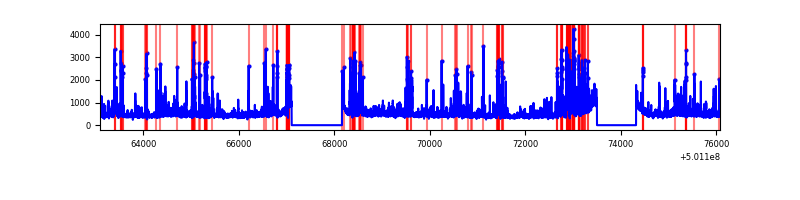 |
| D | 12986 | 11111 | 408 | 408 | 3.14% | 3.67% | 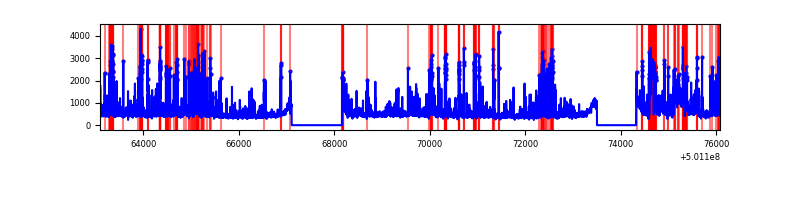 |
Top three noisy pixels from each quadrant. If the there are fewer than three noisy pixels in the level2.evt file, extra rows are filled as -1
| Pixel properties | Quadrant properties | ||||||
|---|---|---|---|---|---|---|---|
| Quadrant | DetID | PixID | Counts | Sigma | Mean | Median | Sigma |
| A | 0 | 8 | 343453 | 1130.14 | 1233 | 1202 | 302.8 |
| A | 3 | 14 | 60316 | 195.2 | 1233 | 1202 | 302.8 |
| A | 4 | 3 | 23396 | 73.29 | 1233 | 1202 | 302.8 |
| B | 5 | 185 | 290620 | 1118.14 | 1208 | 1164 | 258.9 |
| B | 10 | 247 | 190012 | 729.5 | 1208 | 1164 | 258.9 |
| B | 12 | 6 | 121650 | 465.43 | 1208 | 1164 | 258.9 |
| C | 12 | 252 | 622856 | 1912.86 | 1188 | 1178 | 325.0 |
| C | 14 | 254 | 541033 | 1661.1 | 1188 | 1178 | 325.0 |
| C | 4 | 5 | 443025 | 1359.53 | 1188 | 1178 | 325.0 |
| D | 11 | 176 | 1002411 | 2964.59 | 1189 | 1137 | 337.7 |
| D | 9 | 19 | 524019 | 1548.16 | 1189 | 1137 | 337.7 |
| D | 11 | 129 | 302440 | 892.1 | 1189 | 1137 | 337.7 |
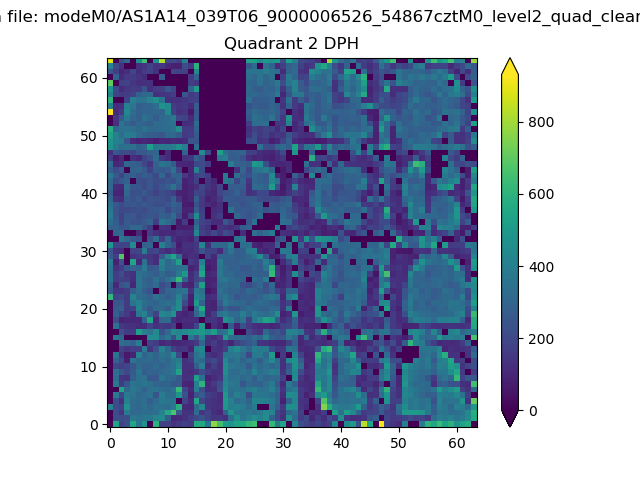
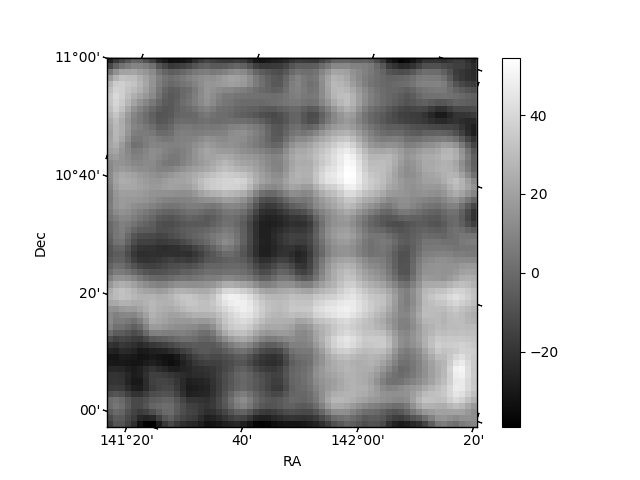
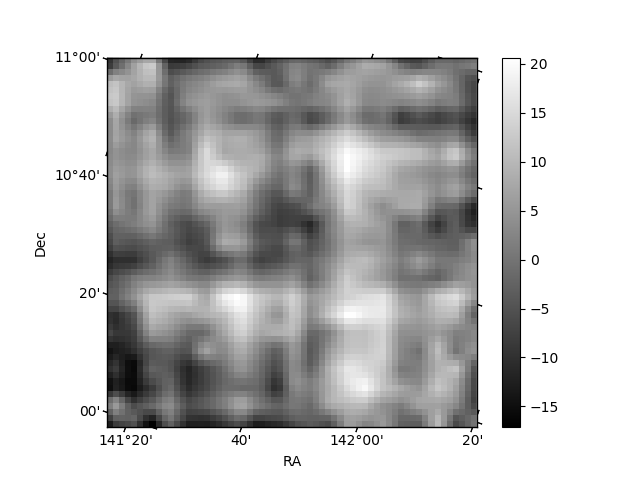
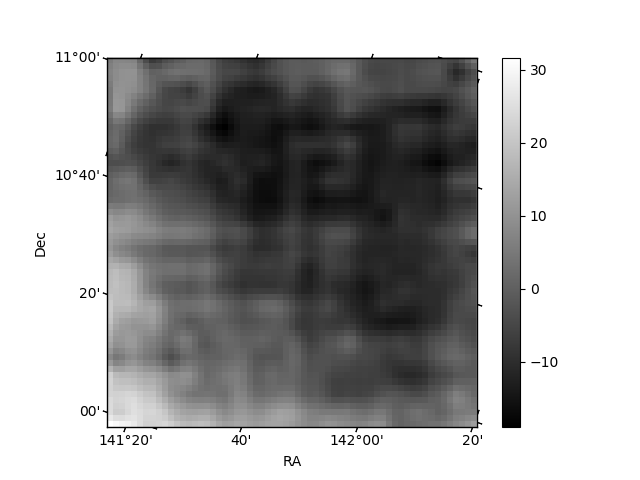
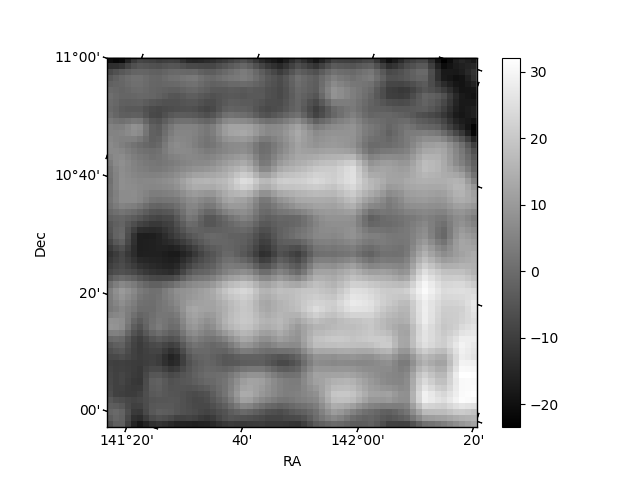
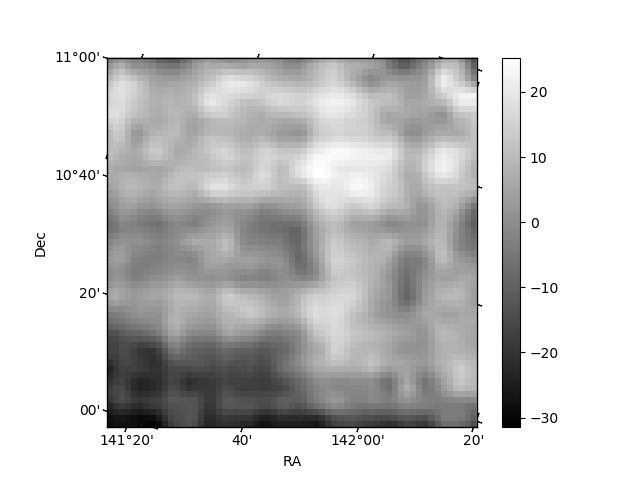
Histogram calculated using DETX and DETY for each event in the final _common_clean file
| Quadrant A | 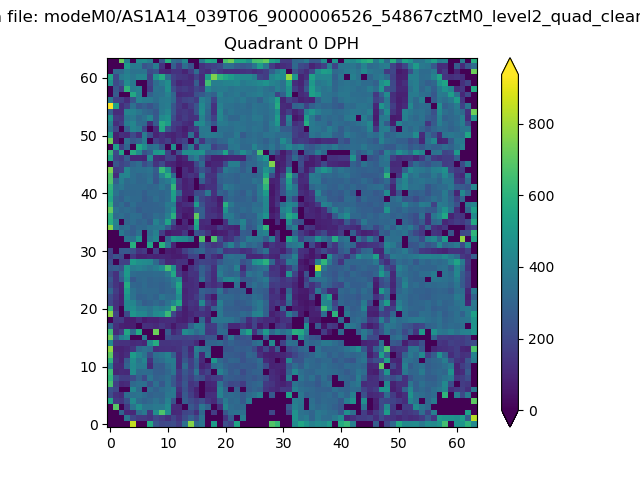 |
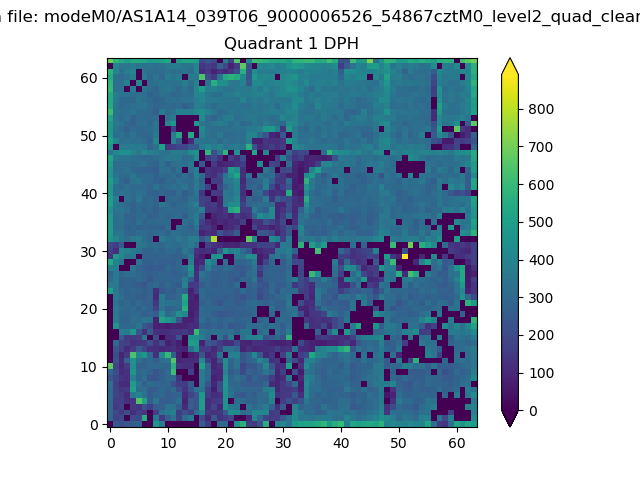 |
Quadrant B |
|---|---|---|---|
| Quadrant D | 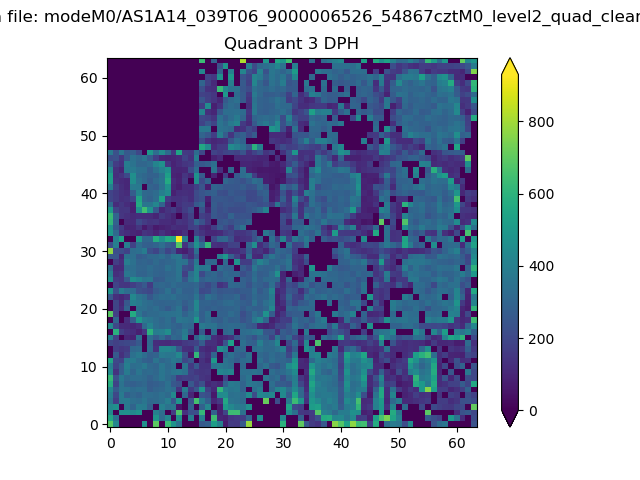 |
 |
Quadrant C |
| Plot type | Count rate plots | Images |
|---|---|---|
| Comparison with Poisson distribution Blue bars denote a histogram of data divided into 1 sec bins. Red curve is a Poisson curve with rate = median count rate of data. |
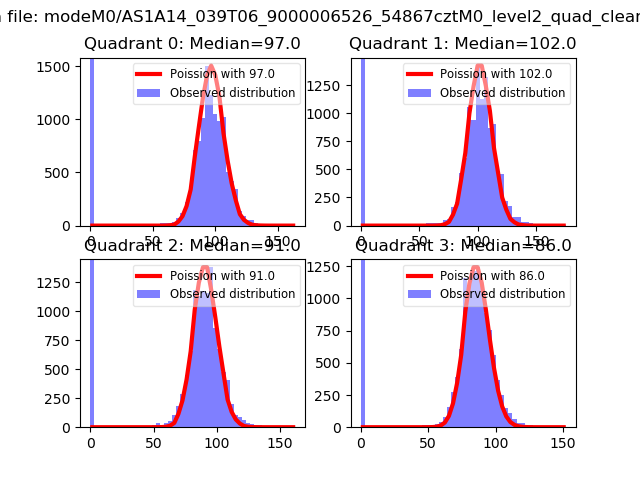 |
 |
| Quadrant-wise count rates Data is divided into 100 sec bins |
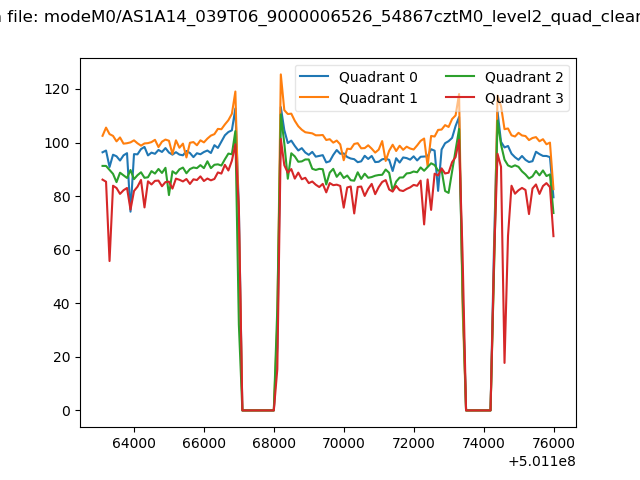 |
|
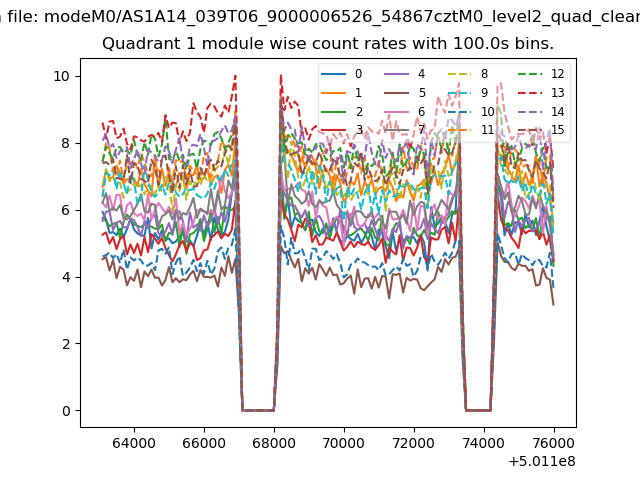
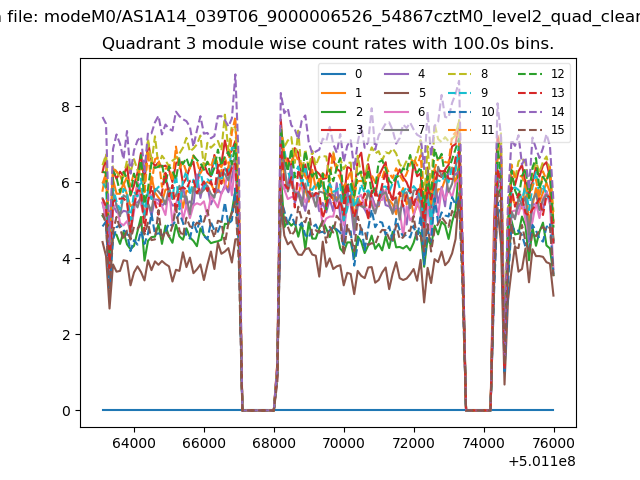
| Module-wise count rates for Quadrant A Data is divided into 100 sec bins |
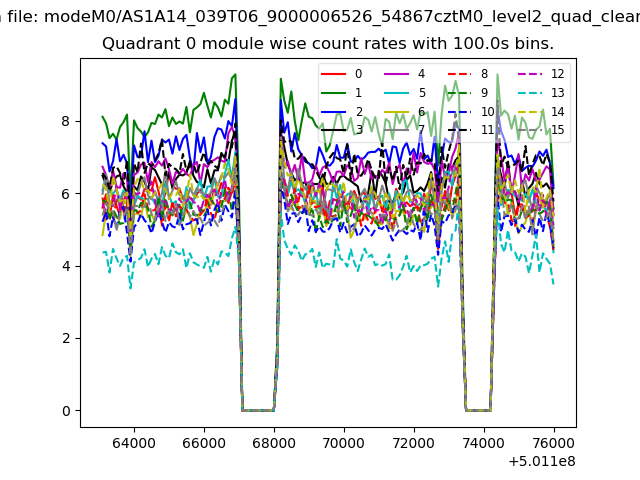 |
 |
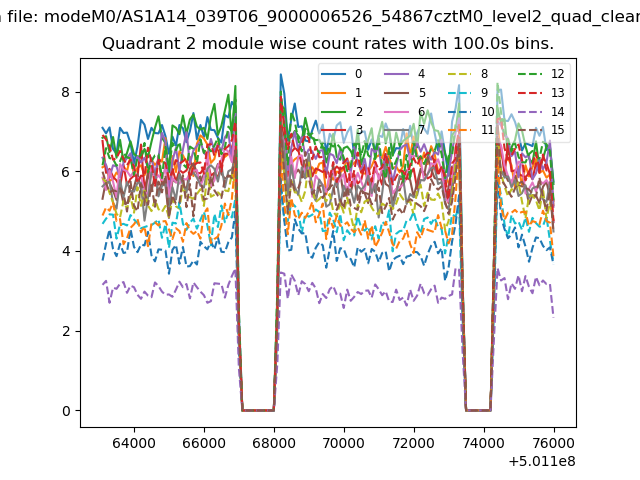
| Module-wise count rates for Quadrant B Data is divided into 100 sec bins |
 |
 |
| Module-wise count rates for Quadrant C Data is divided into 100 sec bins |
 |
 |
| Module-wise count rates for Quadrant D Data is divided into 100 sec bins |
 |
 |
| Parameter | Plot |
|---|---|
| CZT HV Monitor | 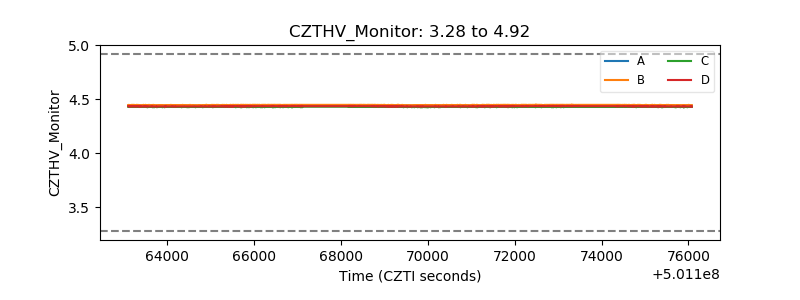 |
| D_VDD | 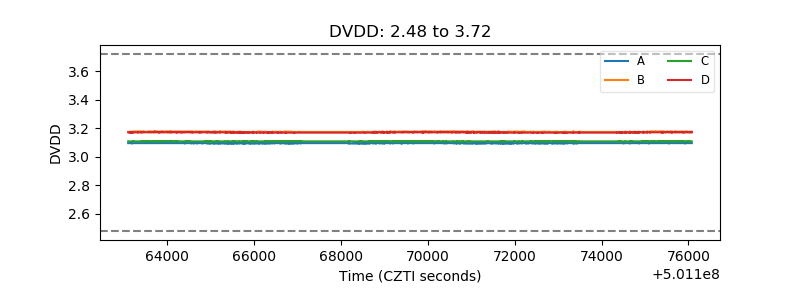 |
| Temperature 1 | 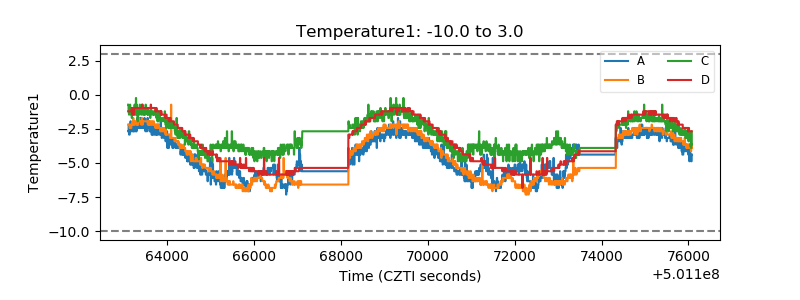 |
| Veto HV Monitor |  |
| Veto LLD | 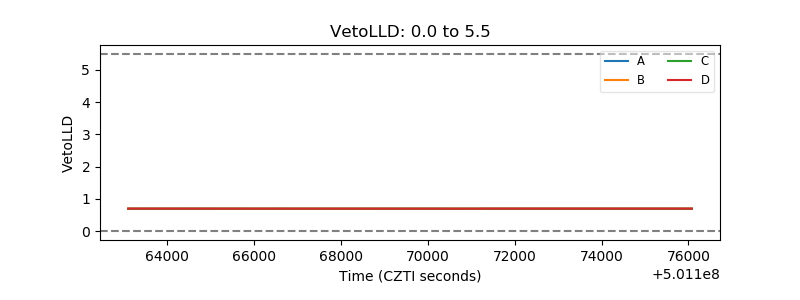 |
| Alpha Counter | 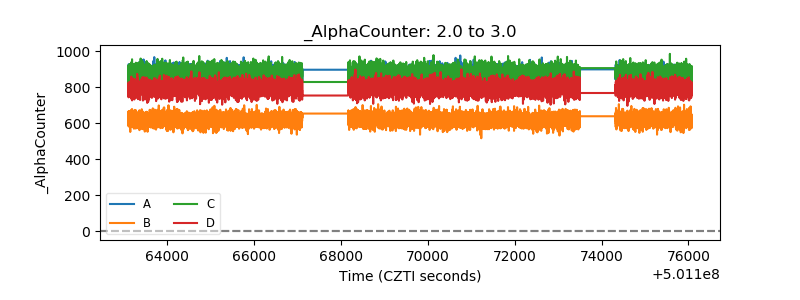 |
| _CPM_Rate | 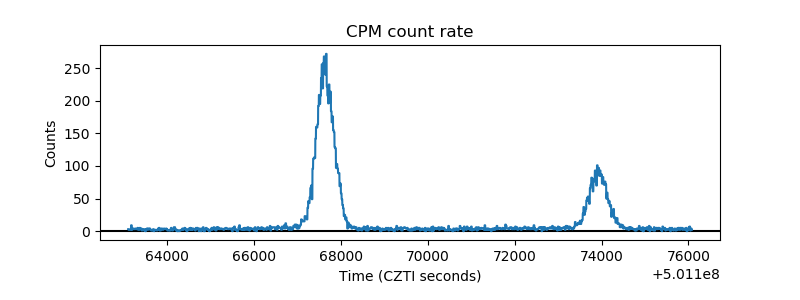 |
| CZT Counter | 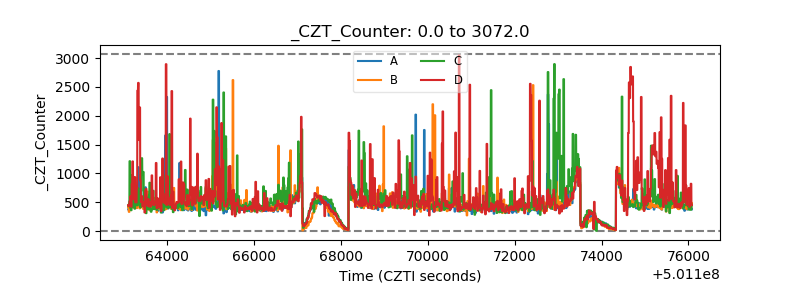 |
| +2.5 Volts monitor |  |
| +5 Volts monitor | 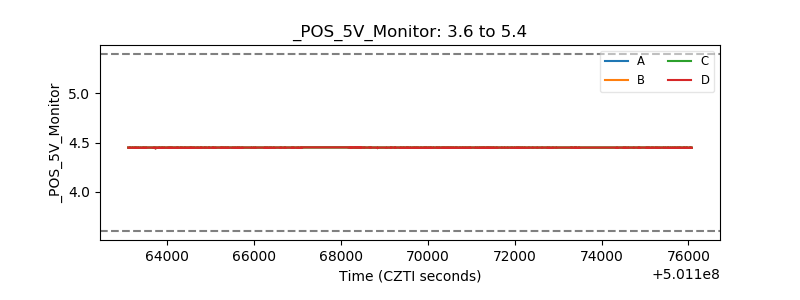 |
| _ROLL_ROT | 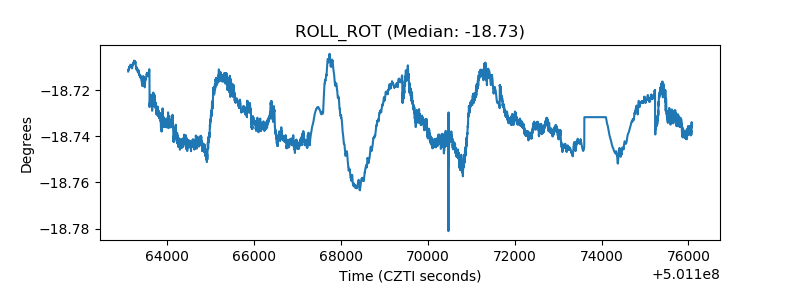 |
| _Roll_DEC | 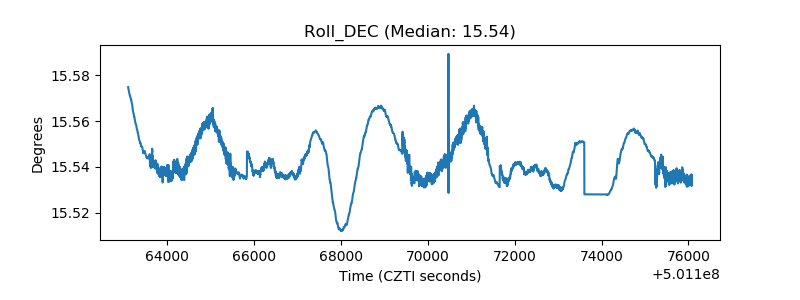 |
| _Roll_RA | 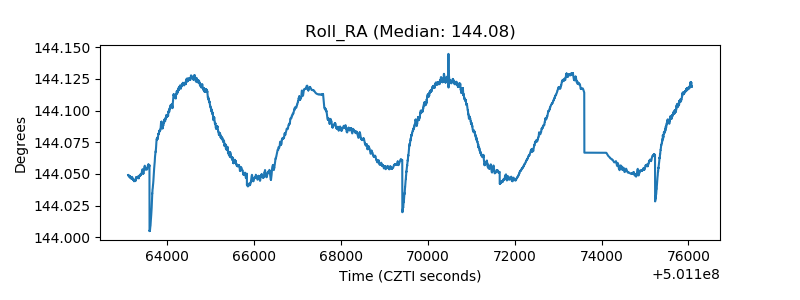 |
| Veto Counter | 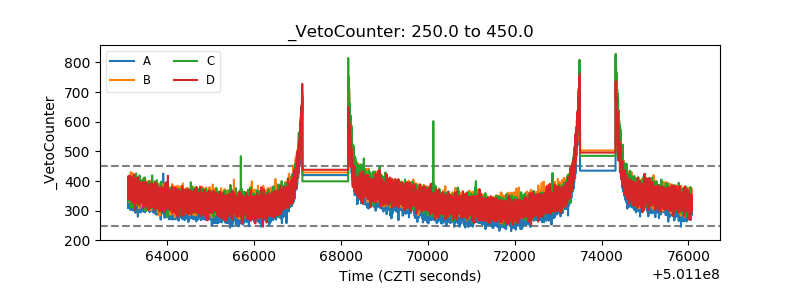 |