| Param | Original file | Final file |
|---|---|---|
| Filename | modeM0/AS1A14_039T06_9000006526_54868cztM0_level2.fits | modeM0/AS1A14_039T06_9000006526_54868cztM0_level2_quad_clean.evt |
| Size (bytes) | 498,798,720 | 103,933,440 |
| Size | 475.7 MB | 99.1 MB |
| Events in quadrant A | 3,386,411 | 689,643 |
| Events in quadrant B | 3,509,071 | 733,166 |
| Events in quadrant C | 4,160,423 | 650,851 |
| Events in quadrant D | 6,841,768 | 566,062 |
| Mode M9 | |||
|---|---|---|---|
| Quadrant | BADHDUFLAG | Total packets | Discarded packets |
| A | 0 | 6 | 0 |
| B | 0 | 6 | 0 |
| C | 0 | 7 | 0 |
| D | 0 | 7 | 0 |
| Mode M0 | |||
|---|---|---|---|
| Quadrant | BADHDUFLAG | Total packets | Discarded packets |
| A | 0 | 15547 | 2 |
| B | 0 | 15758 | 12 |
| C | 0 | 17633 | 2 |
| D | 0 | 25489 | 2 |
| Mode SS | |||
|---|---|---|---|
| Quadrant | BADHDUFLAG | Total packets | Discarded packets |
| A | 0 | 148 | 0 |
| B | 0 | 148 | 0 |
| C | 0 | 148 | 0 |
| D | 0 | 148 | 0 |
| Quadrant | Total seconds | Saturated seconds | Saturation percentage |
|---|---|---|---|
| A | 7287 | 149 | 2.044737% |
| B | 7284 | 199 | 2.732015% |
| C | 7286 | 192 | 2.635191% |
| D | 7286 | 823 | 11.295635% |
Noise dominated data is calculated using 1-second bins in cleaned event files. If a bin has >2000 counts, and if more than 50% of those come from <1% of pixels, then it is considered to be noise-dominated and hence unusable.
| Quadrant | # 1 sec bins | Bins with >0 counts | Bins with >2000 counts | High rate bins dominated by noise | Noise dominated (total time) | Noise dominated (detector-on time) | Marked lightcurve |
|---|---|---|---|---|---|---|---|
| A | 7777 | 7288 | 22 | 22 | 0.28% | 0.30% | 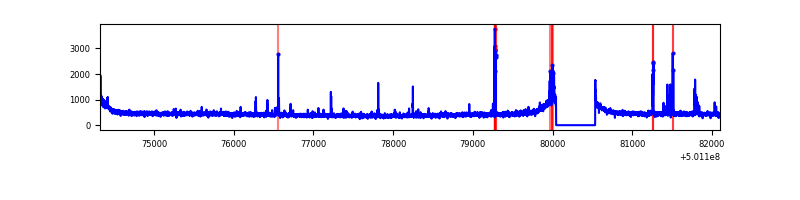 |
| B | 7776 | 7286 | 16 | 16 | 0.21% | 0.22% | 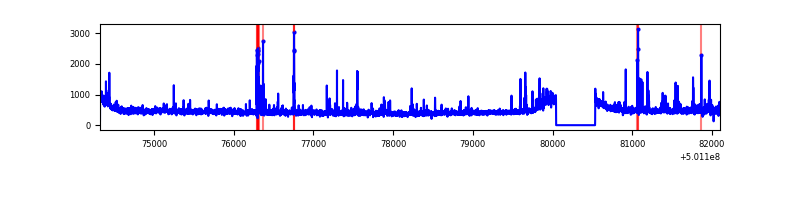 |
| C | 7776 | 7287 | 72 | 72 | 0.93% | 0.99% | 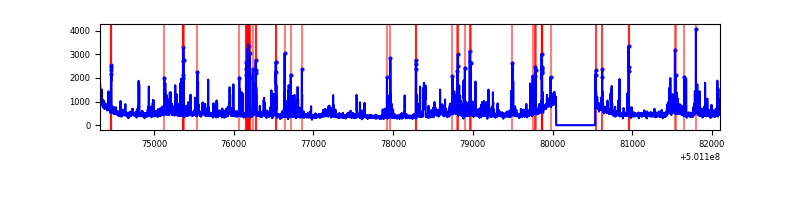 |
| D | 7776 | 7287 | 791 | 791 | 10.17% | 10.85% | 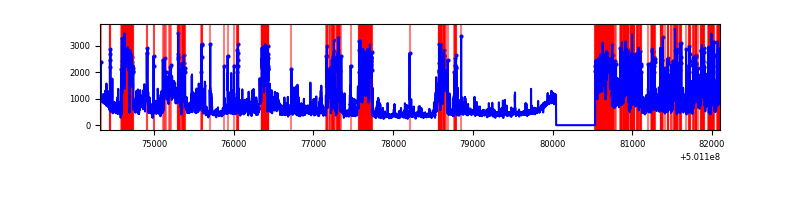 |
Top three noisy pixels from each quadrant. If the there are fewer than three noisy pixels in the level2.evt file, extra rows are filled as -1
| Pixel properties | Quadrant properties | ||||||
|---|---|---|---|---|---|---|---|
| Quadrant | DetID | PixID | Counts | Sigma | Mean | Median | Sigma |
| A | 0 | 8 | 117236 | 579.52 | 815 | 795 | 200.9 |
| A | 11 | 3 | 35063 | 170.55 | 815 | 795 | 200.9 |
| A | 3 | 14 | 31467 | 152.65 | 815 | 795 | 200.9 |
| B | 5 | 185 | 101515 | 579.66 | 802 | 772 | 173.8 |
| B | 12 | 6 | 85729 | 488.83 | 802 | 772 | 173.8 |
| B | 10 | 247 | 60845 | 345.65 | 802 | 772 | 173.8 |
| C | 12 | 252 | 372996 | 1709.85 | 795 | 786 | 217.7 |
| C | 14 | 254 | 211559 | 968.25 | 795 | 786 | 217.7 |
| C | 4 | 5 | 196238 | 897.86 | 795 | 786 | 217.7 |
| D | 11 | 176 | 2133386 | 9807.95 | 766 | 733 | 217.4 |
| D | 9 | 19 | 487450 | 2238.38 | 766 | 733 | 217.4 |
| D | 11 | 129 | 401894 | 1844.92 | 766 | 733 | 217.4 |
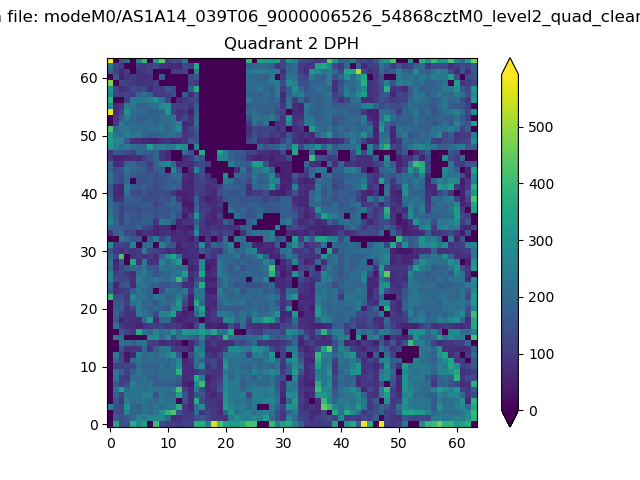
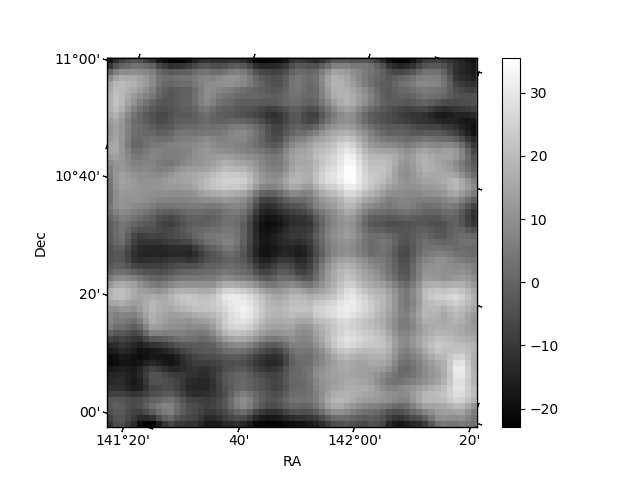
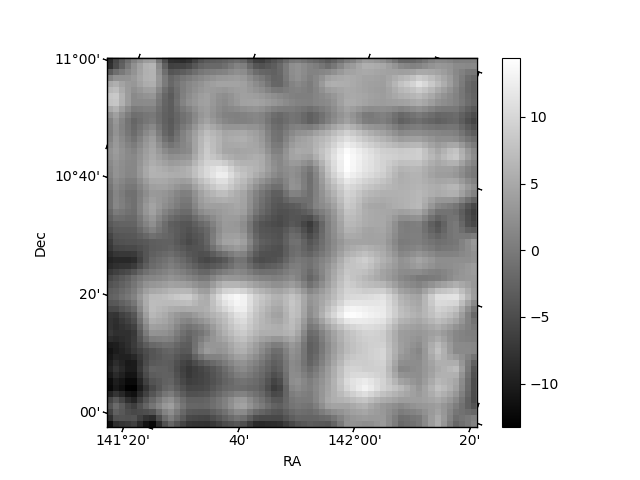
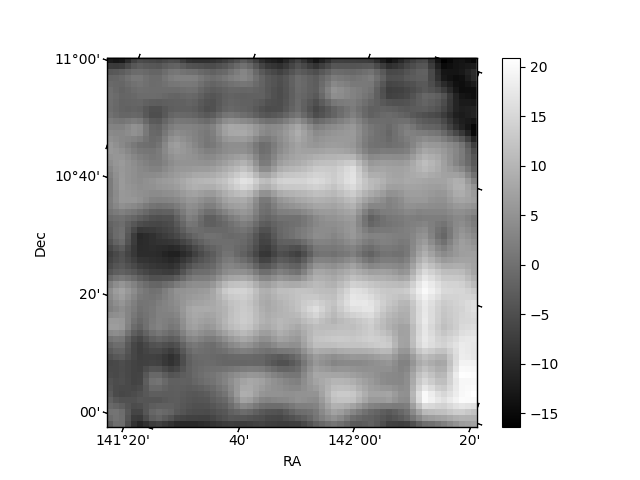
Histogram calculated using DETX and DETY for each event in the final _common_clean file
| Quadrant A | 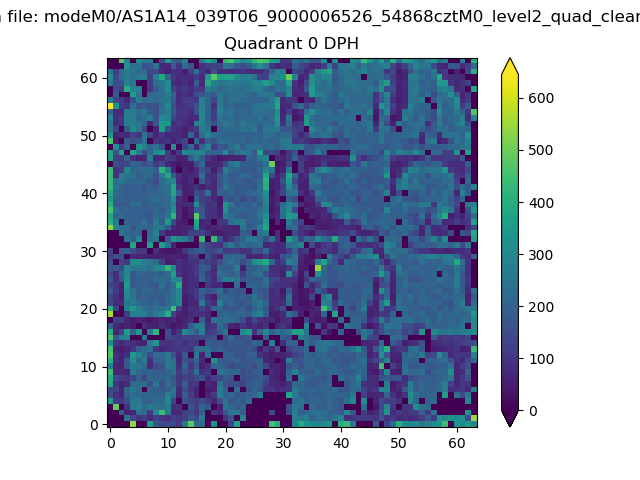 |
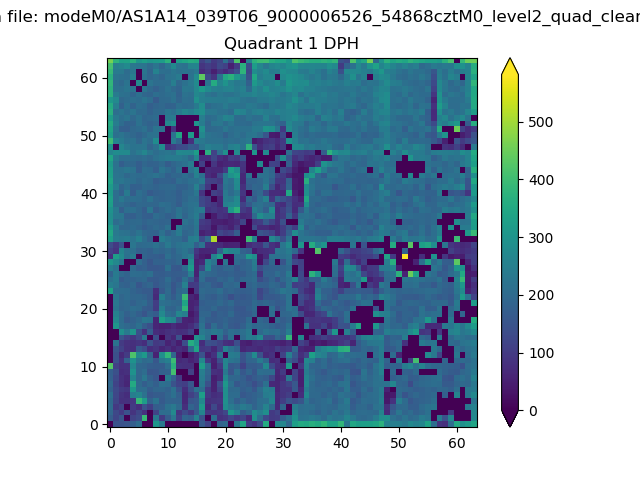 |
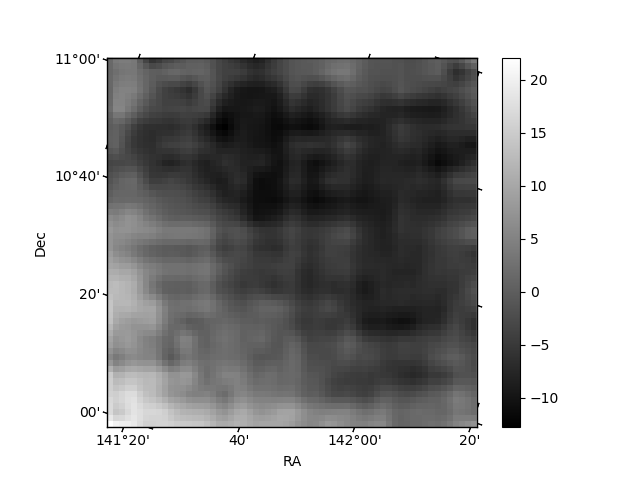
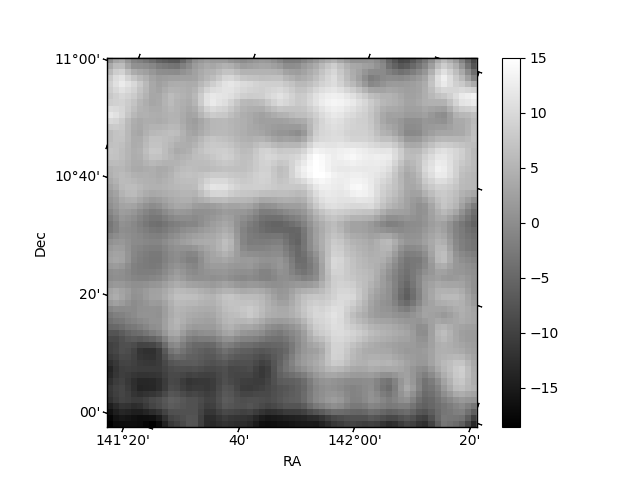
Quadrant B |
|---|---|---|---|
| Quadrant D | 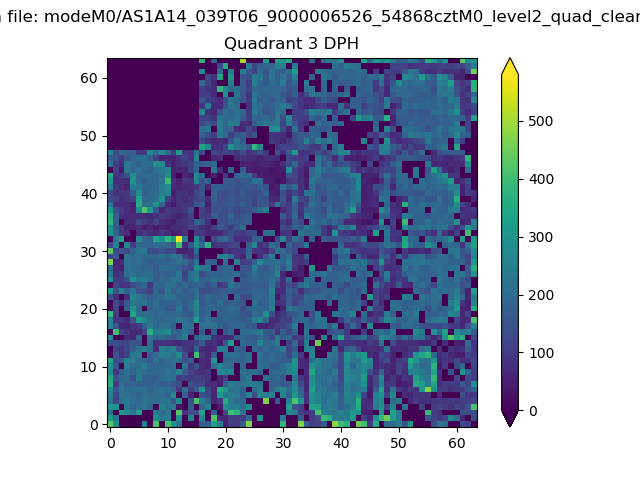 |
 |
Quadrant C |
| Plot type | Count rate plots | Images |
|---|---|---|
| Comparison with Poisson distribution Blue bars denote a histogram of data divided into 1 sec bins. Red curve is a Poisson curve with rate = median count rate of data. |
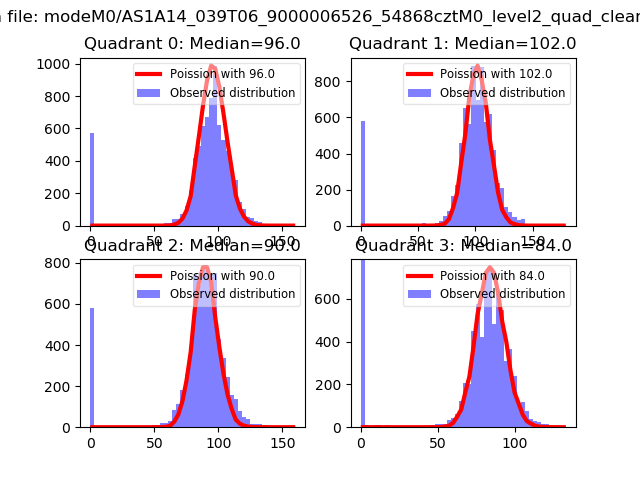 |
 |
| Quadrant-wise count rates Data is divided into 100 sec bins |
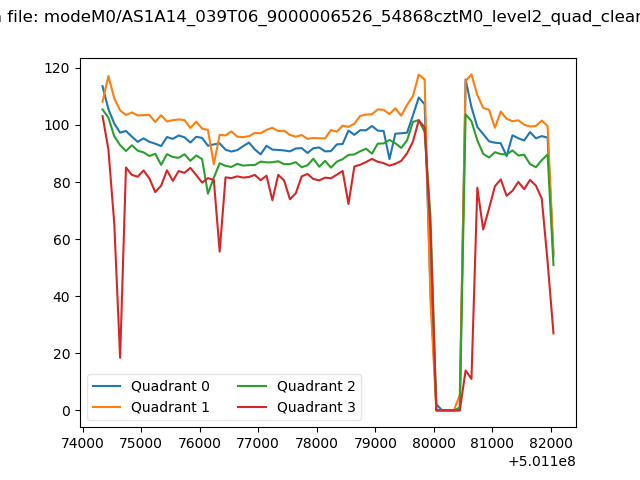 |
|
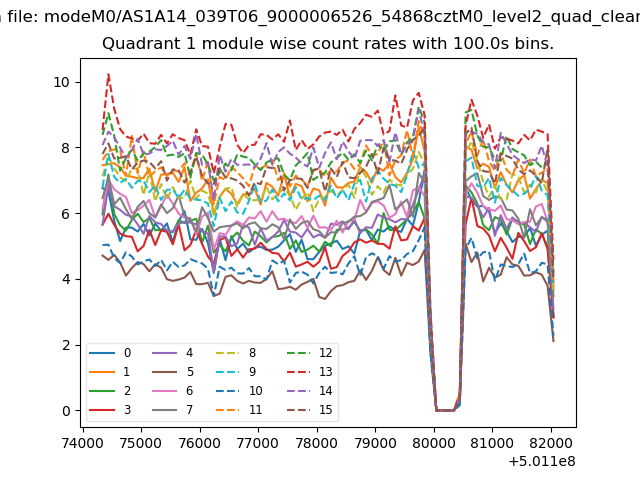
| Module-wise count rates for Quadrant A Data is divided into 100 sec bins |
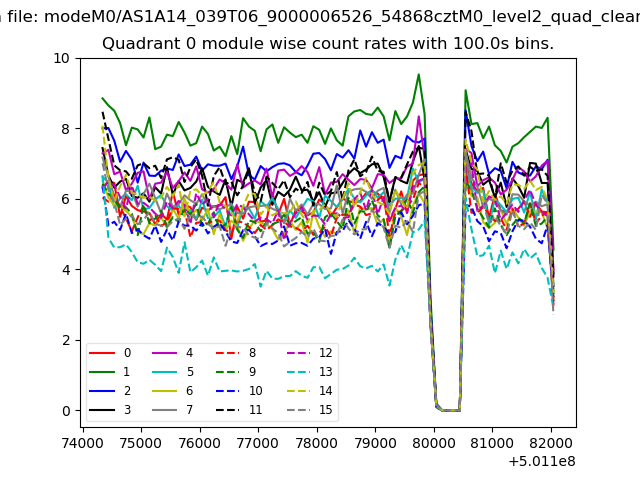 |
 |
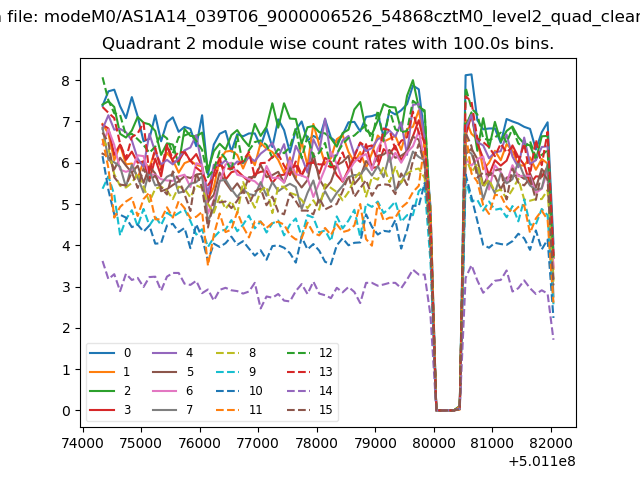
| Module-wise count rates for Quadrant B Data is divided into 100 sec bins |
 |
 |
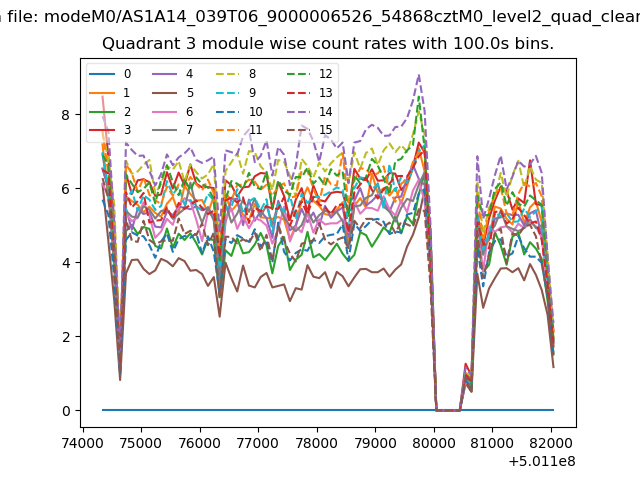
| Module-wise count rates for Quadrant C Data is divided into 100 sec bins |
 |
 |
| Module-wise count rates for Quadrant D Data is divided into 100 sec bins |
 |
 |
| Parameter | Plot |
|---|---|
| CZT HV Monitor | 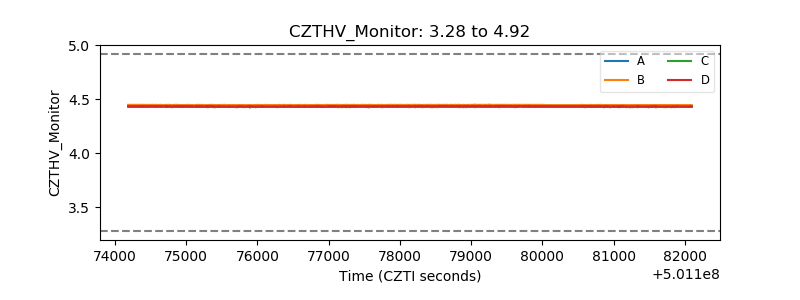 |
| D_VDD | 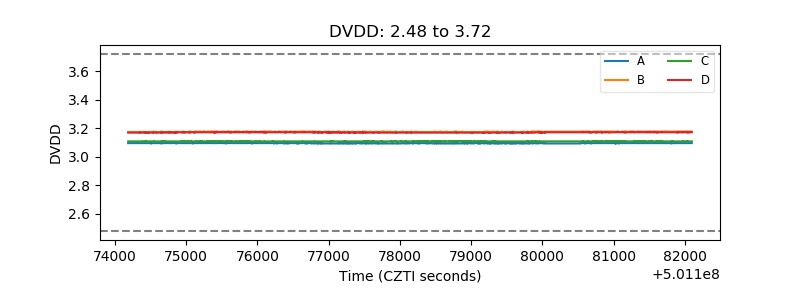 |
| Temperature 1 | 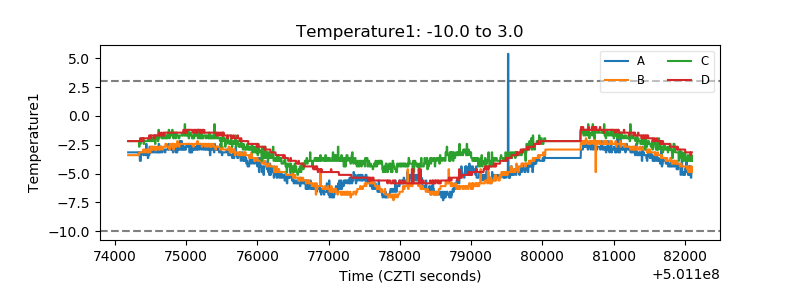 |
| Veto HV Monitor | 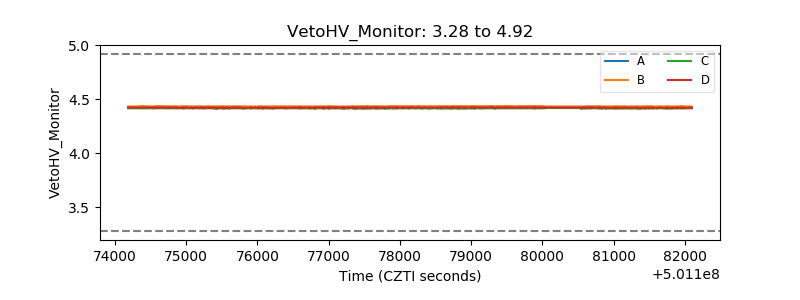 |
| Veto LLD | 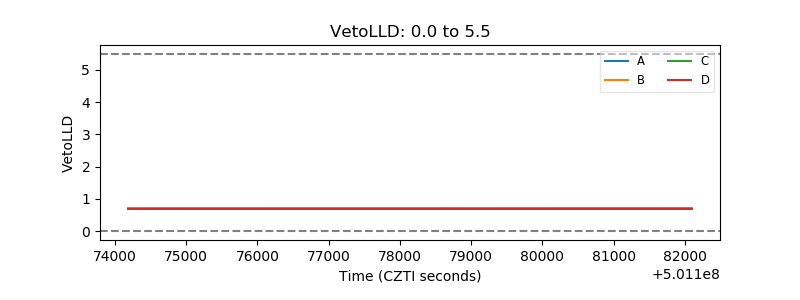 |
| Alpha Counter | 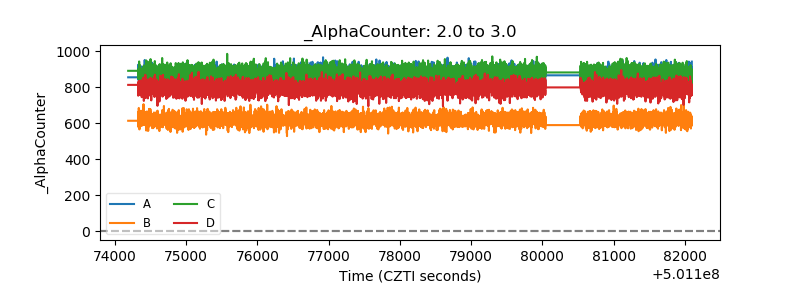 |
| _CPM_Rate | 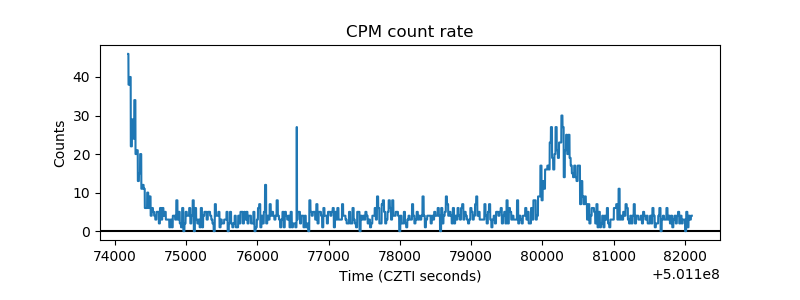 |
| CZT Counter | 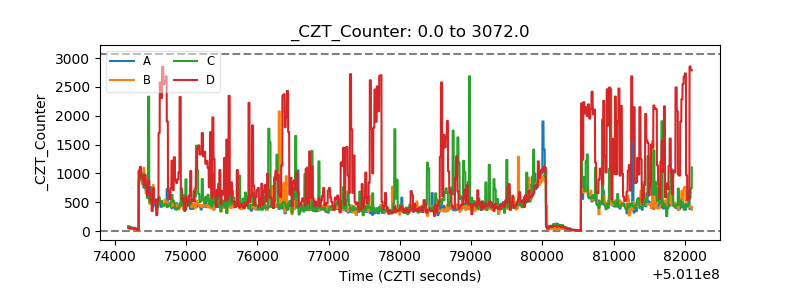 |
| +2.5 Volts monitor |  |
| +5 Volts monitor | 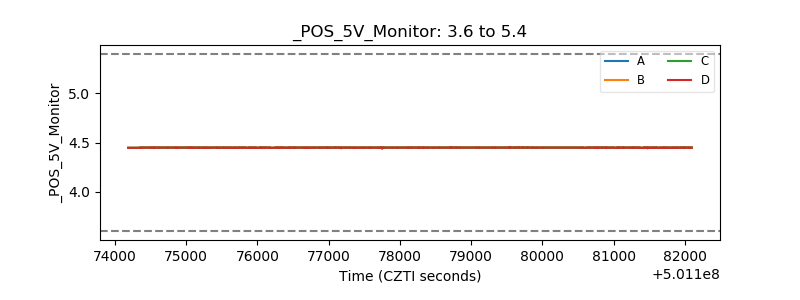 |
| _ROLL_ROT | 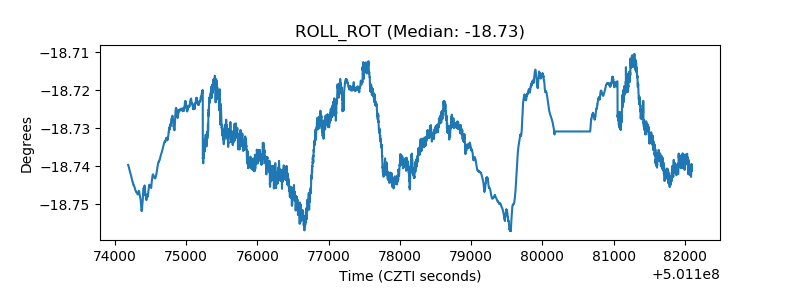 |
| _Roll_DEC | 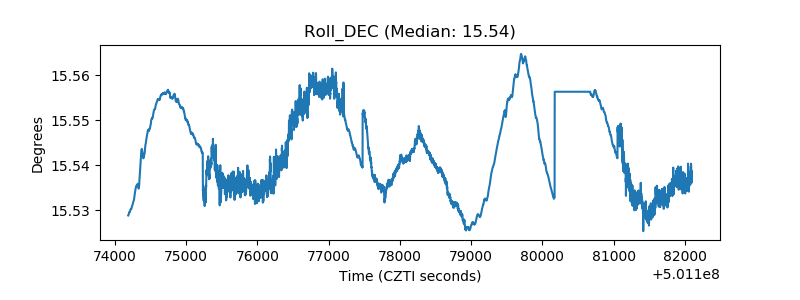 |
| _Roll_RA | 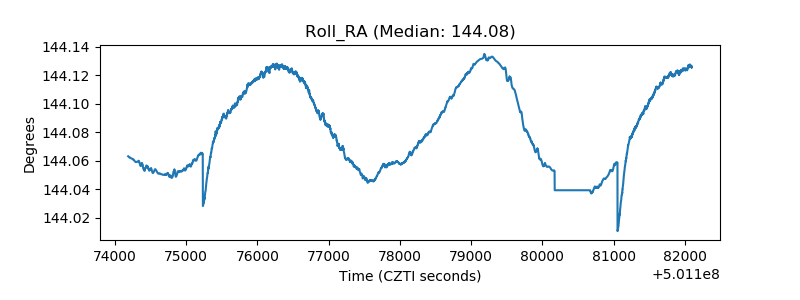 |
| Veto Counter | 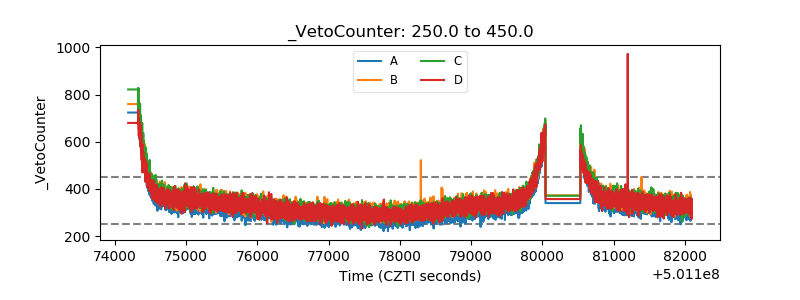 |