| Param | Original file | Final file |
|---|---|---|
| Filename | modeM0/AS1A14_039T06_9000006526_54869cztM0_level2.fits | modeM0/AS1A14_039T06_9000006526_54869cztM0_level2_quad_clean.evt |
| Size (bytes) | 585,368,640 | 107,887,680 |
| Size | 558.3 MB | 102.9 MB |
| Events in quadrant A | 3,482,767 | 734,691 |
| Events in quadrant B | 6,042,754 | 689,629 |
| Events in quadrant C | 4,663,764 | 689,996 |
| Events in quadrant D | 6,878,978 | 614,427 |
| Mode M0 | |||
|---|---|---|---|
| Quadrant | BADHDUFLAG | Total packets | Discarded packets |
| A | 0 | 16232 | 5 |
| B | 0 | 23473 | 21 |
| C | 0 | 19462 | 0 |
| D | 0 | 25842 | 15 |
| Mode SS | |||
|---|---|---|---|
| Quadrant | BADHDUFLAG | Total packets | Discarded packets |
| A | 0 | 156 | 0 |
| B | 0 | 156 | 0 |
| C | 0 | 155 | 1 |
| D | 0 | 156 | 0 |
| Quadrant | Total seconds | Saturated seconds | Saturation percentage |
|---|---|---|---|
| A | 7730 | 31 | 0.401035% |
| B | 7730 | 1091 | 14.113842% |
| C | 7735 | 146 | 1.887524% |
| D | 7731 | 680 | 8.795757% |
Noise dominated data is calculated using 1-second bins in cleaned event files. If a bin has >2000 counts, and if more than 50% of those come from <1% of pixels, then it is considered to be noise-dominated and hence unusable.
| Quadrant | # 1 sec bins | Bins with >0 counts | Bins with >2000 counts | High rate bins dominated by noise | Noise dominated (total time) | Noise dominated (detector-on time) | Marked lightcurve |
|---|---|---|---|---|---|---|---|
| A | 7734 | 7733 | 15 | 15 | 0.19% | 0.19% | 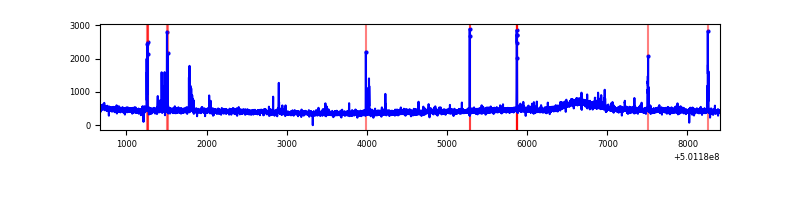 |
| B | 7734 | 7732 | 602 | 602 | 7.78% | 7.79% | 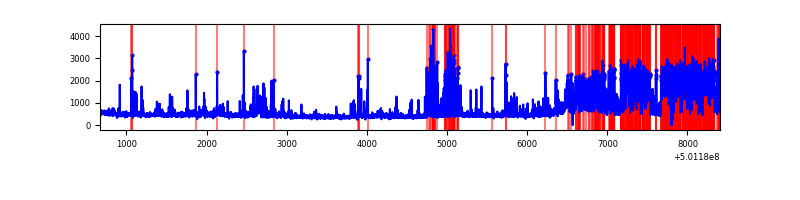 |
| C | 7735 | 7735 | 115 | 115 | 1.49% | 1.49% | 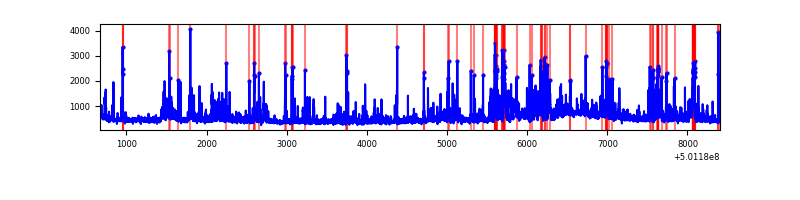 |
| D | 7735 | 7734 | 611 | 611 | 7.90% | 7.90% | 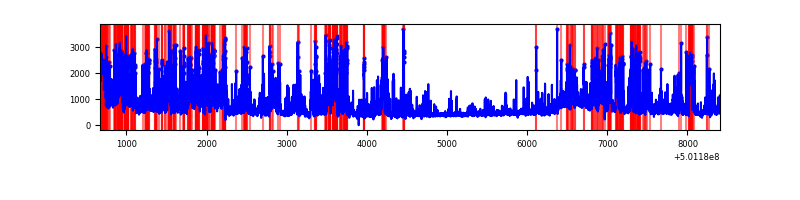 |
Top three noisy pixels from each quadrant. If the there are fewer than three noisy pixels in the level2.evt file, extra rows are filled as -1
| Pixel properties | Quadrant properties | ||||||
|---|---|---|---|---|---|---|---|
| Quadrant | DetID | PixID | Counts | Sigma | Mean | Median | Sigma |
| A | 0 | 8 | 96166 | 455.38 | 847 | 824 | 209.4 |
| A | 3 | 14 | 30495 | 141.72 | 847 | 824 | 209.4 |
| A | 5 | 241 | 27279 | 126.36 | 847 | 824 | 209.4 |
| B | 10 | 247 | 2137250 | 12500.61 | 798 | 769 | 170.9 |
| B | 1 | 239 | 442524 | 2584.72 | 798 | 769 | 170.9 |
| B | 5 | 185 | 176153 | 1026.18 | 798 | 769 | 170.9 |
| C | 12 | 252 | 584075 | 2624.17 | 818 | 809 | 222.3 |
| C | 6 | 223 | 310888 | 1395.08 | 818 | 809 | 222.3 |
| C | 14 | 254 | 212813 | 953.83 | 818 | 809 | 222.3 |
| D | 11 | 176 | 2259707 | 9936.33 | 799 | 765 | 227.3 |
| D | 14 | 52 | 286228 | 1255.66 | 799 | 765 | 227.3 |
| D | 6 | 46 | 283975 | 1245.75 | 799 | 765 | 227.3 |
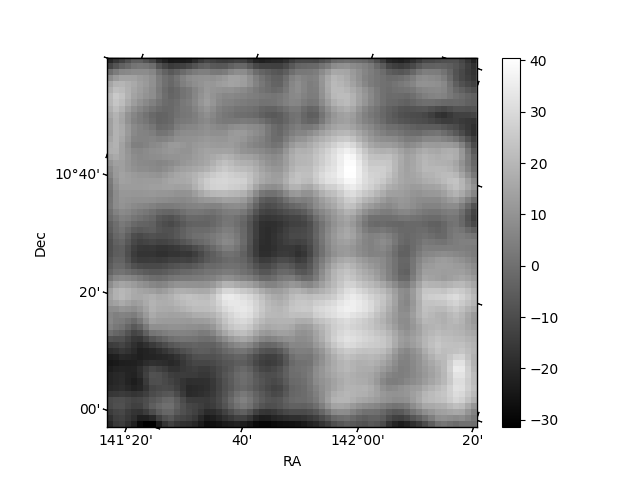
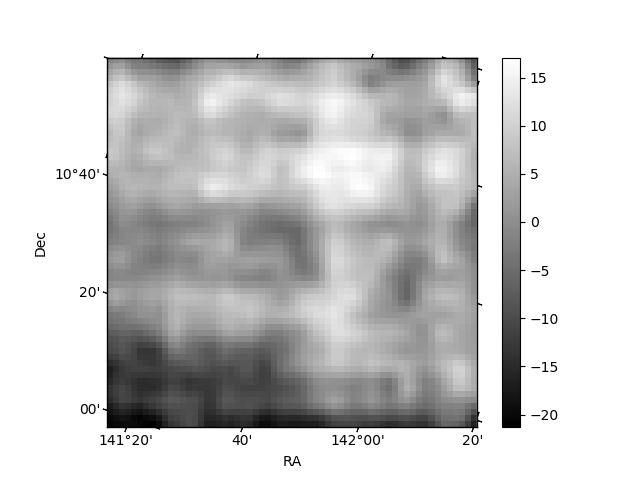
Histogram calculated using DETX and DETY for each event in the final _common_clean file
| Quadrant A | 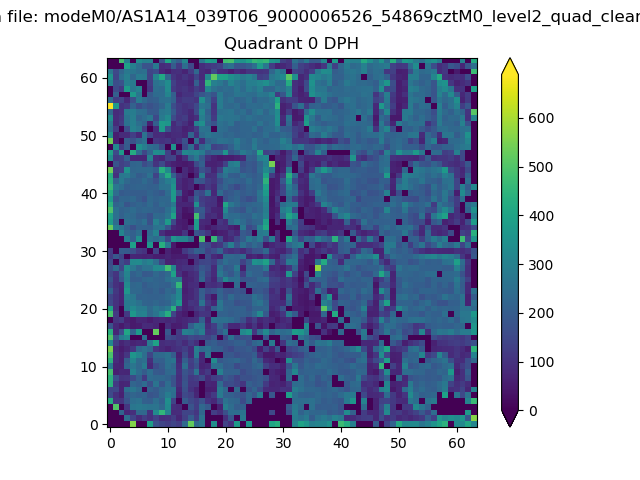 |
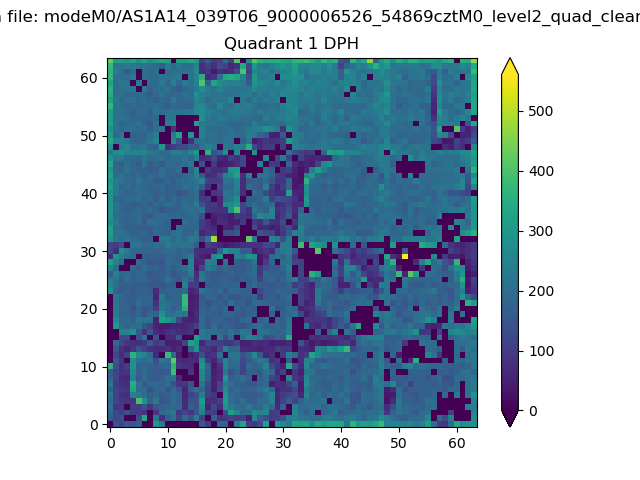 |
Quadrant B |
|---|---|---|---|
| Quadrant D | 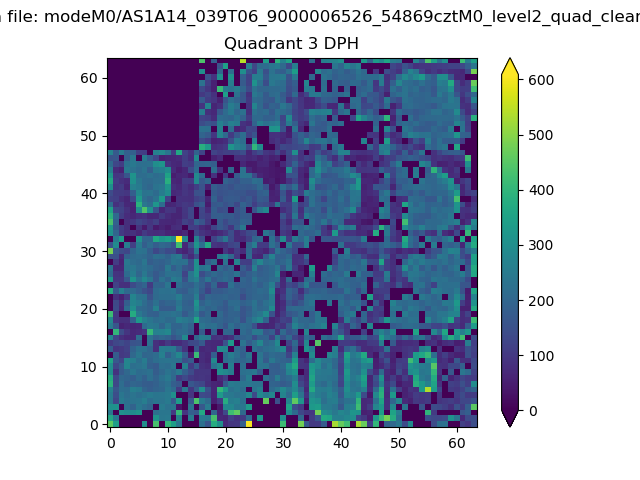 |
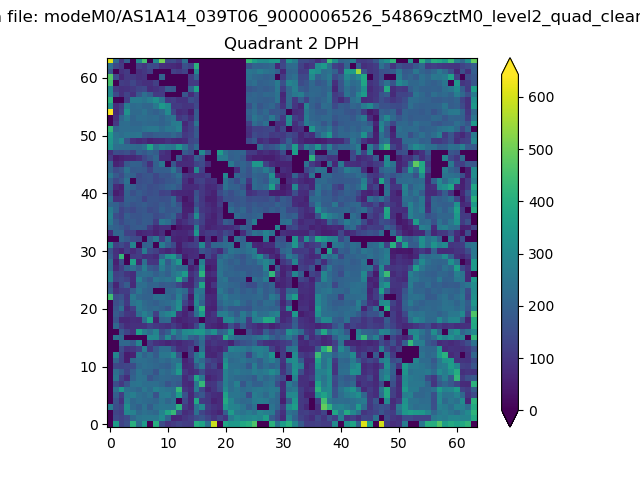 |
Quadrant C |
| Plot type | Count rate plots | Images |
|---|---|---|
| Comparison with Poisson distribution Blue bars denote a histogram of data divided into 1 sec bins. Red curve is a Poisson curve with rate = median count rate of data. |
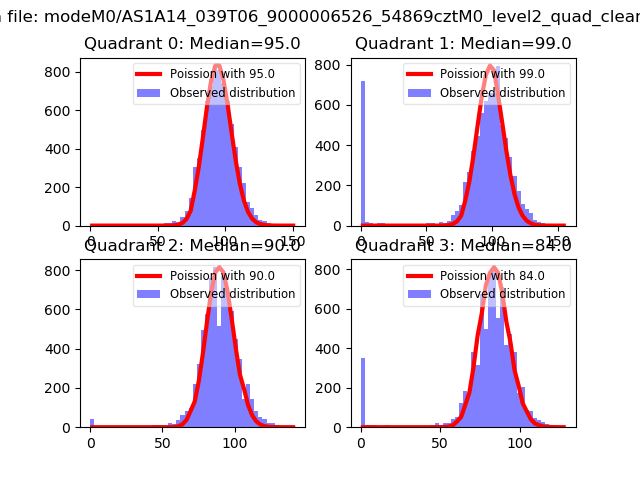 |
 |
| Quadrant-wise count rates Data is divided into 100 sec bins |
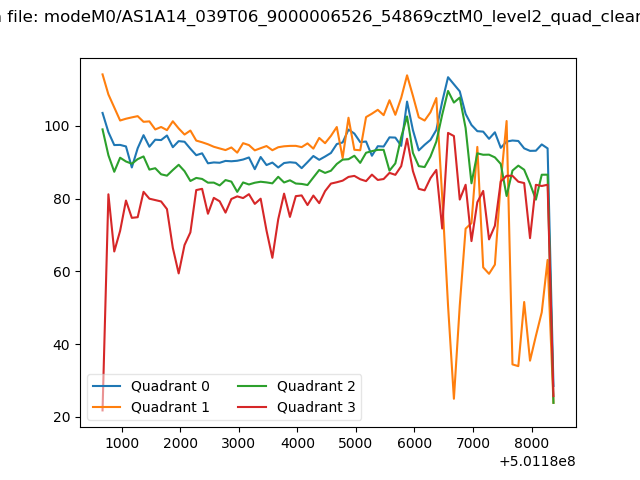 |
|
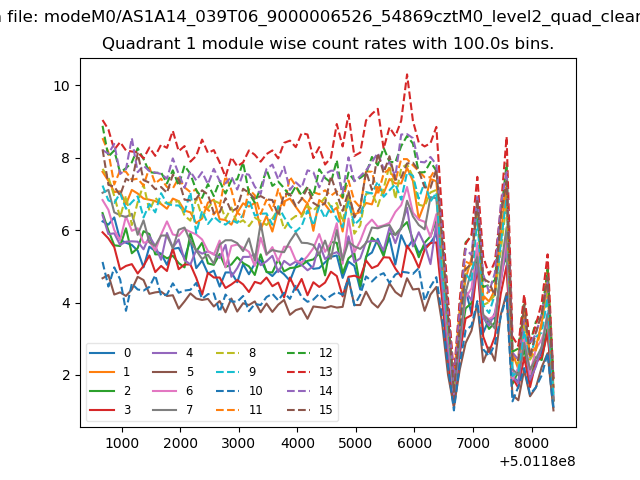
| Module-wise count rates for Quadrant A Data is divided into 100 sec bins |
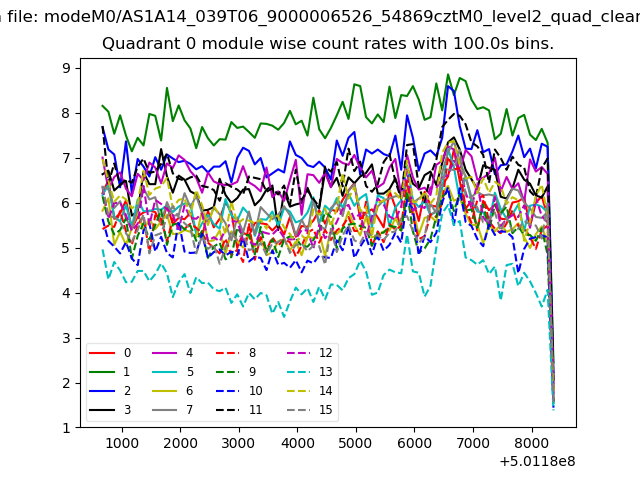 |
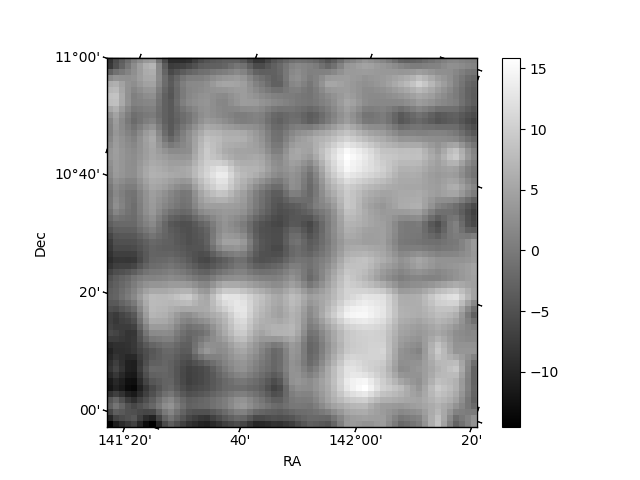 |
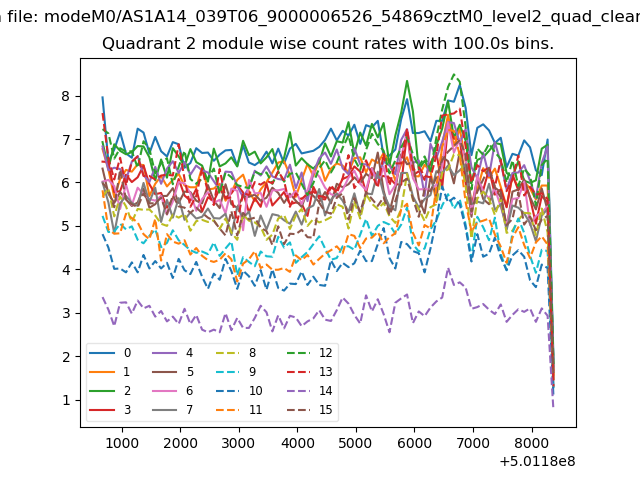
| Module-wise count rates for Quadrant B Data is divided into 100 sec bins |
 |
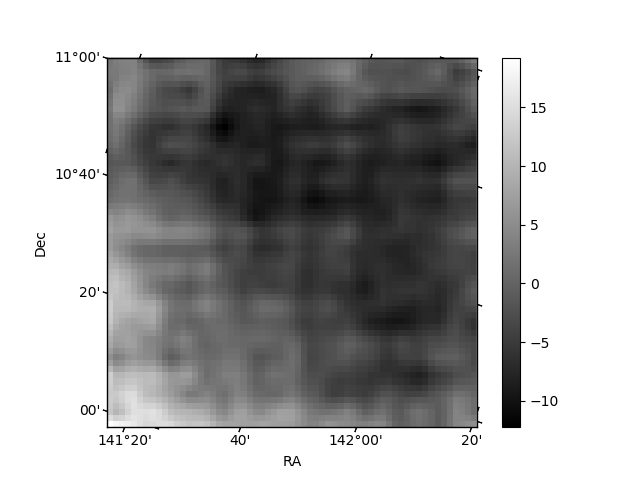 |
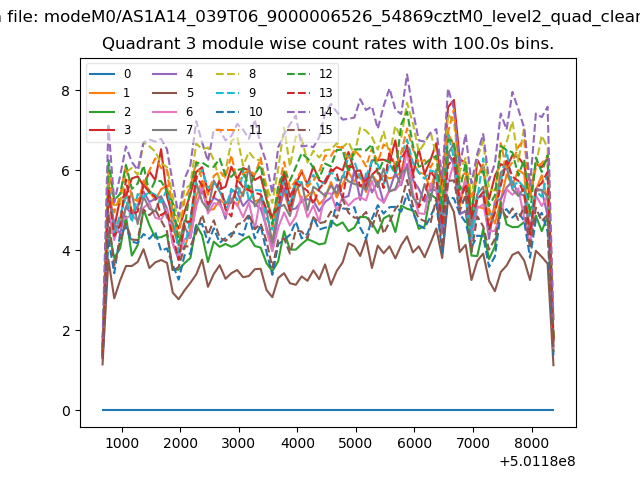
| Module-wise count rates for Quadrant C Data is divided into 100 sec bins |
 |
 |
| Module-wise count rates for Quadrant D Data is divided into 100 sec bins |
 |
 |
| Parameter | Plot |
|---|---|
| CZT HV Monitor | 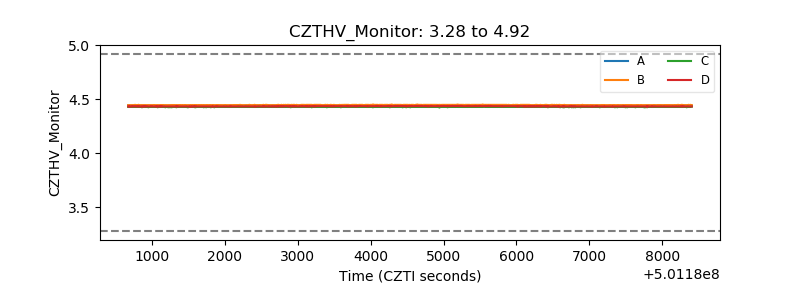 |
| D_VDD | 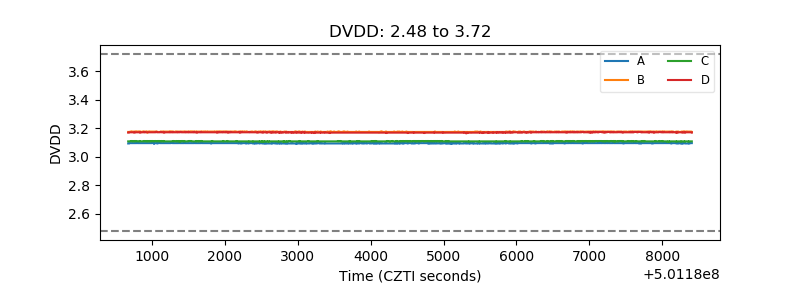 |
| Temperature 1 | 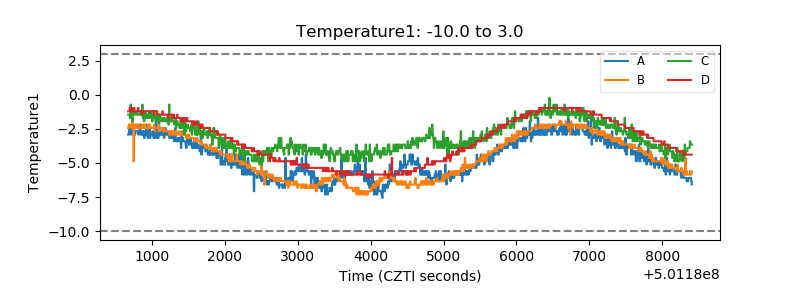 |
| Veto HV Monitor |  |
| Veto LLD | 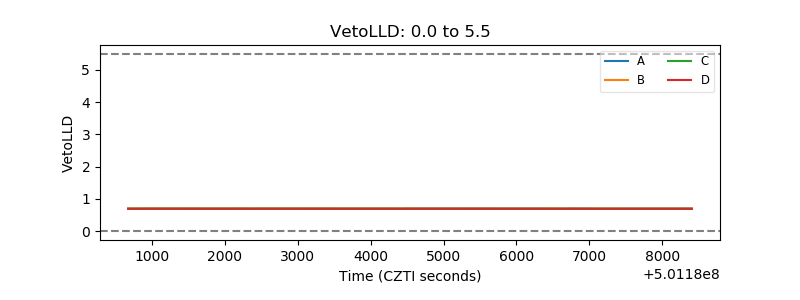 |
| Alpha Counter | 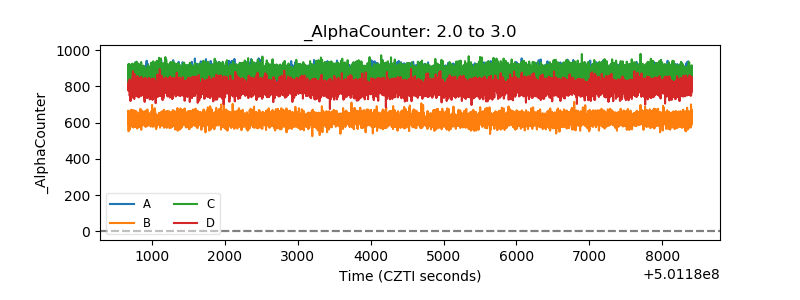 |
| _CPM_Rate | 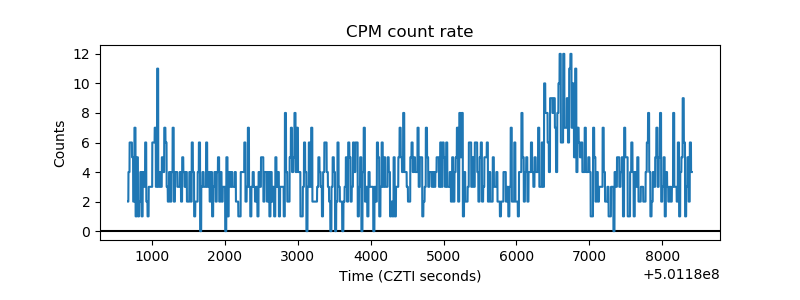 |
| CZT Counter | 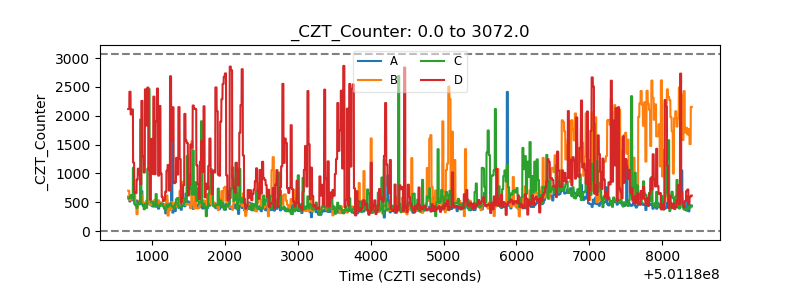 |
| +2.5 Volts monitor |  |
| +5 Volts monitor | 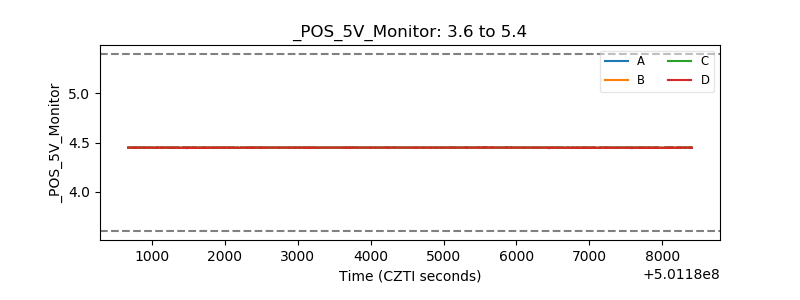 |
| _ROLL_ROT | 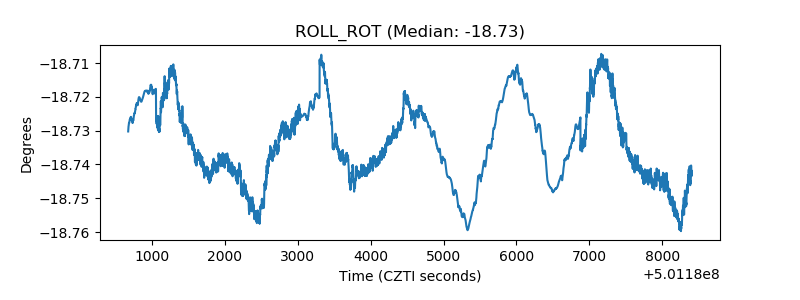 |
| _Roll_DEC | 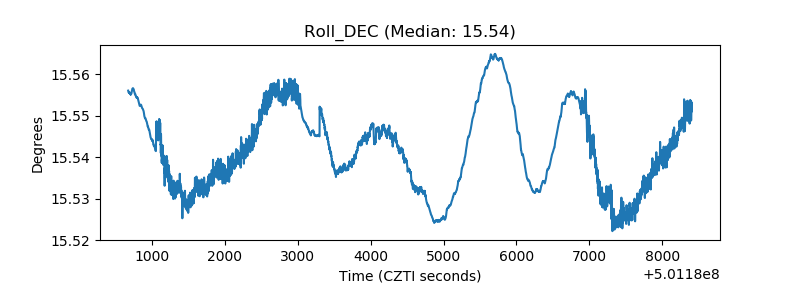 |
| _Roll_RA | 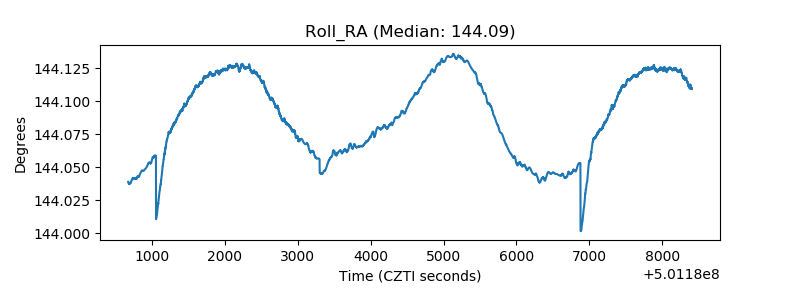 |
| Veto Counter | 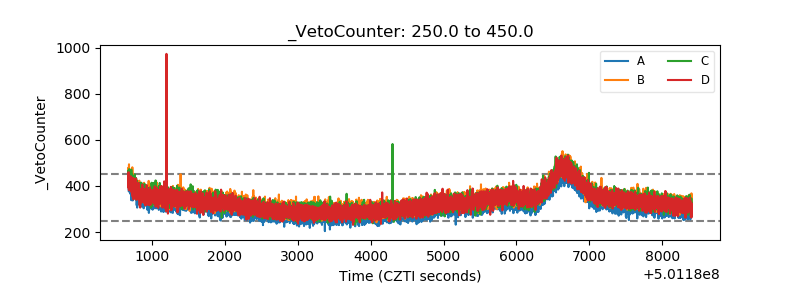 |