| Param | Original file | Final file |
|---|---|---|
| Filename | modeM0/AS1A14_039T06_9000006526_54870cztM0_level2.fits | modeM0/AS1A14_039T06_9000006526_54870cztM0_level2_quad_clean.evt |
| Size (bytes) | 624,902,400 | 106,263,360 |
| Size | 596.0 MB | 101.3 MB |
| Events in quadrant A | 4,019,545 | 723,269 |
| Events in quadrant B | 8,213,899 | 639,747 |
| Events in quadrant C | 4,536,879 | 683,022 |
| Events in quadrant D | 5,760,444 | 632,940 |
| Mode M0 | |||
|---|---|---|---|
| Quadrant | BADHDUFLAG | Total packets | Discarded packets |
| A | 0 | 17696 | 0 |
| B | 0 | 29918 | 7 |
| C | 0 | 18946 | 0 |
| D | 0 | 22543 | 0 |
| Mode SS | |||
|---|---|---|---|
| Quadrant | BADHDUFLAG | Total packets | Discarded packets |
| A | 0 | 154 | 0 |
| B | 0 | 154 | 0 |
| C | 0 | 154 | 0 |
| D | 0 | 154 | 0 |
| Quadrant | Total seconds | Saturated seconds | Saturation percentage |
|---|---|---|---|
| A | 7743 | 161 | 2.079297% |
| B | 7742 | 1752 | 22.629811% |
| C | 7744 | 155 | 2.001550% |
| D | 7744 | 410 | 5.294421% |
Noise dominated data is calculated using 1-second bins in cleaned event files. If a bin has >2000 counts, and if more than 50% of those come from <1% of pixels, then it is considered to be noise-dominated and hence unusable.
| Quadrant | # 1 sec bins | Bins with >0 counts | Bins with >2000 counts | High rate bins dominated by noise | Noise dominated (total time) | Noise dominated (detector-on time) | Marked lightcurve |
|---|---|---|---|---|---|---|---|
| A | 7743 | 7743 | 145 | 145 | 1.87% | 1.87% | 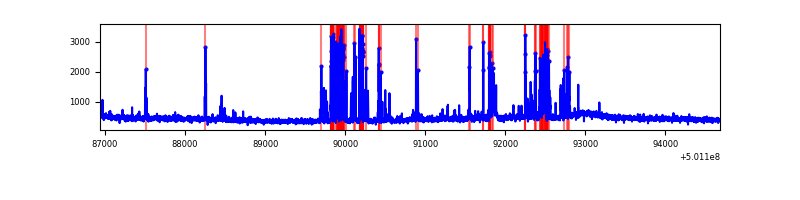 |
| B | 7744 | 7743 | 1075 | 1075 | 13.88% | 13.88% | 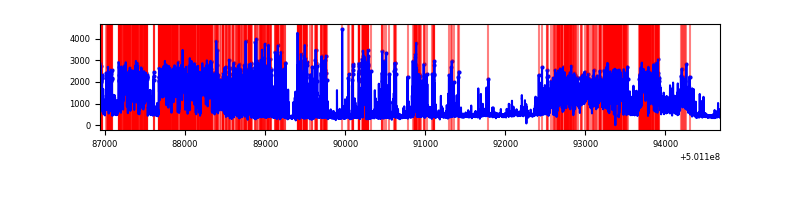 |
| C | 7744 | 7744 | 123 | 123 | 1.59% | 1.59% | 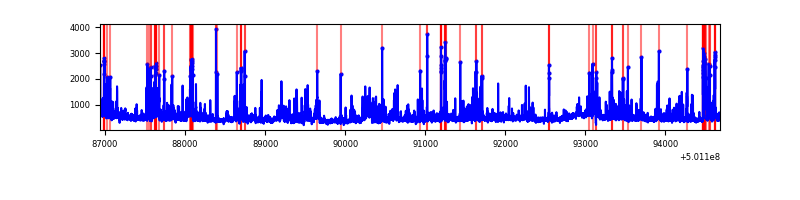 |
| D | 7744 | 7744 | 376 | 376 | 4.86% | 4.86% | 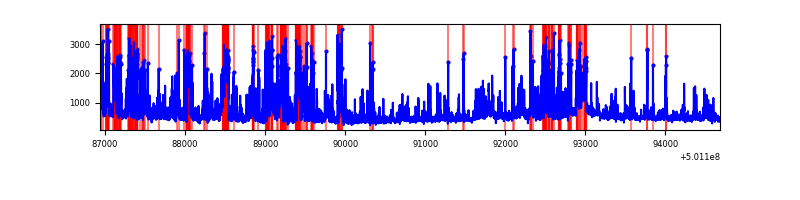 |
Top three noisy pixels from each quadrant. If the there are fewer than three noisy pixels in the level2.evt file, extra rows are filled as -1
| Pixel properties | Quadrant properties | ||||||
|---|---|---|---|---|---|---|---|
| Quadrant | DetID | PixID | Counts | Sigma | Mean | Median | Sigma |
| A | 0 | 8 | 753034 | 3662.84 | 829 | 807 | 205.4 |
| A | 5 | 241 | 19331 | 90.2 | 829 | 807 | 205.4 |
| A | 13 | 254 | 15503 | 71.56 | 829 | 807 | 205.4 |
| B | 10 | 247 | 3483529 | 20915.44 | 767 | 738 | 166.5 |
| B | 1 | 239 | 1323235 | 7942.08 | 767 | 738 | 166.5 |
| B | 5 | 185 | 142953 | 854.05 | 767 | 738 | 166.5 |
| C | 12 | 252 | 552298 | 2516.67 | 802 | 792 | 219.1 |
| C | 6 | 223 | 182723 | 830.2 | 802 | 792 | 219.1 |
| C | 14 | 254 | 181467 | 824.47 | 802 | 792 | 219.1 |
| D | 11 | 176 | 1149512 | 5098.22 | 793 | 761 | 225.3 |
| D | 11 | 129 | 465391 | 2062.05 | 793 | 761 | 225.3 |
| D | 6 | 46 | 372543 | 1649.99 | 793 | 761 | 225.3 |
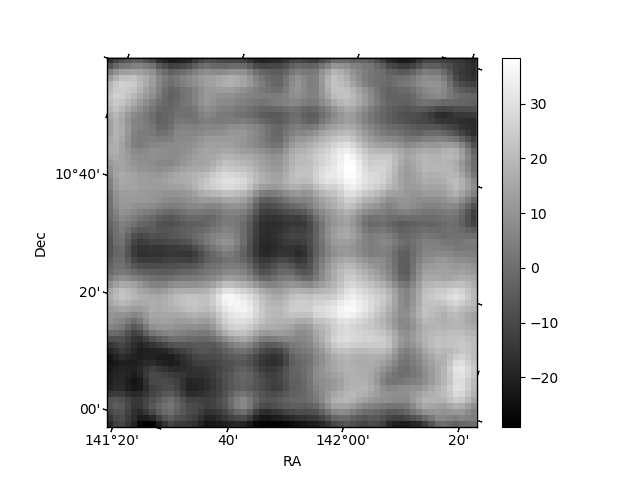
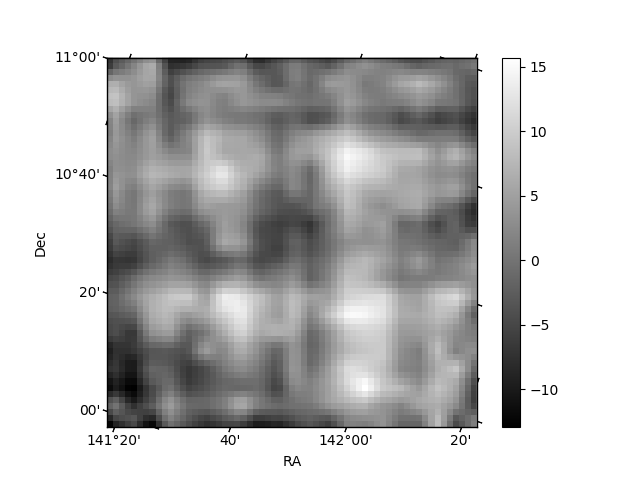
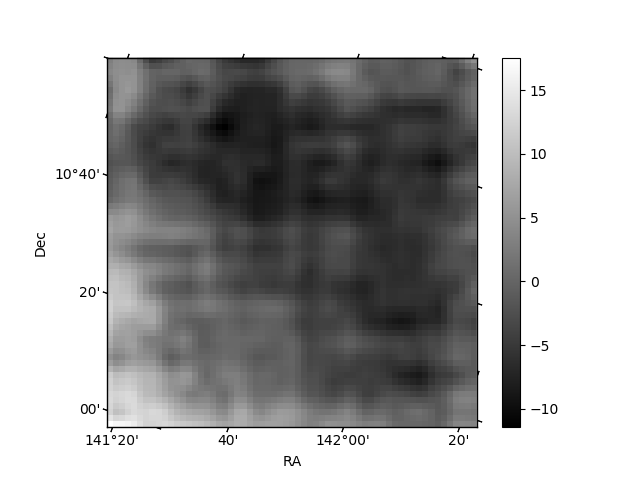
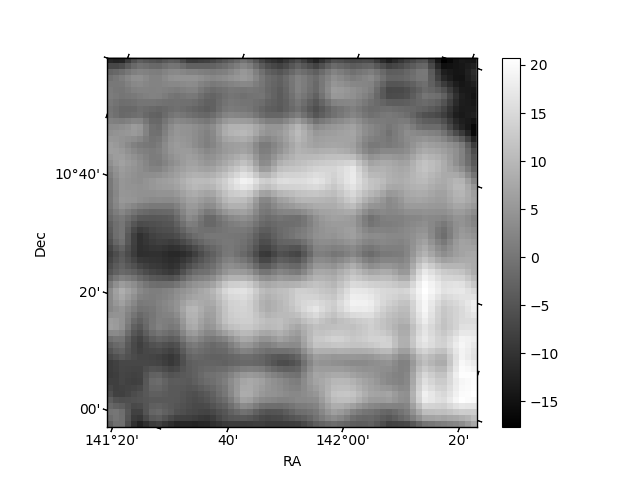
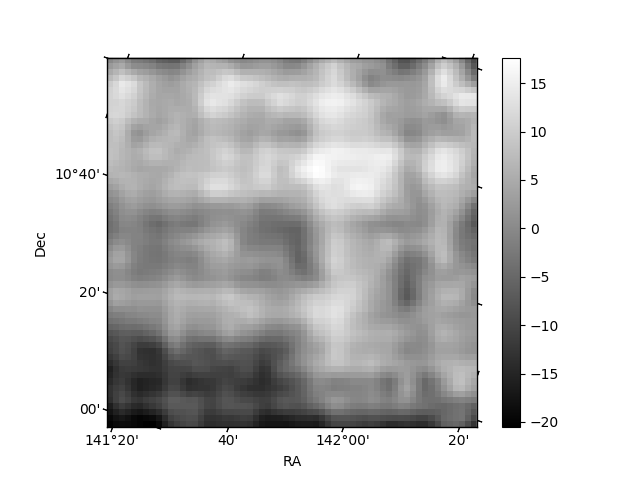
Histogram calculated using DETX and DETY for each event in the final _common_clean file
| Quadrant A | 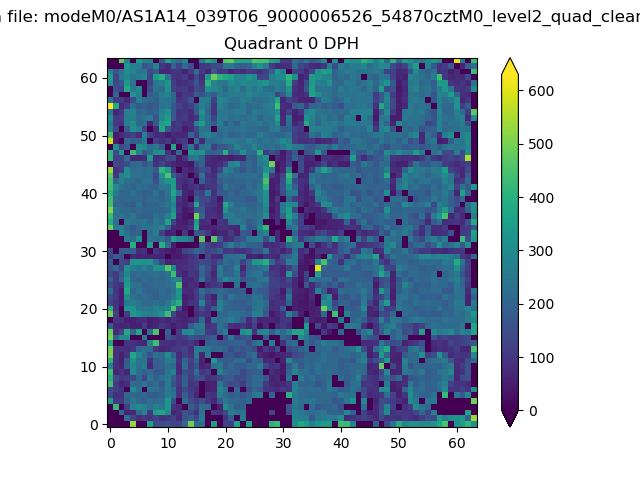 |
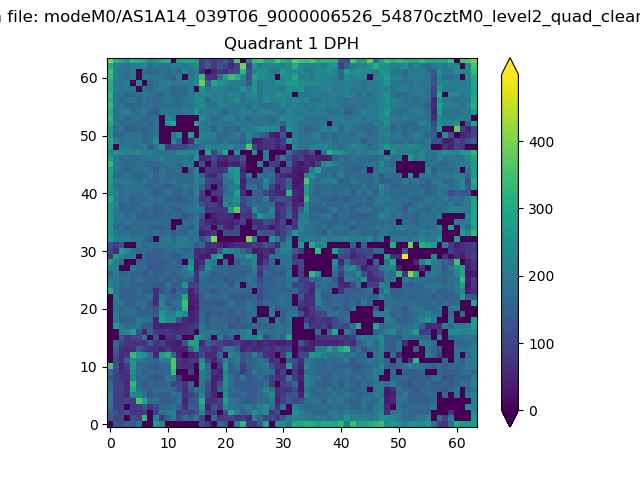 |
Quadrant B |
|---|---|---|---|
| Quadrant D | 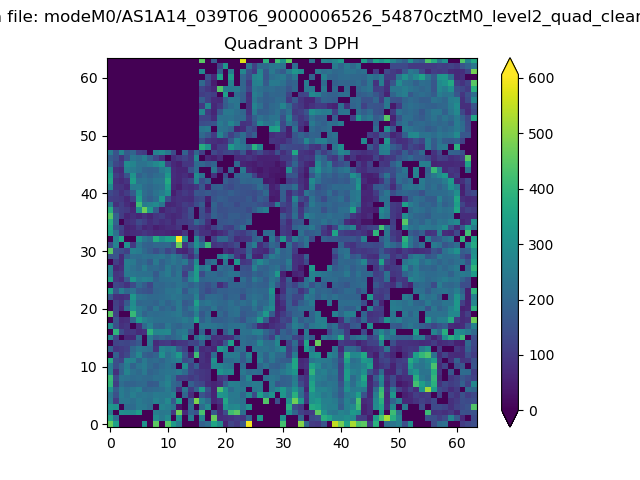 |
 |
Quadrant C |
| Plot type | Count rate plots | Images |
|---|---|---|
| Comparison with Poisson distribution Blue bars denote a histogram of data divided into 1 sec bins. Red curve is a Poisson curve with rate = median count rate of data. |
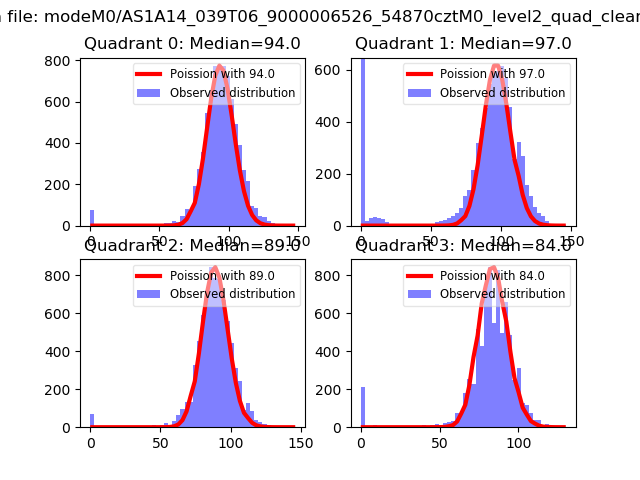 |
 |
| Quadrant-wise count rates Data is divided into 100 sec bins |
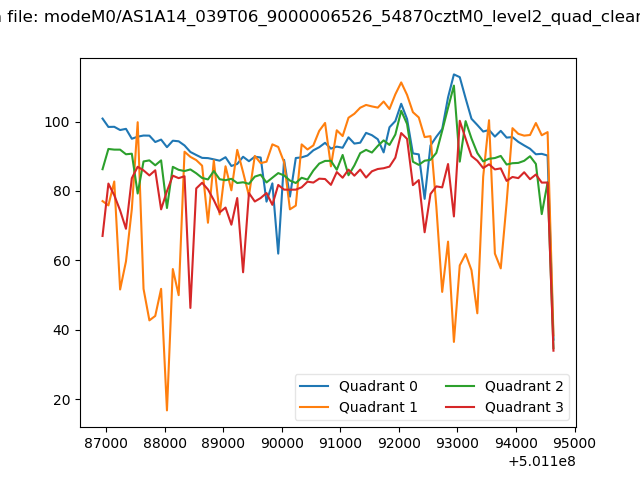 |
|
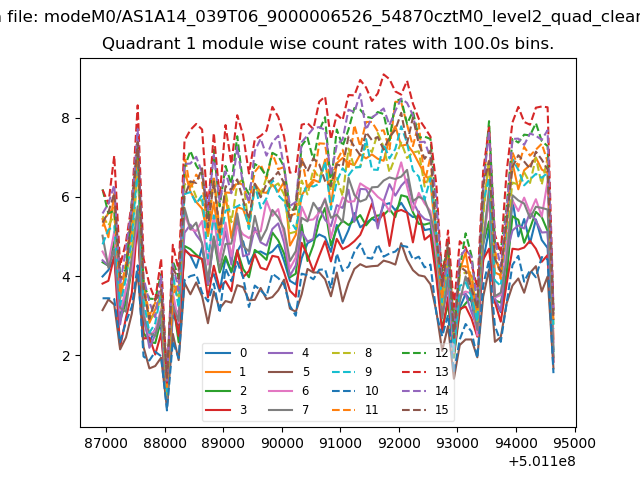
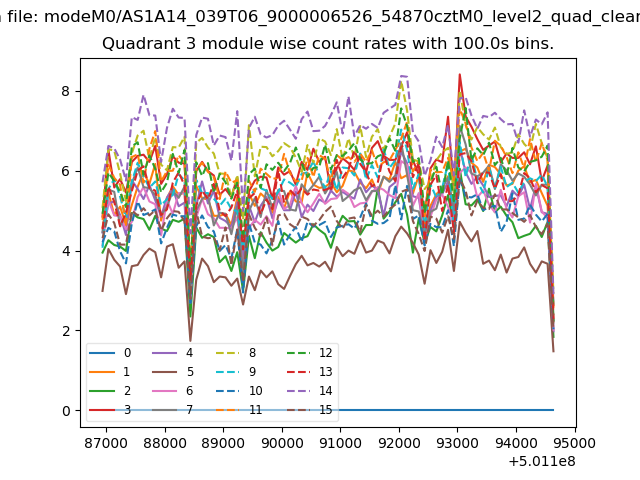
| Module-wise count rates for Quadrant A Data is divided into 100 sec bins |
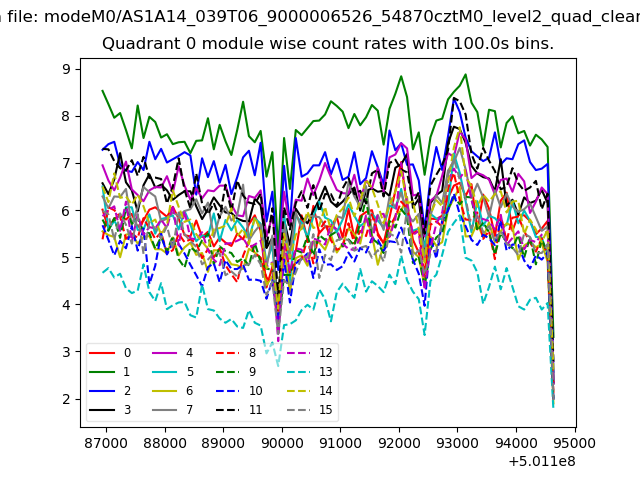 |
 |
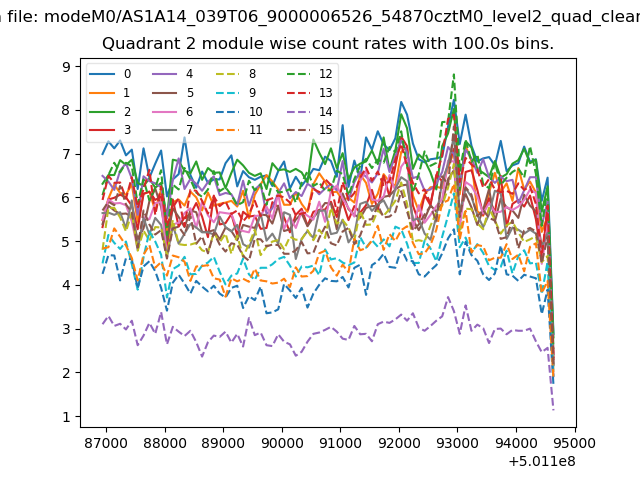
| Module-wise count rates for Quadrant B Data is divided into 100 sec bins |
 |
 |
| Module-wise count rates for Quadrant C Data is divided into 100 sec bins |
 |
 |
| Module-wise count rates for Quadrant D Data is divided into 100 sec bins |
 |
 |
| Parameter | Plot |
|---|---|
| CZT HV Monitor | 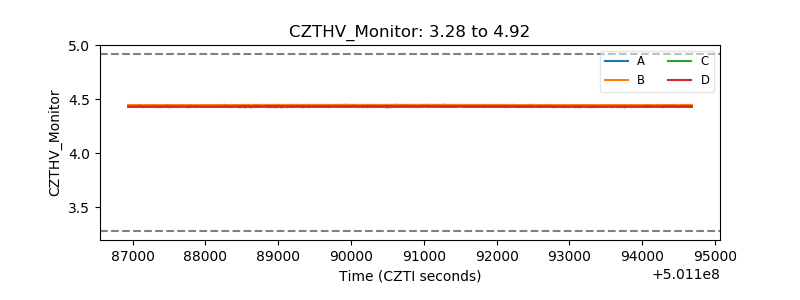 |
| D_VDD | 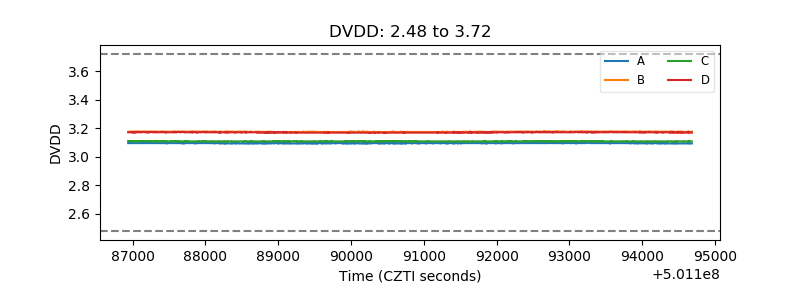 |
| Temperature 1 | 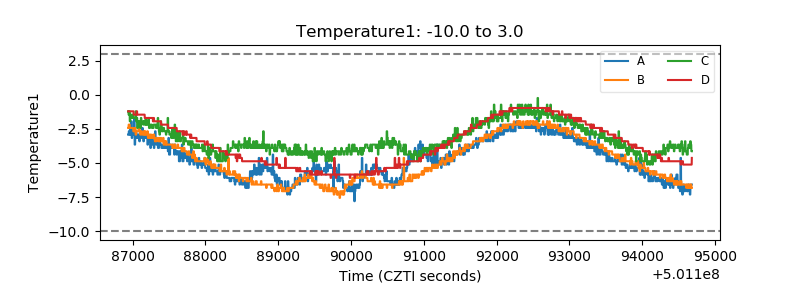 |
| Veto HV Monitor | 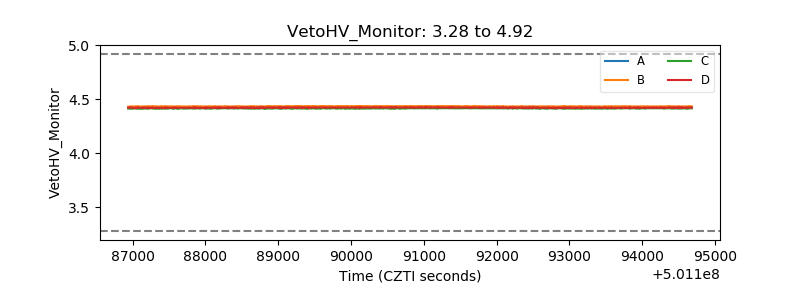 |
| Veto LLD | 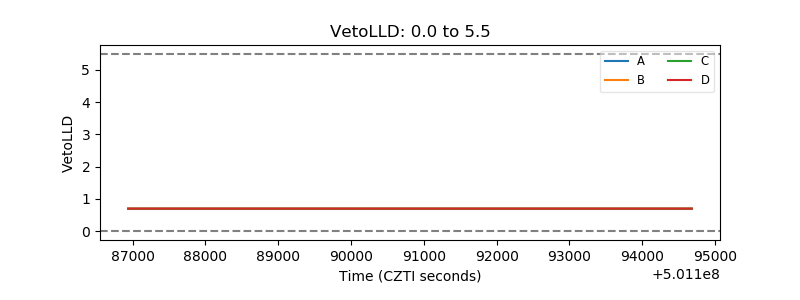 |
| Alpha Counter | 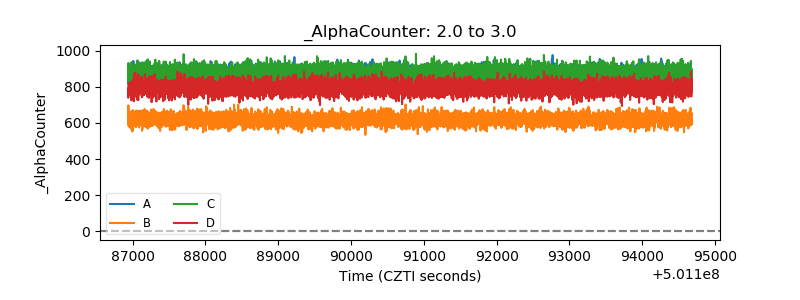 |
| _CPM_Rate | 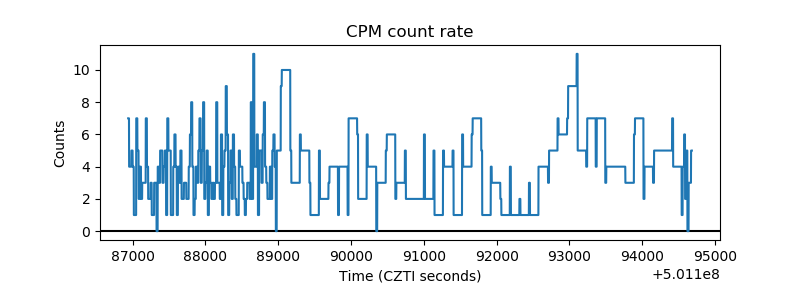 |
| CZT Counter |  |
| +2.5 Volts monitor |  |
| +5 Volts monitor |  |
| _ROLL_ROT | 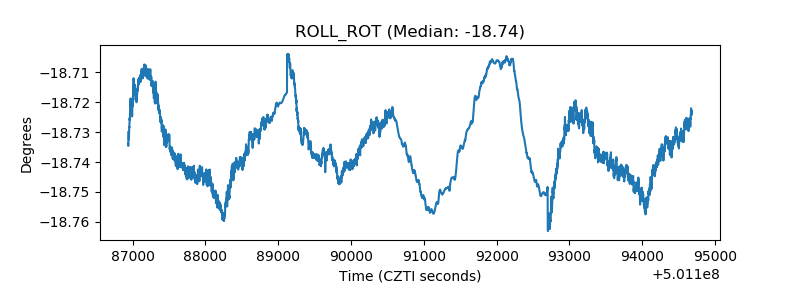 |
| _Roll_DEC | 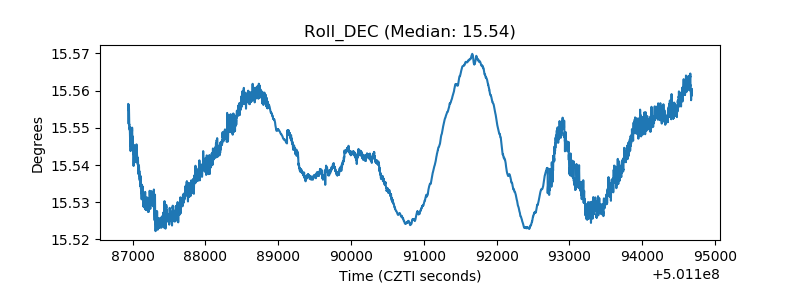 |
| _Roll_RA | 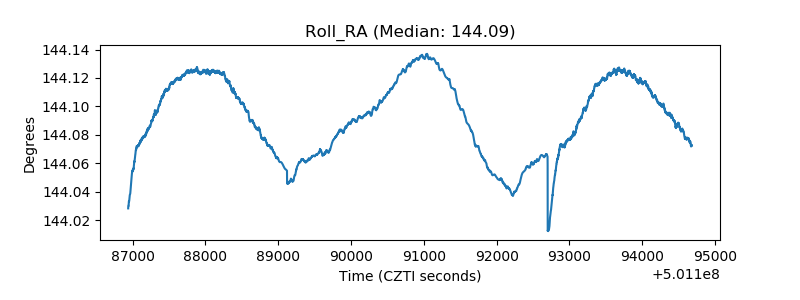 |
| Veto Counter | 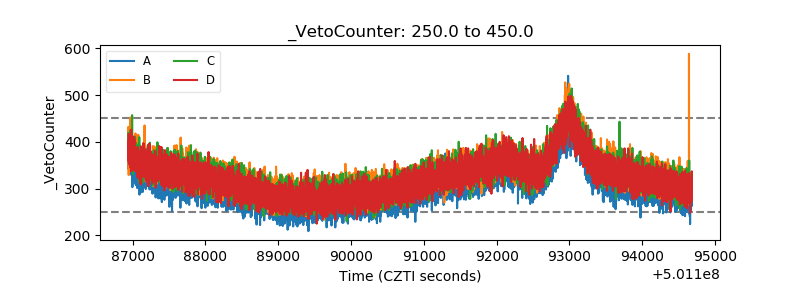 |