| Param | Original file | Final file |
|---|---|---|
| Filename | modeM0/AS1A14_039T06_9000006526_54874cztM0_level2.fits | modeM0/AS1A14_039T06_9000006526_54874cztM0_level2_quad_clean.evt |
| Size (bytes) | 1,908,426,240 | 363,021,120 |
| Size | 1.8 GB | 346.2 MB |
| Events in quadrant A | 13,282,174 | 2,422,783 |
| Events in quadrant B | 18,529,225 | 2,405,532 |
| Events in quadrant C | 14,409,714 | 2,293,756 |
| Events in quadrant D | 22,403,858 | 2,073,629 |
| Mode M9 | |||
|---|---|---|---|
| Quadrant | BADHDUFLAG | Total packets | Discarded packets |
| A | 0 | 18 | 0 |
| B | 0 | 18 | 0 |
| C | 0 | 18 | 0 |
| D | 0 | 18 | 0 |
| Mode M0 | |||
|---|---|---|---|
| Quadrant | BADHDUFLAG | Total packets | Discarded packets |
| A | 0 | 59129 | 34 |
| B | 0 | 75215 | 19 |
| C | 0 | 62181 | 20 |
| D | 0 | 84975 | 49 |
| Mode SS | |||
|---|---|---|---|
| Quadrant | BADHDUFLAG | Total packets | Discarded packets |
| A | 0 | 524 | 0 |
| B | 0 | 524 | 0 |
| C | 0 | 524 | 0 |
| D | 0 | 524 | 0 |
| Quadrant | Total seconds | Saturated seconds | Saturation percentage |
|---|---|---|---|
| A | 26111 | 416 | 1.593198% |
| B | 26114 | 2764 | 10.584361% |
| C | 26115 | 591 | 2.263067% |
| D | 26109 | 2053 | 7.863189% |
Noise dominated data is calculated using 1-second bins in cleaned event files. If a bin has >2000 counts, and if more than 50% of those come from <1% of pixels, then it is considered to be noise-dominated and hence unusable.
| Quadrant | # 1 sec bins | Bins with >0 counts | Bins with >2000 counts | High rate bins dominated by noise | Noise dominated (total time) | Noise dominated (detector-on time) | Marked lightcurve |
|---|---|---|---|---|---|---|---|
| A | 27768 | 26120 | 211 | 211 | 0.76% | 0.81% | 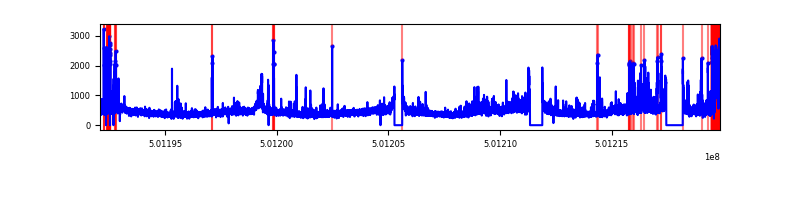 |
| B | 27769 | 26119 | 1020 | 1020 | 3.67% | 3.91% | 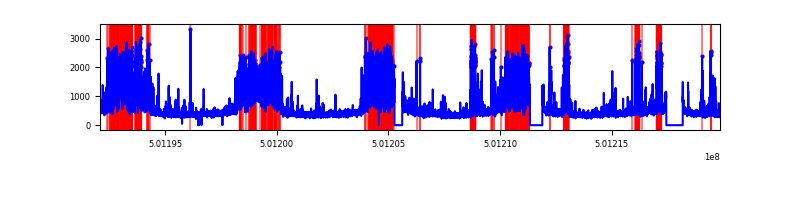 |
| C | 27769 | 26124 | 486 | 486 | 1.75% | 1.86% | 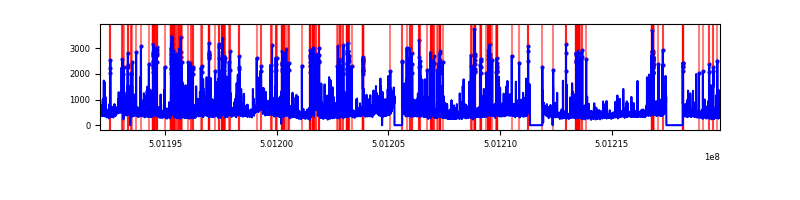 |
| D | 27770 | 26120 | 2085 | 2085 | 7.51% | 7.98% | 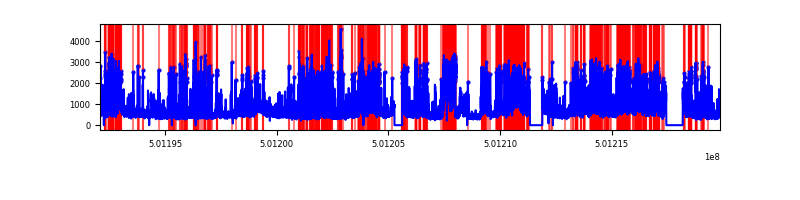 |
Top three noisy pixels from each quadrant. If the there are fewer than three noisy pixels in the level2.evt file, extra rows are filled as -1
| Pixel properties | Quadrant properties | ||||||
|---|---|---|---|---|---|---|---|
| Quadrant | DetID | PixID | Counts | Sigma | Mean | Median | Sigma |
| A | 3 | 14 | 1476801 | 2162.97 | 2789 | 2724 | 681.5 |
| A | 7 | 14 | 409661 | 597.11 | 2789 | 2724 | 681.5 |
| A | 0 | 8 | 347880 | 506.46 | 2789 | 2724 | 681.5 |
| B | 10 | 247 | 6091568 | 10577.77 | 2681 | 2576 | 575.6 |
| B | 5 | 185 | 1530366 | 2654.07 | 2681 | 2576 | 575.6 |
| B | 7 | 252 | 78890 | 132.57 | 2681 | 2576 | 575.6 |
| C | 12 | 249 | 954803 | 1299.59 | 2693 | 2671 | 732.6 |
| C | 14 | 254 | 748213 | 1017.61 | 2693 | 2671 | 732.6 |
| C | 12 | 252 | 637824 | 866.94 | 2693 | 2671 | 732.6 |
| D | 11 | 176 | 8603257 | 11654.59 | 2625 | 2517 | 738.0 |
| D | 6 | 239 | 1187288 | 1605.45 | 2625 | 2517 | 738.0 |
| D | 6 | 46 | 786201 | 1061.95 | 2625 | 2517 | 738.0 |
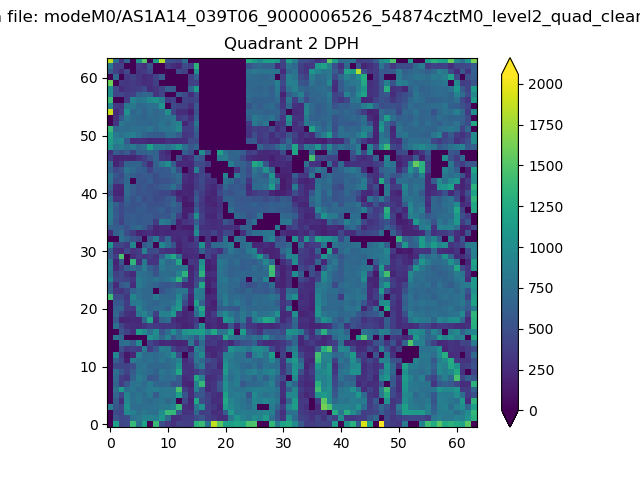
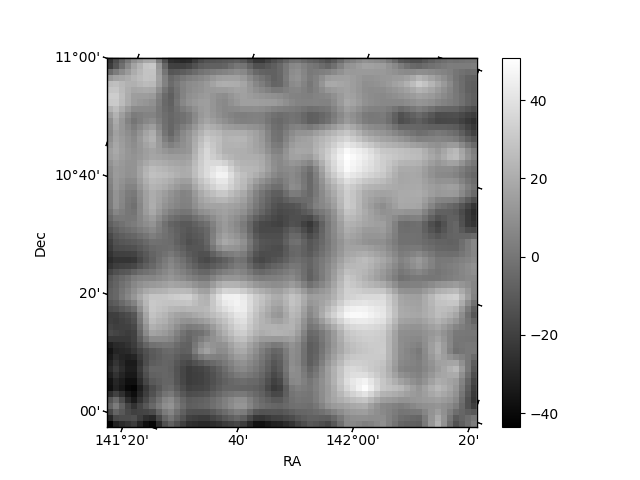
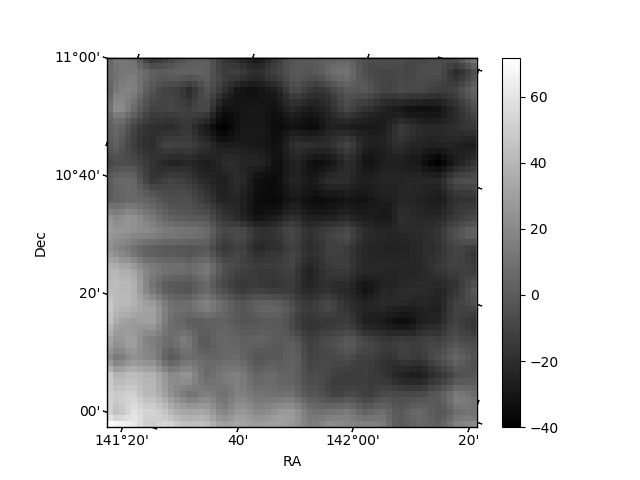
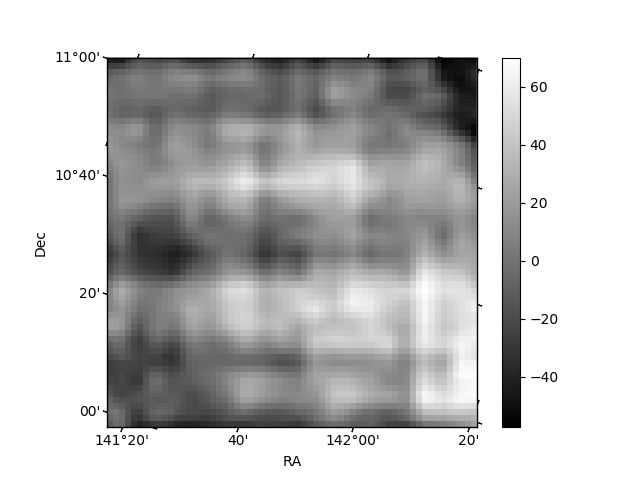
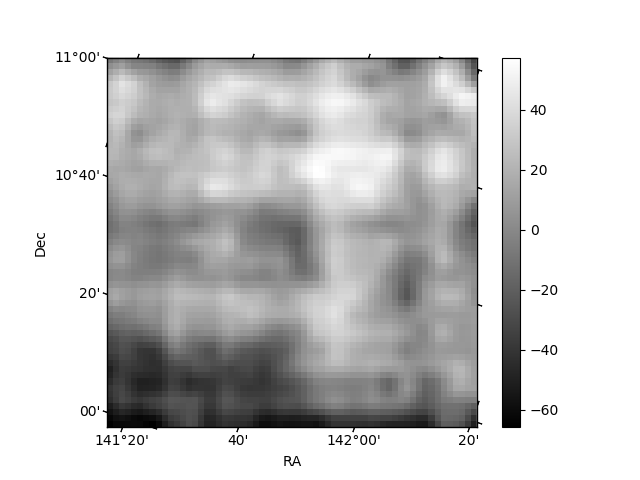
Histogram calculated using DETX and DETY for each event in the final _common_clean file
| Quadrant A |  |
 |
Quadrant B |
|---|---|---|---|
| Quadrant D | 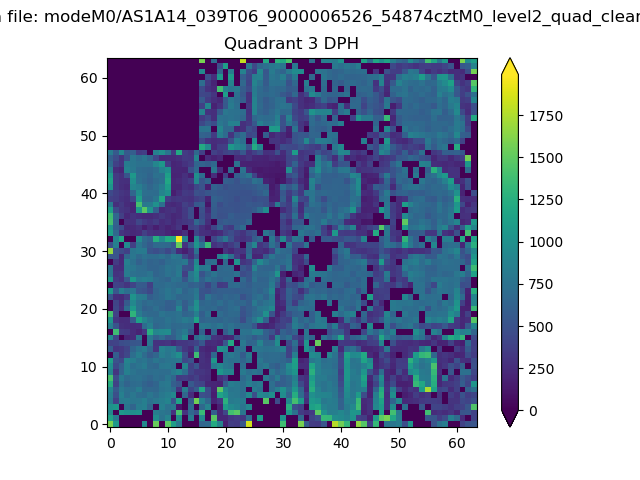 |
 |
Quadrant C |
| Plot type | Count rate plots | Images |
|---|---|---|
| Comparison with Poisson distribution Blue bars denote a histogram of data divided into 1 sec bins. Red curve is a Poisson curve with rate = median count rate of data. |
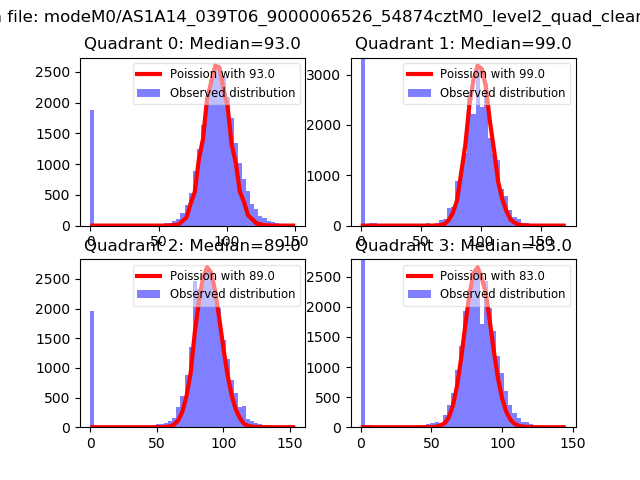 |
 |
| Quadrant-wise count rates Data is divided into 100 sec bins |
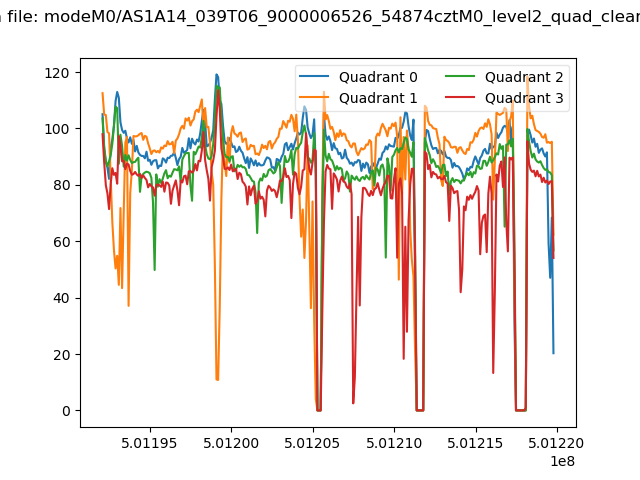 |
|
| Module-wise count rates for Quadrant A Data is divided into 100 sec bins |
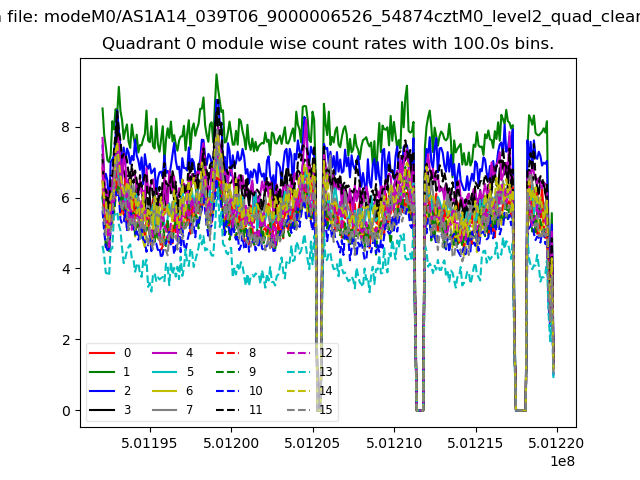 |
 |
| Module-wise count rates for Quadrant B Data is divided into 100 sec bins |
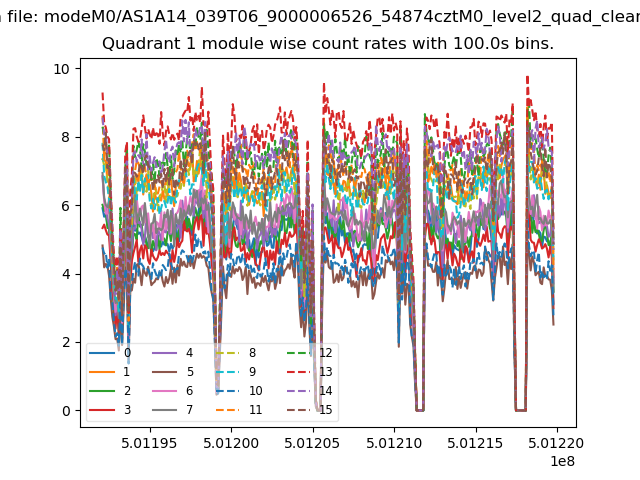 |
 |
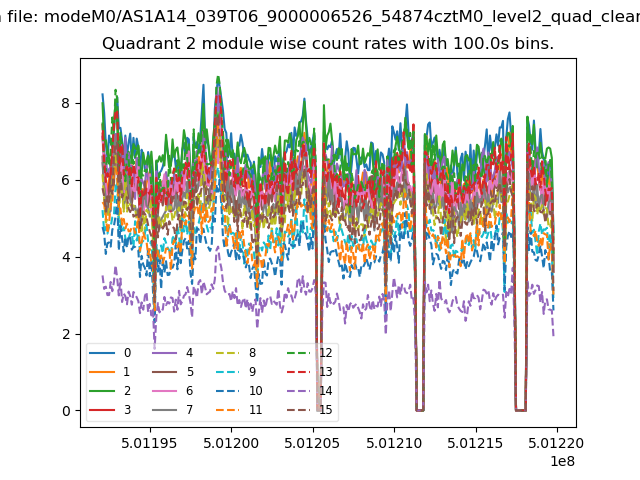
| Module-wise count rates for Quadrant C Data is divided into 100 sec bins |
 |
 |
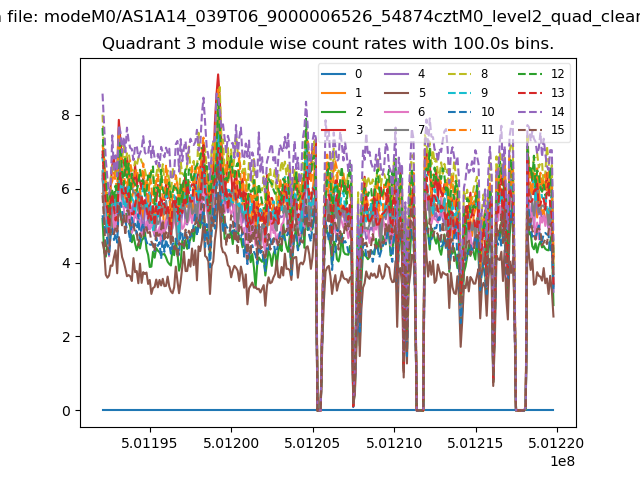
| Module-wise count rates for Quadrant D Data is divided into 100 sec bins |
 |
 |
| Parameter | Plot |
|---|---|
| CZT HV Monitor | 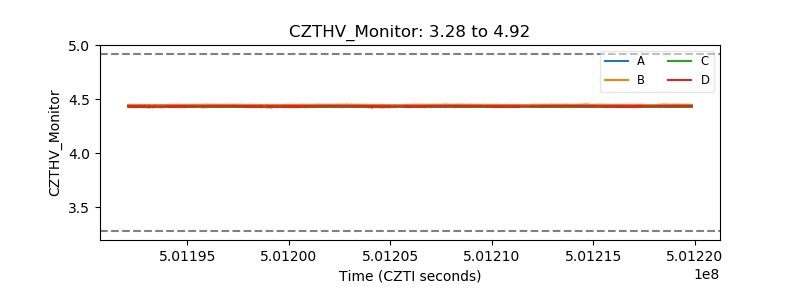 |
| D_VDD | 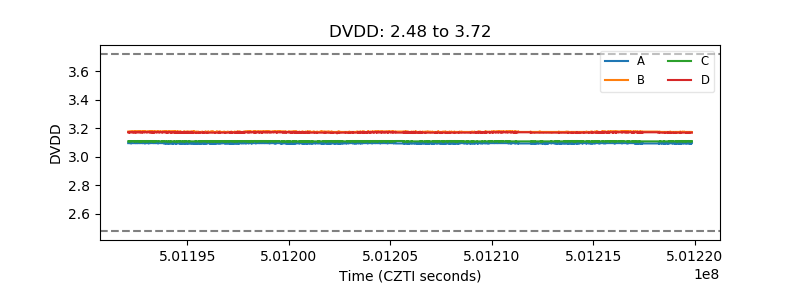 |
| Temperature 1 | 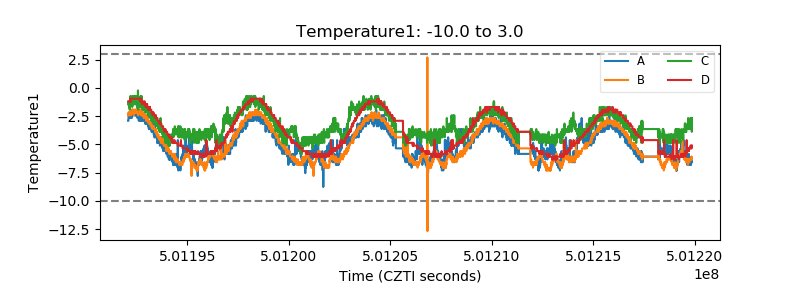 |
| Veto HV Monitor | 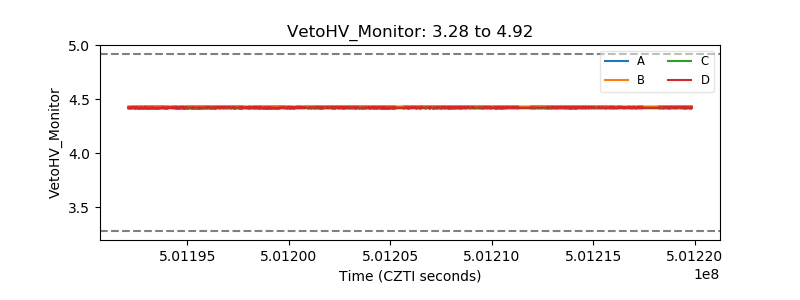 |
| Veto LLD | 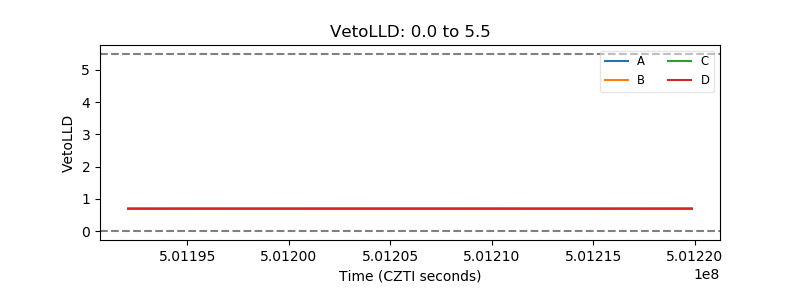 |
| Alpha Counter | 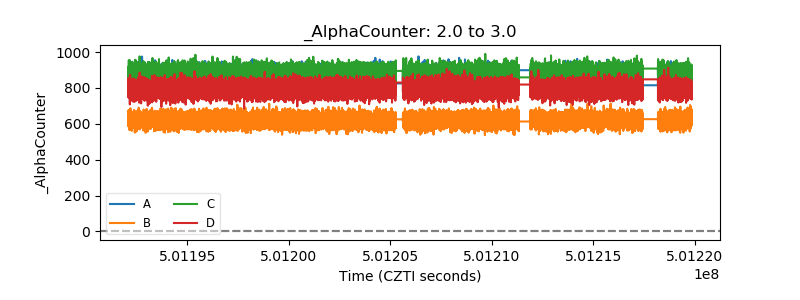 |
| _CPM_Rate | 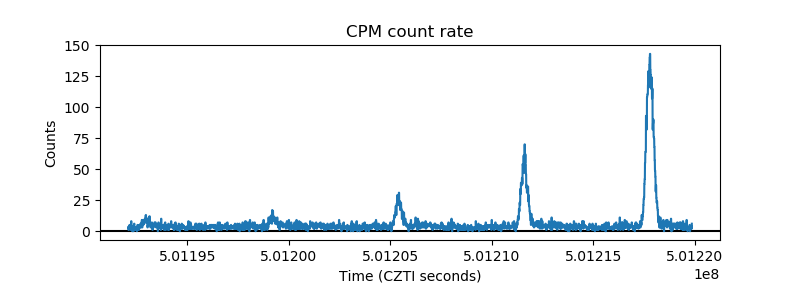 |
| CZT Counter |  |
| +2.5 Volts monitor |  |
| +5 Volts monitor | 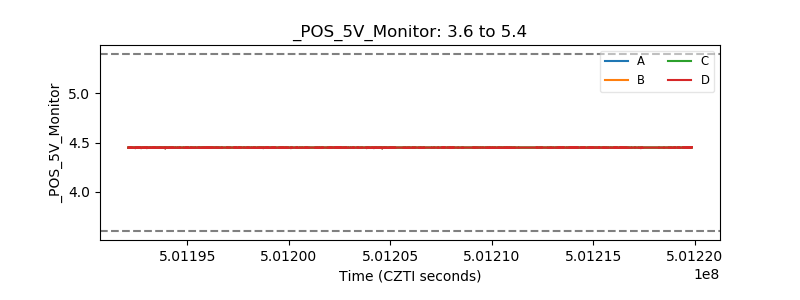 |
| _ROLL_ROT | 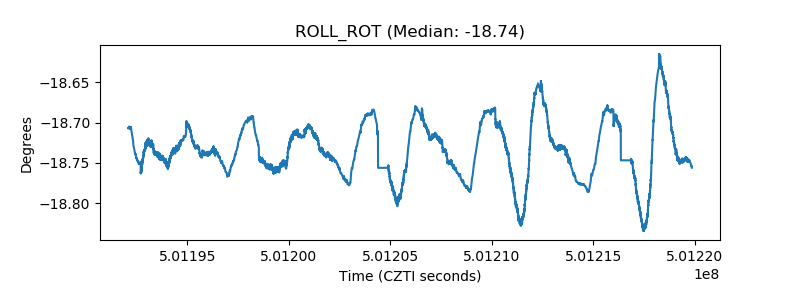 |
| _Roll_DEC | 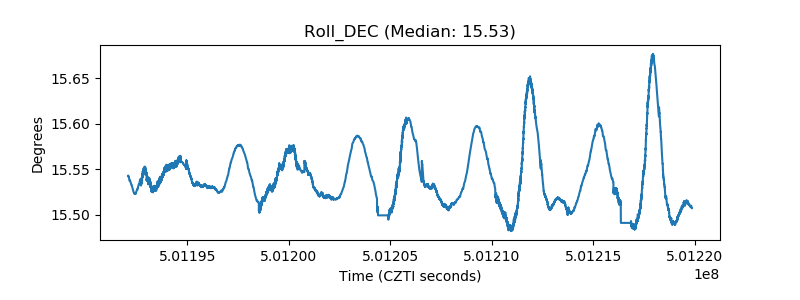 |
| _Roll_RA | 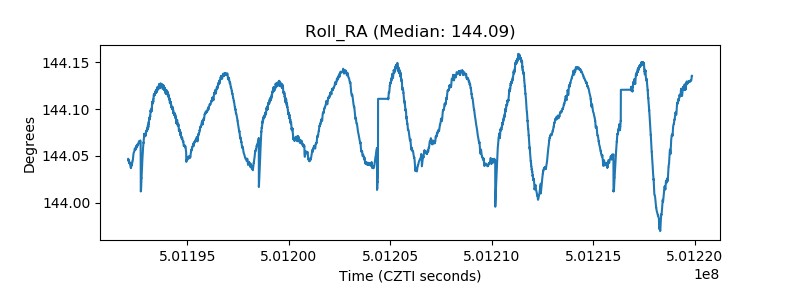 |
| Veto Counter | 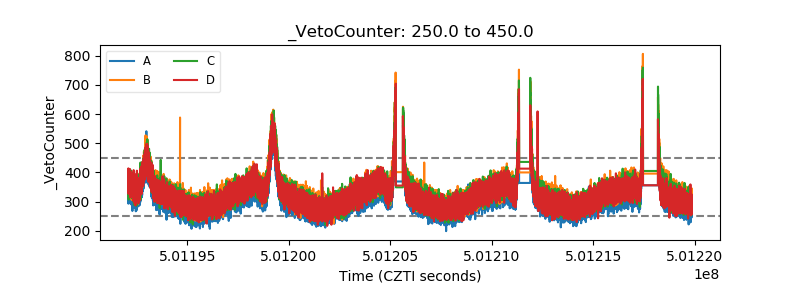 |