| Param | Original file | Final file |
|---|---|---|
| Filename | modeM0/AS1A14_039T06_9000006526_54875cztM0_level2.fits | modeM0/AS1A14_039T06_9000006526_54875cztM0_level2_quad_clean.evt |
| Size (bytes) | 509,420,160 | 108,181,440 |
| Size | 485.8 MB | 103.2 MB |
| Events in quadrant A | 4,824,660 | 691,907 |
| Events in quadrant B | 4,175,733 | 756,941 |
| Events in quadrant C | 3,838,171 | 676,242 |
| Events in quadrant D | 5,428,529 | 622,008 |
| Mode M9 | |||
|---|---|---|---|
| Quadrant | BADHDUFLAG | Total packets | Discarded packets |
| A | 0 | 17 | 0 |
| B | 0 | 17 | 0 |
| C | 0 | 17 | 0 |
| D | 0 | 17 | 0 |
| Mode M0 | |||
|---|---|---|---|
| Quadrant | BADHDUFLAG | Total packets | Discarded packets |
| A | 0 | 19419 | 4 |
| B | 0 | 18030 | 11 |
| C | 0 | 17054 | 4 |
| D | 0 | 21619 | 6 |
| Mode SS | |||
|---|---|---|---|
| Quadrant | BADHDUFLAG | Total packets | Discarded packets |
| A | 0 | 156 | 0 |
| B | 0 | 156 | 0 |
| C | 0 | 156 | 0 |
| D | 0 | 156 | 0 |
| Quadrant | Total seconds | Saturated seconds | Saturation percentage |
|---|---|---|---|
| A | 7597 | 302 | 3.975253% |
| B | 7596 | 165 | 2.172196% |
| C | 7598 | 77 | 1.013425% |
| D | 7597 | 338 | 4.449125% |
Noise dominated data is calculated using 1-second bins in cleaned event files. If a bin has >2000 counts, and if more than 50% of those come from <1% of pixels, then it is considered to be noise-dominated and hence unusable.
| Quadrant | # 1 sec bins | Bins with >0 counts | Bins with >2000 counts | High rate bins dominated by noise | Noise dominated (total time) | Noise dominated (detector-on time) | Marked lightcurve |
|---|---|---|---|---|---|---|---|
| A | 9258 | 7598 | 232 | 232 | 2.51% | 3.05% | 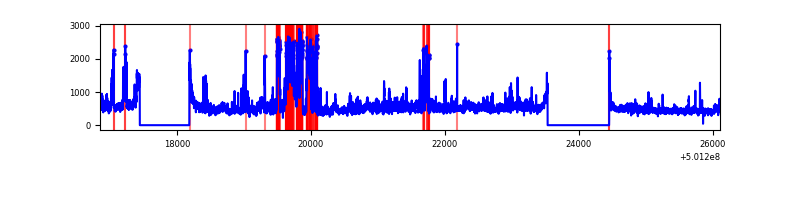 |
| B | 9258 | 7599 | 99 | 99 | 1.07% | 1.30% | 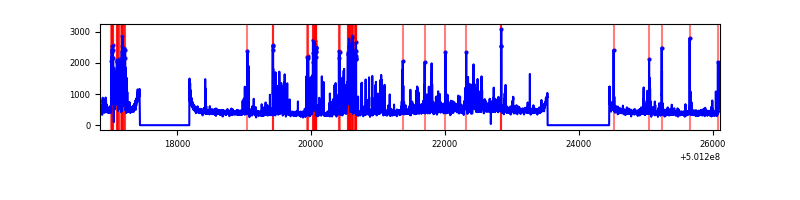 |
| C | 9259 | 7601 | 60 | 60 | 0.65% | 0.79% | 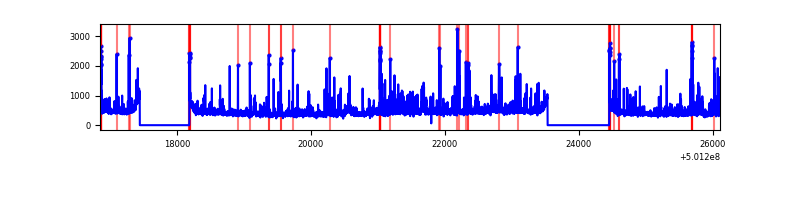 |
| D | 9259 | 7600 | 323 | 323 | 3.49% | 4.25% |  |
Top three noisy pixels from each quadrant. If the there are fewer than three noisy pixels in the level2.evt file, extra rows are filled as -1
| Pixel properties | Quadrant properties | ||||||
|---|---|---|---|---|---|---|---|
| Quadrant | DetID | PixID | Counts | Sigma | Mean | Median | Sigma |
| A | 3 | 14 | 1004645 | 5109.01 | 798 | 780 | 196.5 |
| A | 7 | 14 | 644621 | 3276.72 | 798 | 780 | 196.5 |
| A | 13 | 254 | 16951 | 82.3 | 798 | 780 | 196.5 |
| B | 5 | 185 | 882516 | 5178.53 | 790 | 761 | 170.3 |
| B | 10 | 247 | 132258 | 772.28 | 790 | 761 | 170.3 |
| B | 12 | 111 | 20676 | 116.96 | 790 | 761 | 170.3 |
| C | 12 | 252 | 274857 | 1282.41 | 777 | 771 | 213.7 |
| C | 6 | 223 | 183895 | 856.81 | 777 | 771 | 213.7 |
| C | 14 | 254 | 157007 | 731.01 | 777 | 771 | 213.7 |
| D | 11 | 176 | 1526681 | 7040.21 | 762 | 728 | 216.7 |
| D | 6 | 239 | 335799 | 1545.9 | 762 | 728 | 216.7 |
| D | 10 | 181 | 116075 | 532.17 | 762 | 728 | 216.7 |
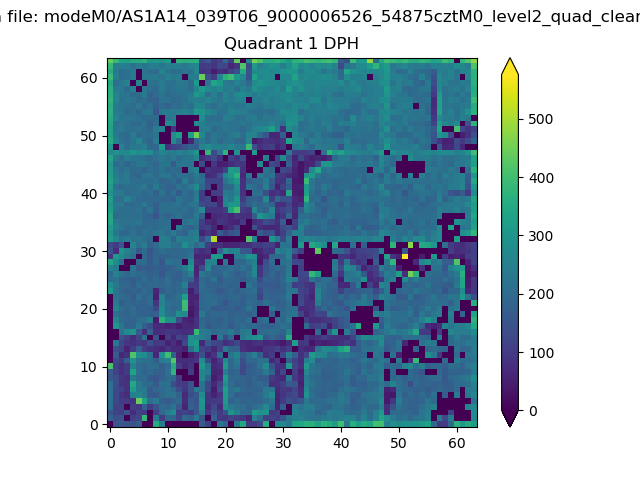
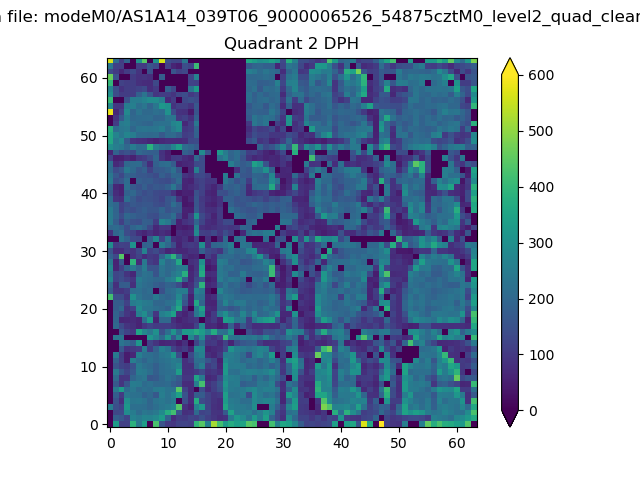
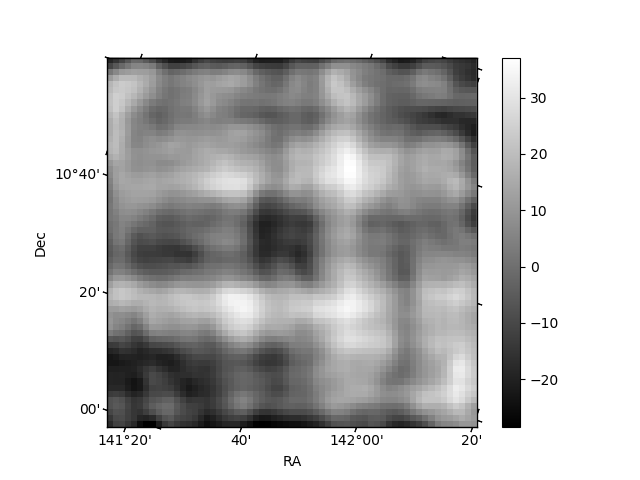
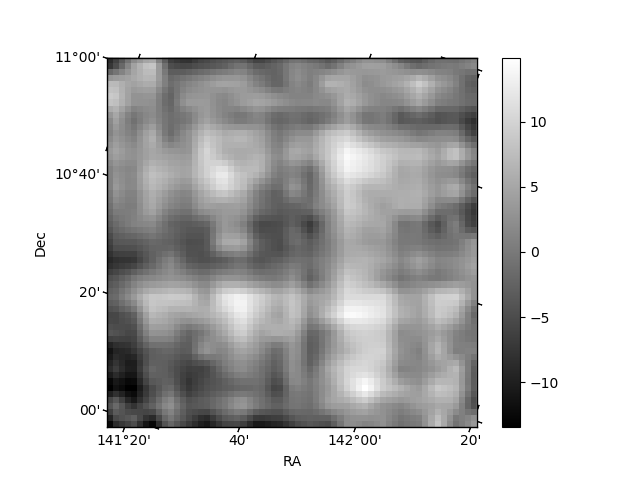
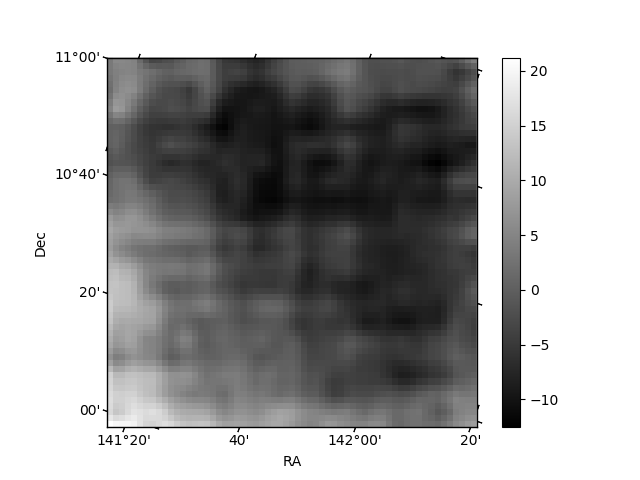
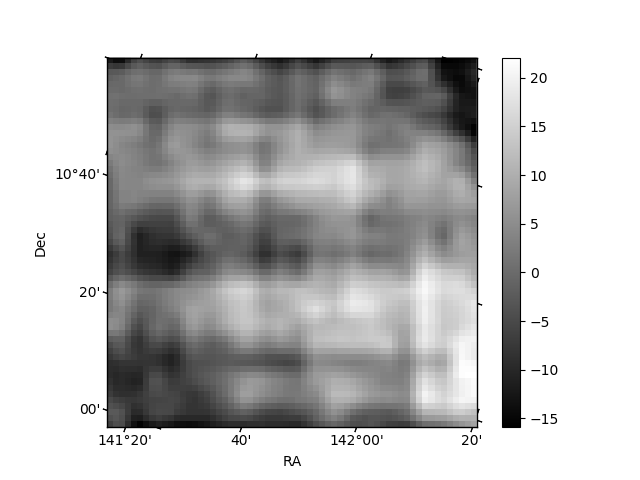
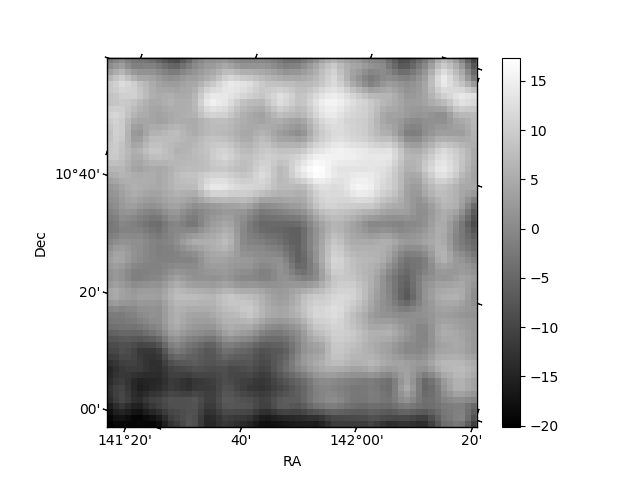
Histogram calculated using DETX and DETY for each event in the final _common_clean file
| Quadrant A | 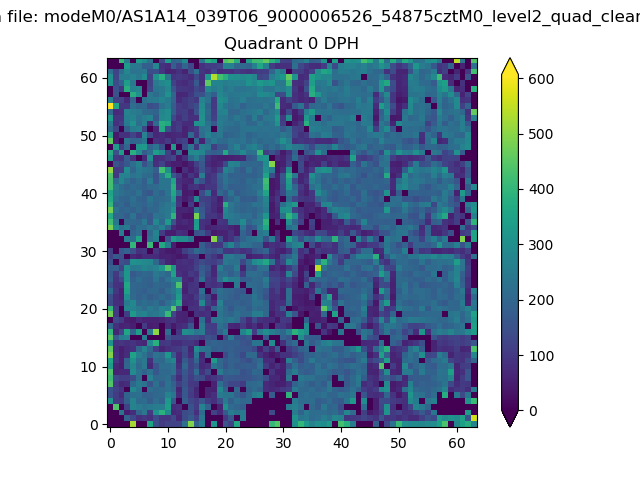 |
 |
Quadrant B |
|---|---|---|---|
| Quadrant D | 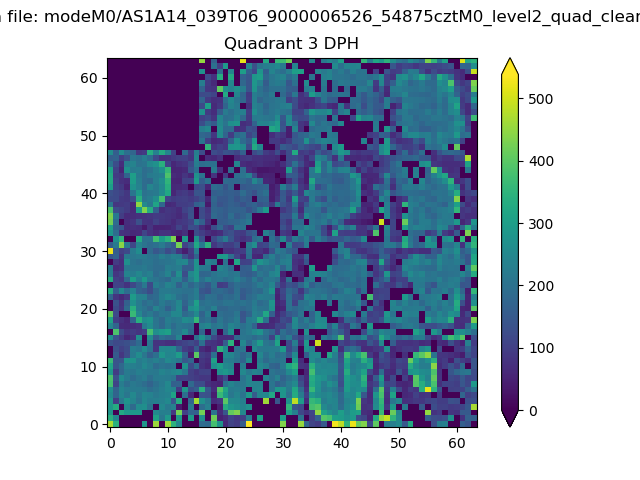 |
 |
Quadrant C |
| Plot type | Count rate plots | Images |
|---|---|---|
| Comparison with Poisson distribution Blue bars denote a histogram of data divided into 1 sec bins. Red curve is a Poisson curve with rate = median count rate of data. |
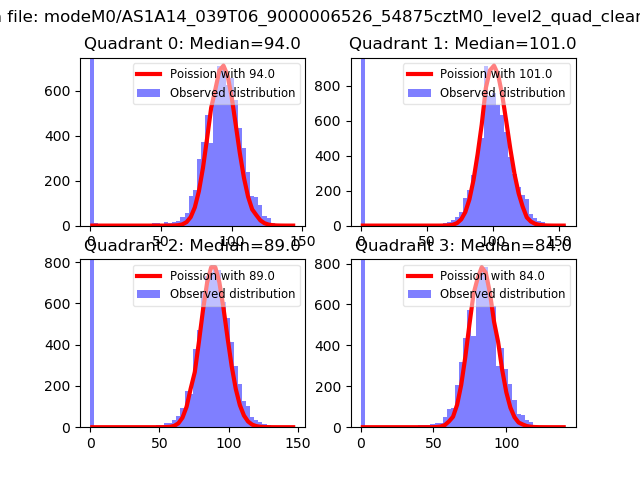 |
 |
| Quadrant-wise count rates Data is divided into 100 sec bins |
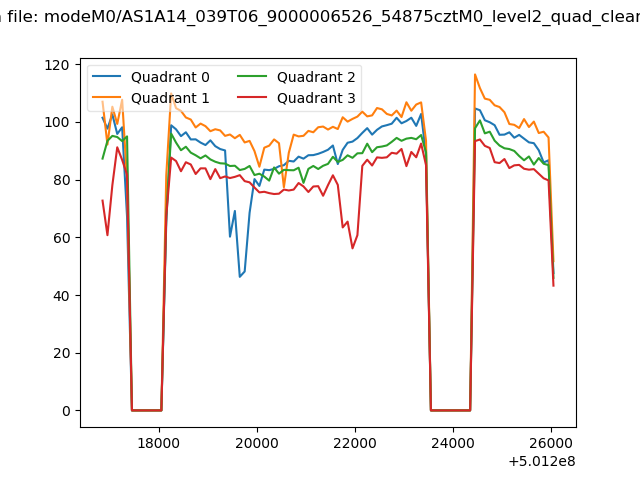 |
|
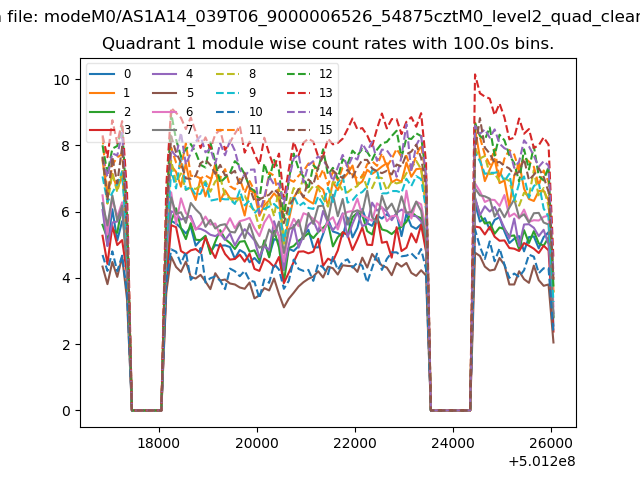
| Module-wise count rates for Quadrant A Data is divided into 100 sec bins |
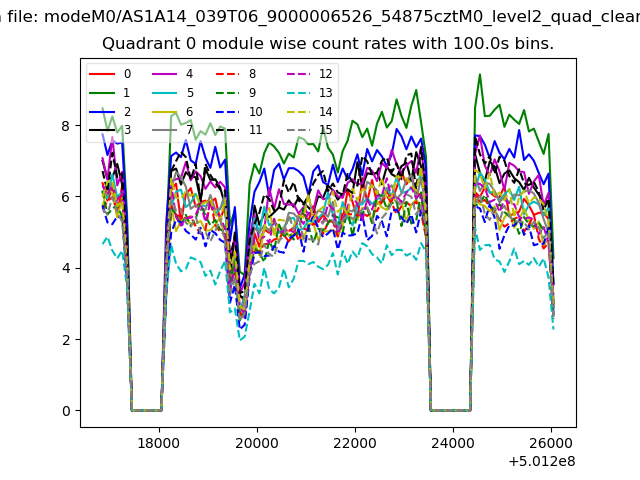 |
 |
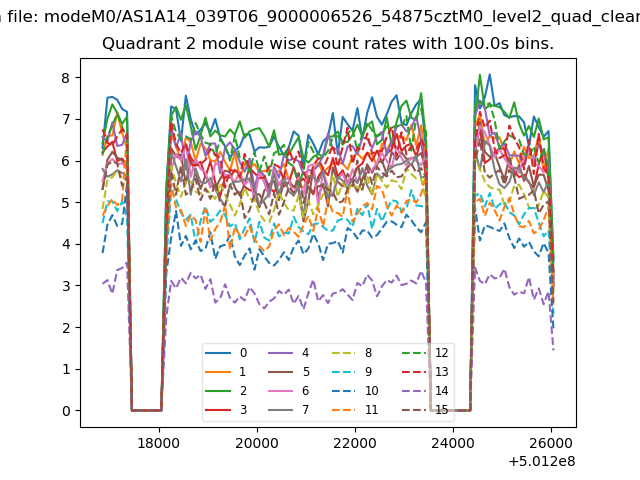
| Module-wise count rates for Quadrant B Data is divided into 100 sec bins |
 |
 |
| Module-wise count rates for Quadrant C Data is divided into 100 sec bins |
 |
 |
| Module-wise count rates for Quadrant D Data is divided into 100 sec bins |
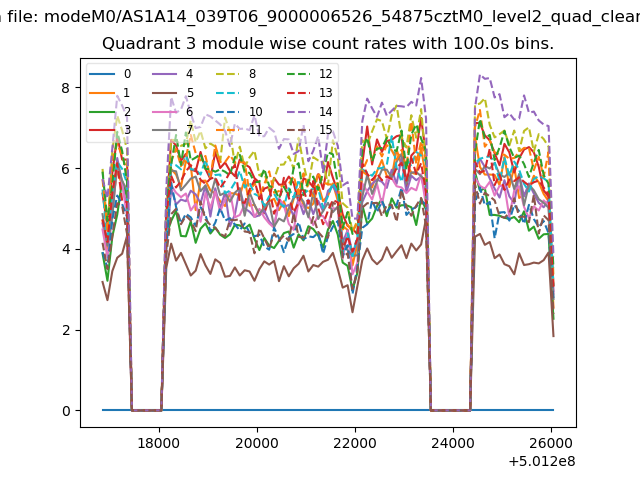 |
 |
| Parameter | Plot |
|---|---|
| CZT HV Monitor | 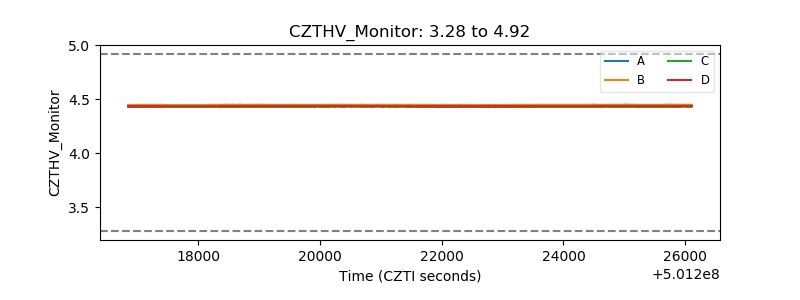 |
| D_VDD | 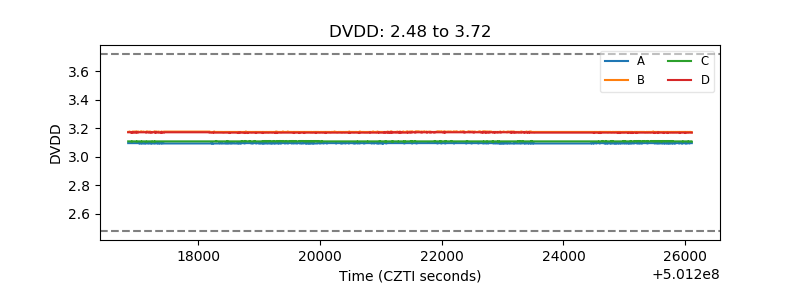 |
| Temperature 1 | 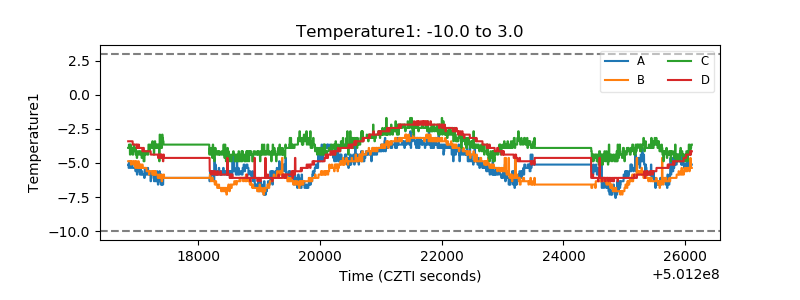 |
| Veto HV Monitor | 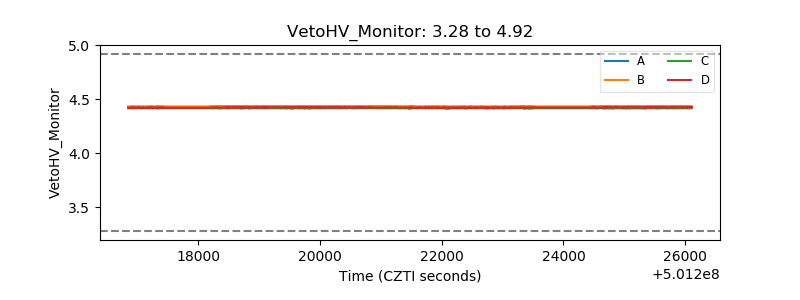 |
| Veto LLD | 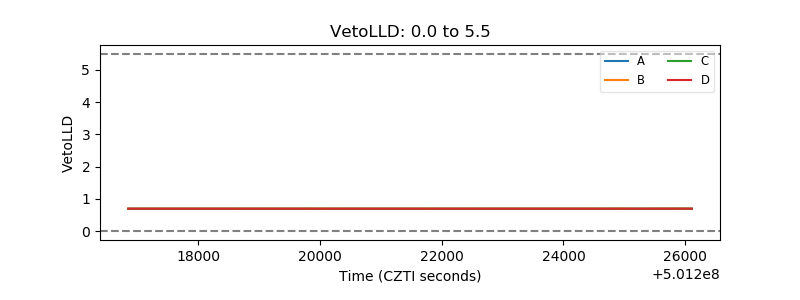 |
| Alpha Counter | 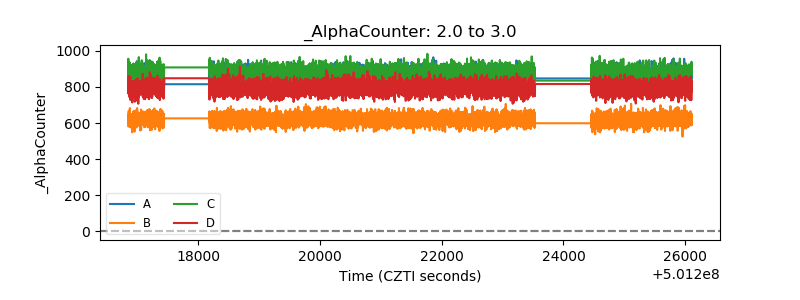 |
| _CPM_Rate | 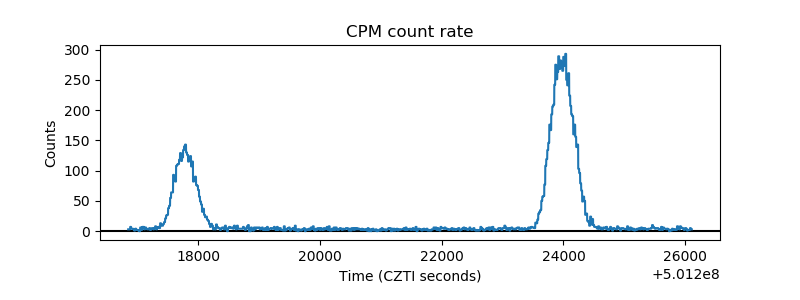 |
| CZT Counter | 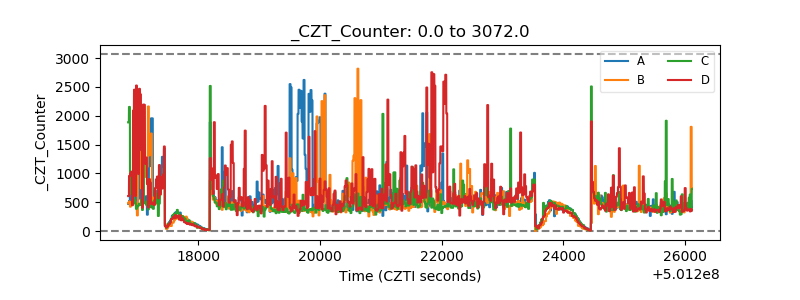 |
| +2.5 Volts monitor | 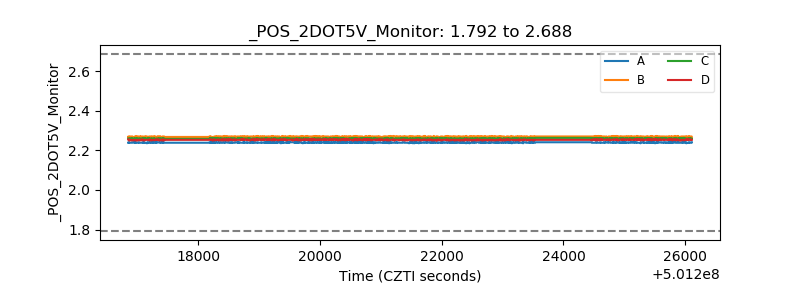 |
| +5 Volts monitor | 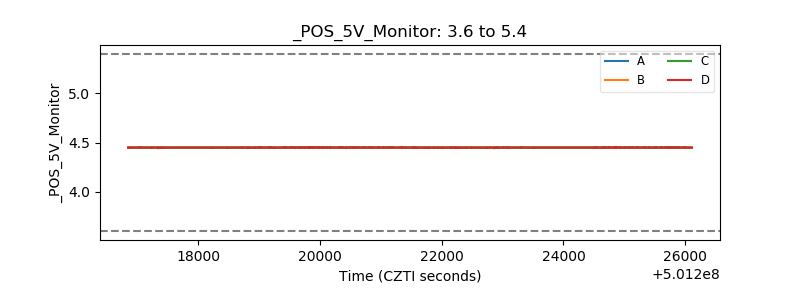 |
| _ROLL_ROT | 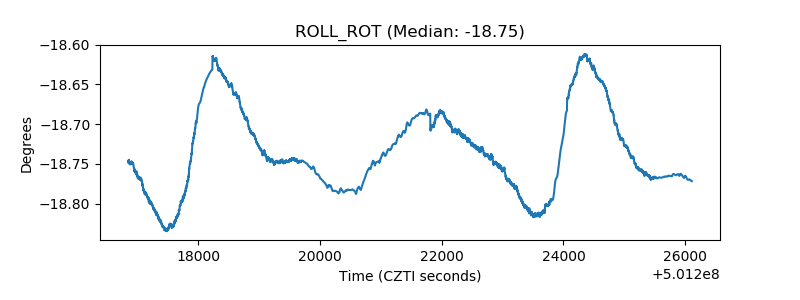 |
| _Roll_DEC | 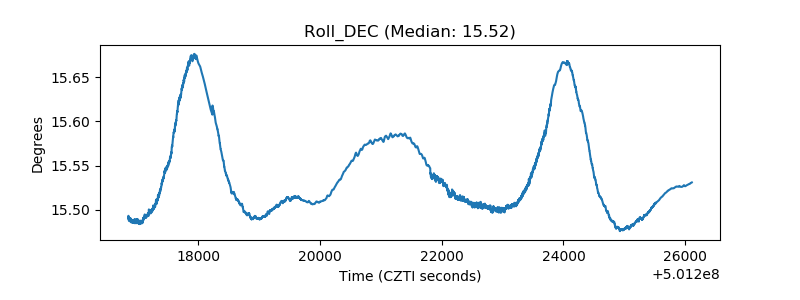 |
| _Roll_RA | 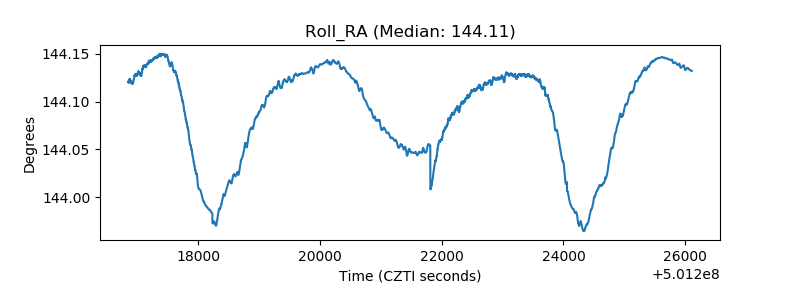 |
| Veto Counter | 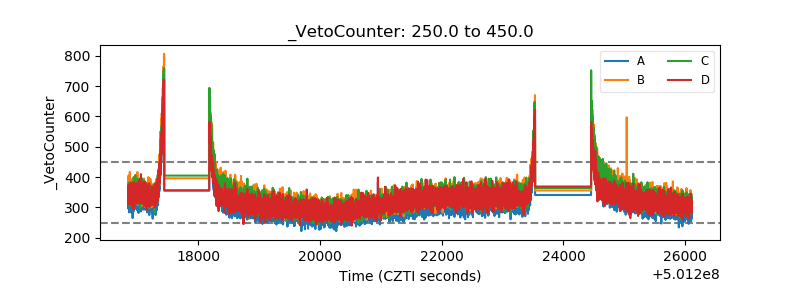 |