| Param | Original file | Final file |
|---|---|---|
| Filename | modeM0/AS1A14_039T06_9000006526_54877cztM0_level2.fits | modeM0/AS1A14_039T06_9000006526_54877cztM0_level2_quad_clean.evt |
| Size (bytes) | 392,054,400 | 99,192,960 |
| Size | 373.9 MB | 94.6 MB |
| Events in quadrant A | 3,786,398 | 644,553 |
| Events in quadrant B | 3,163,789 | 694,895 |
| Events in quadrant C | 3,555,731 | 612,045 |
| Events in quadrant D | 3,478,127 | 578,594 |
| Mode M9 | |||
|---|---|---|---|
| Quadrant | BADHDUFLAG | Total packets | Discarded packets |
| A | 0 | 17 | 0 |
| B | 0 | 18 | 0 |
| C | 0 | 18 | 0 |
| D | 0 | 18 | 0 |
| Mode M0 | |||
|---|---|---|---|
| Quadrant | BADHDUFLAG | Total packets | Discarded packets |
| A | 0 | 15754 | 2 |
| B | 0 | 14473 | 2 |
| C | 0 | 15649 | 2 |
| D | 0 | 15285 | 2 |
| Mode SS | |||
|---|---|---|---|
| Quadrant | BADHDUFLAG | Total packets | Discarded packets |
| A | 0 | 138 | 0 |
| B | 0 | 138 | 0 |
| C | 0 | 138 | 0 |
| D | 0 | 138 | 0 |
| Quadrant | Total seconds | Saturated seconds | Saturation percentage |
|---|---|---|---|
| A | 6793 | 99 | 1.457383% |
| B | 6793 | 89 | 1.310172% |
| C | 6793 | 127 | 1.869572% |
| D | 6793 | 85 | 1.251288% |
Noise dominated data is calculated using 1-second bins in cleaned event files. If a bin has >2000 counts, and if more than 50% of those come from <1% of pixels, then it is considered to be noise-dominated and hence unusable.
| Quadrant | # 1 sec bins | Bins with >0 counts | Bins with >2000 counts | High rate bins dominated by noise | Noise dominated (total time) | Noise dominated (detector-on time) | Marked lightcurve |
|---|---|---|---|---|---|---|---|
| A | 7788 | 6793 | 20 | 20 | 0.26% | 0.29% | 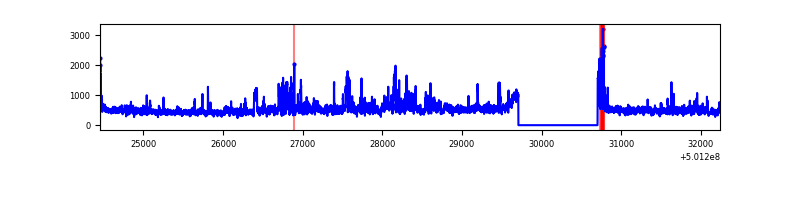 |
| B | 7788 | 6793 | 21 | 21 | 0.27% | 0.31% | 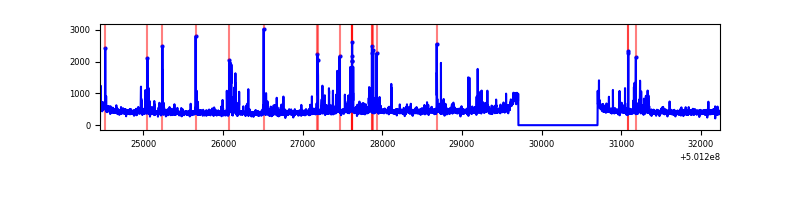 |
| C | 7788 | 6793 | 80 | 80 | 1.03% | 1.18% | 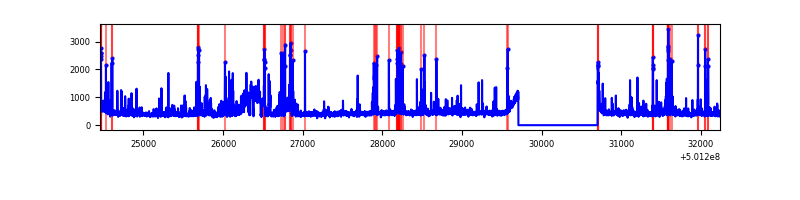 |
| D | 7788 | 6793 | 43 | 43 | 0.55% | 0.63% | 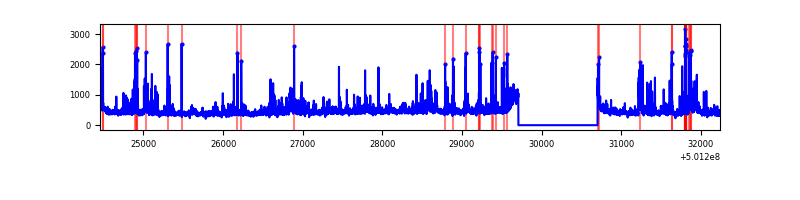 |
Top three noisy pixels from each quadrant. If the there are fewer than three noisy pixels in the level2.evt file, extra rows are filled as -1
| Pixel properties | Quadrant properties | ||||||
|---|---|---|---|---|---|---|---|
| Quadrant | DetID | PixID | Counts | Sigma | Mean | Median | Sigma |
| A | 3 | 14 | 856667 | 4782.16 | 723 | 705 | 179.0 |
| A | 9 | 129 | 52269 | 288.08 | 723 | 705 | 179.0 |
| A | 4 | 13 | 28048 | 152.76 | 723 | 705 | 179.0 |
| B | 5 | 185 | 268221 | 1739.02 | 713 | 684 | 153.8 |
| B | 10 | 247 | 23101 | 145.71 | 713 | 684 | 153.8 |
| B | 0 | 245 | 19872 | 124.72 | 713 | 684 | 153.8 |
| C | 4 | 5 | 371089 | 1935.83 | 698 | 690 | 191.3 |
| C | 14 | 254 | 168216 | 875.54 | 698 | 690 | 191.3 |
| C | 6 | 223 | 70672 | 365.75 | 698 | 690 | 191.3 |
| D | 6 | 239 | 228767 | 1148.57 | 699 | 670 | 198.6 |
| D | 6 | 46 | 89415 | 446.87 | 699 | 670 | 198.6 |
| D | 2 | 252 | 71221 | 355.26 | 699 | 670 | 198.6 |
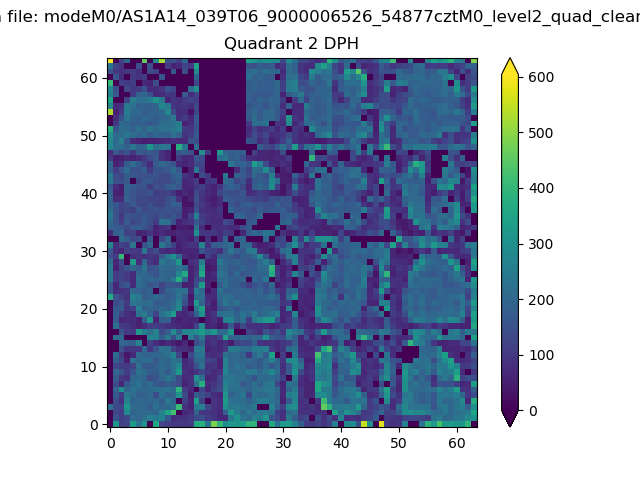
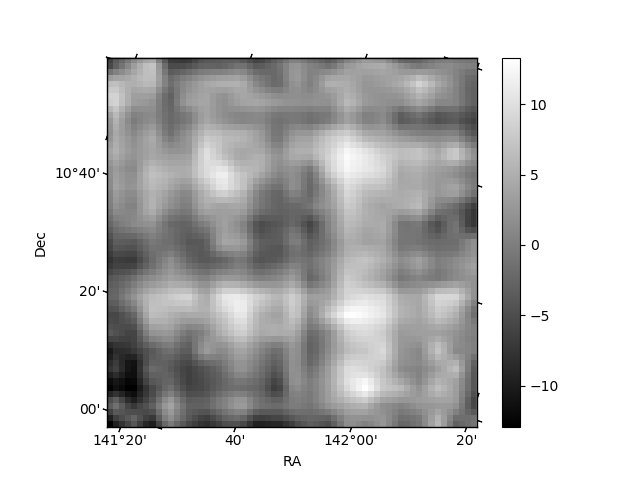
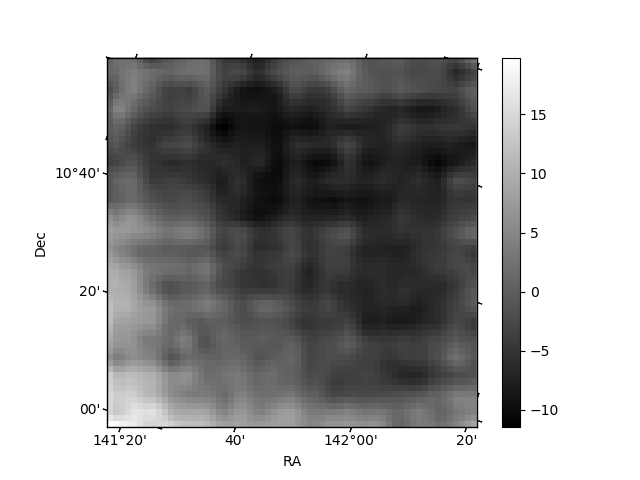
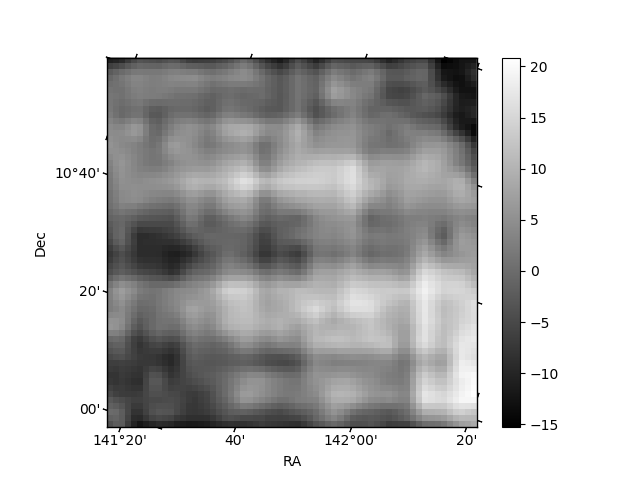
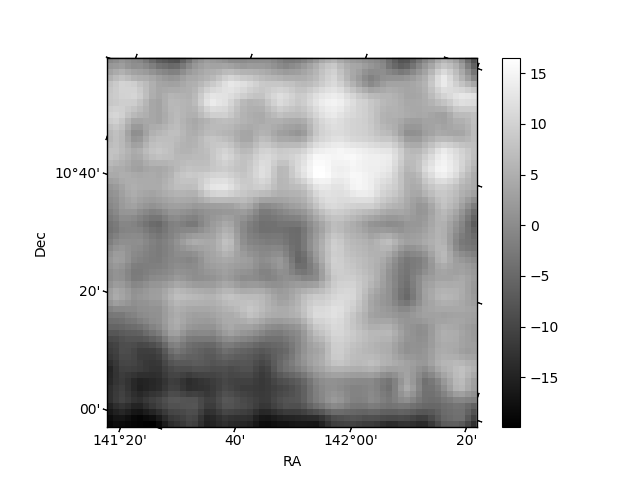
Histogram calculated using DETX and DETY for each event in the final _common_clean file
| Quadrant A | 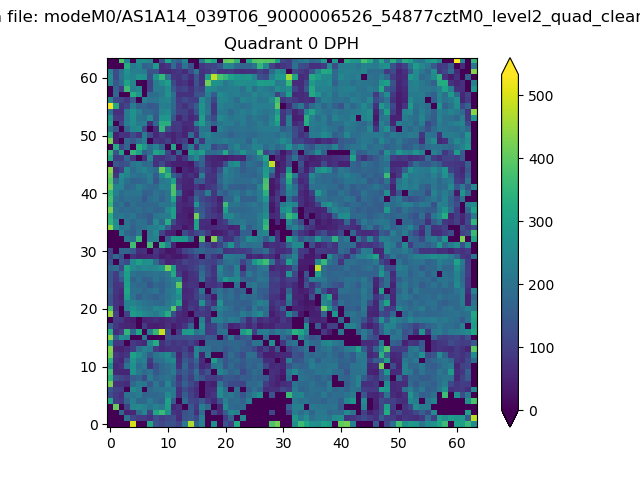 |
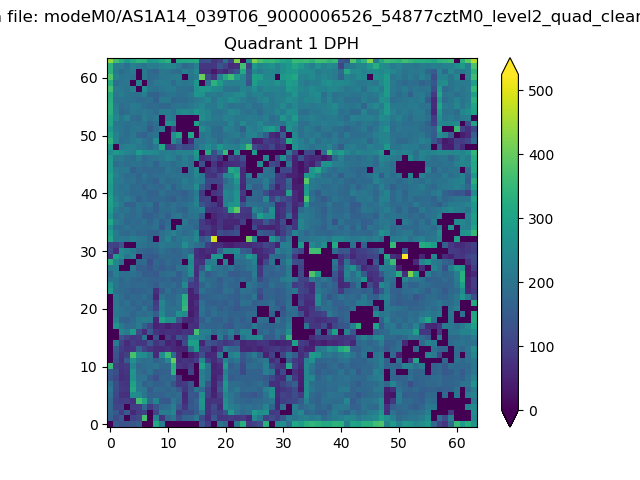 |
Quadrant B |
|---|---|---|---|
| Quadrant D | 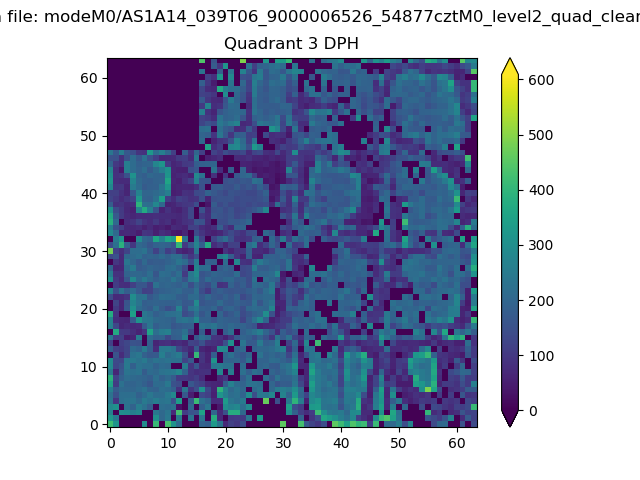 |
 |
Quadrant C |
| Plot type | Count rate plots | Images |
|---|---|---|
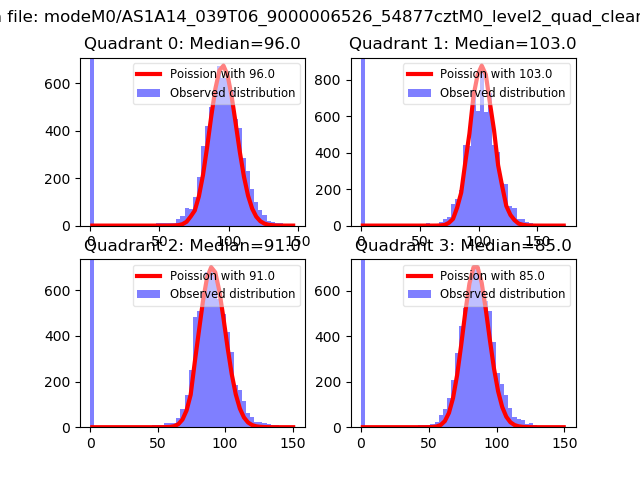
| Comparison with Poisson distribution Blue bars denote a histogram of data divided into 1 sec bins. Red curve is a Poisson curve with rate = median count rate of data. |
 |
 |
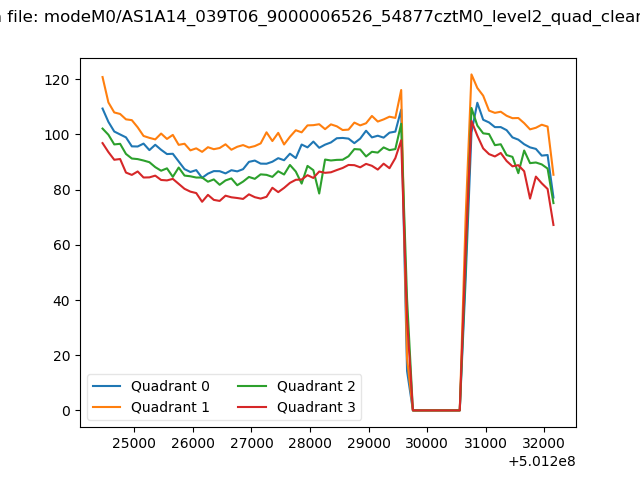
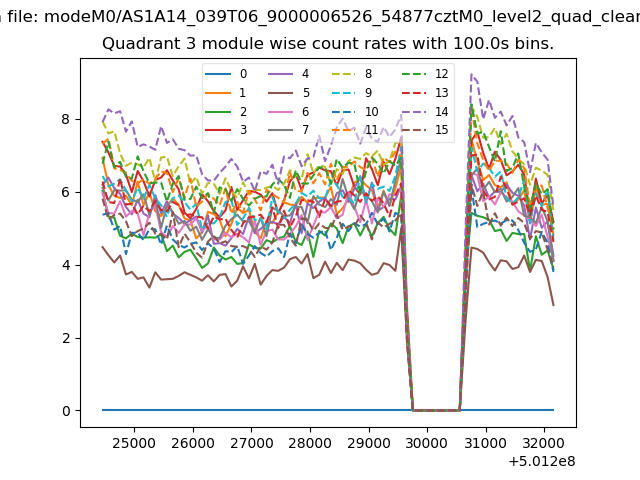
| Quadrant-wise count rates Data is divided into 100 sec bins |
 |
|
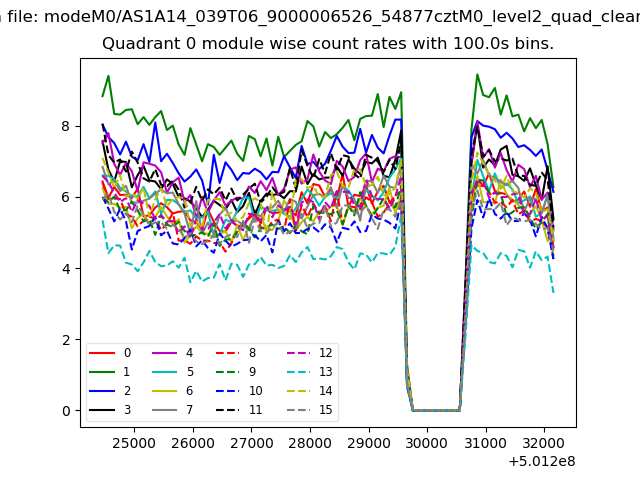
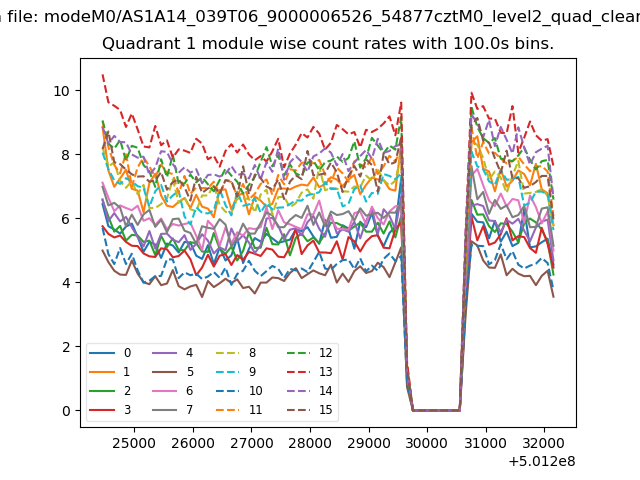
| Module-wise count rates for Quadrant A Data is divided into 100 sec bins |
 |
 |
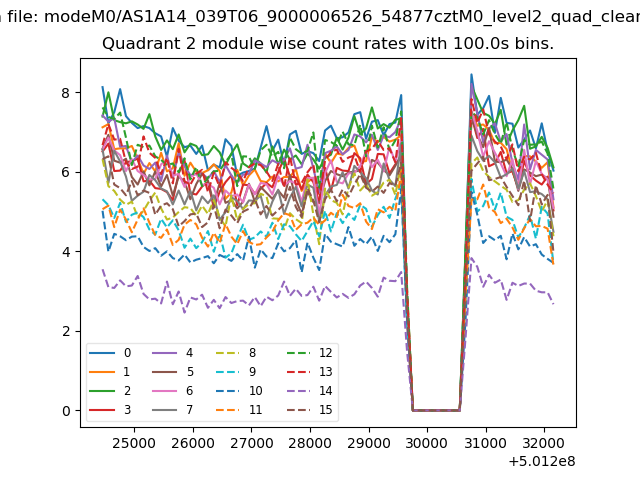
| Module-wise count rates for Quadrant B Data is divided into 100 sec bins |
 |
 |
| Module-wise count rates for Quadrant C Data is divided into 100 sec bins |
 |
 |
| Module-wise count rates for Quadrant D Data is divided into 100 sec bins |
 |
 |
| Parameter | Plot |
|---|---|
| CZT HV Monitor | 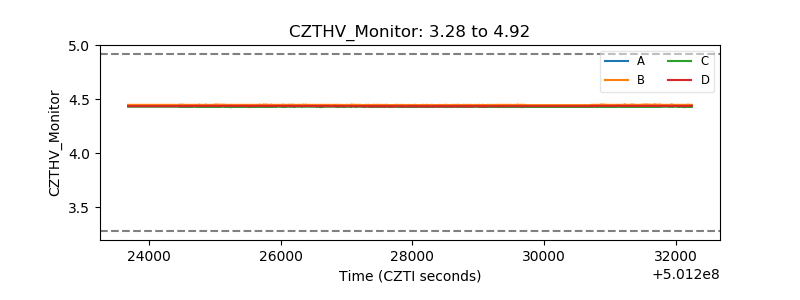 |
| D_VDD | 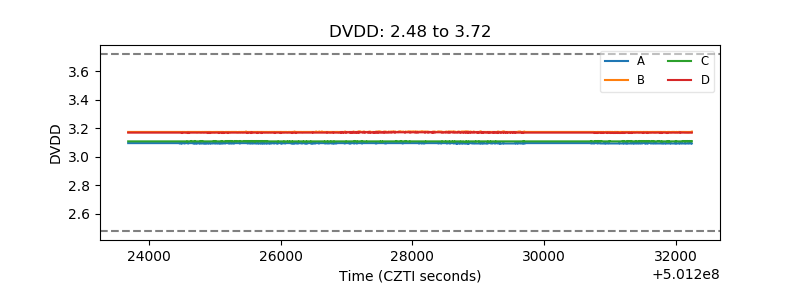 |
| Temperature 1 | 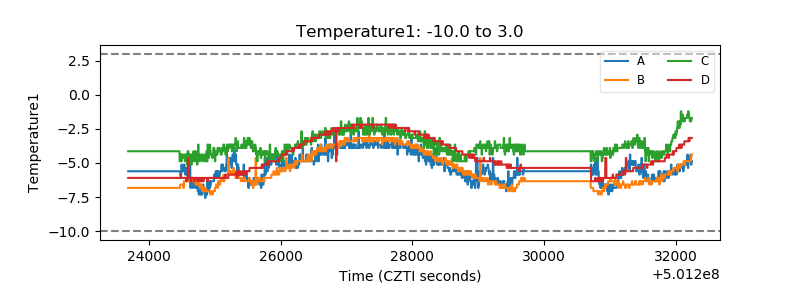 |
| Veto HV Monitor | 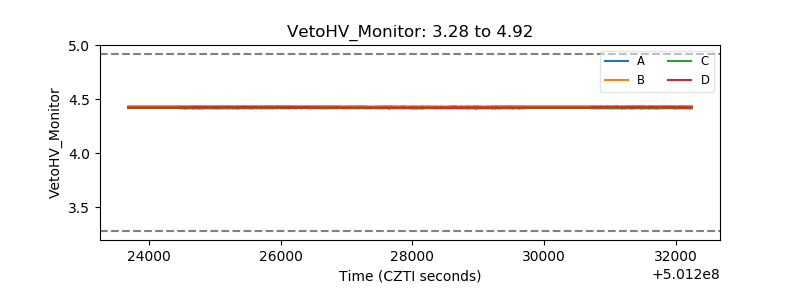 |
| Veto LLD | 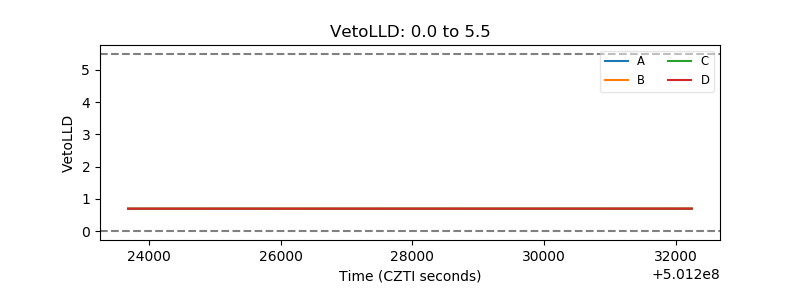 |
| Alpha Counter | 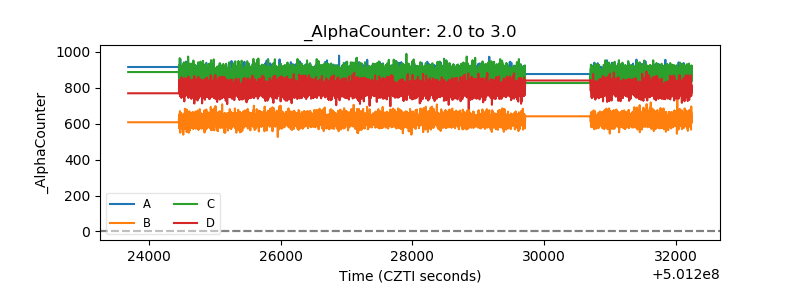 |
| _CPM_Rate | 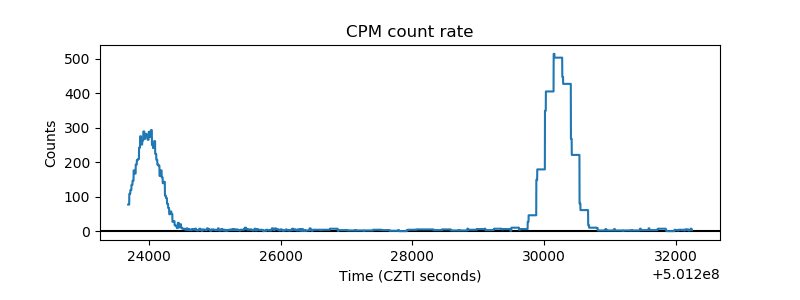 |
| CZT Counter | 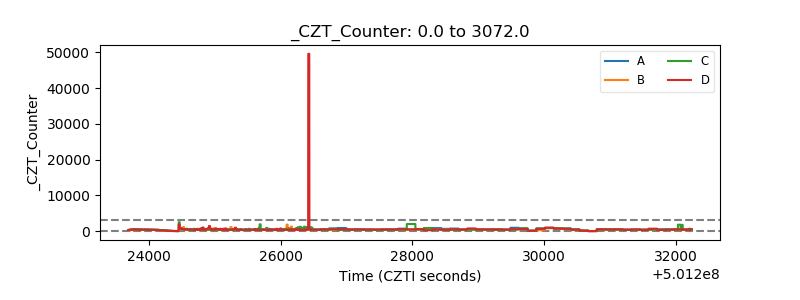 |
| +2.5 Volts monitor |  |
| +5 Volts monitor |  |
| _ROLL_ROT | 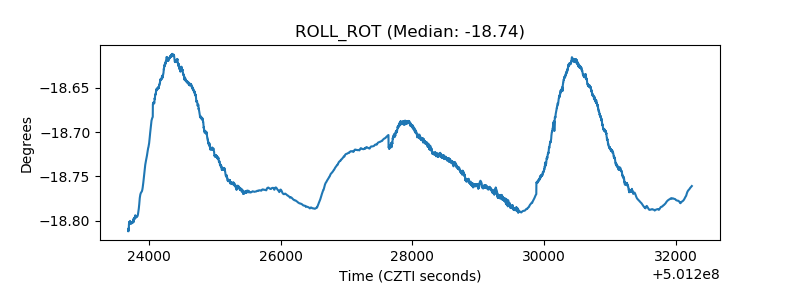 |
| _Roll_DEC | 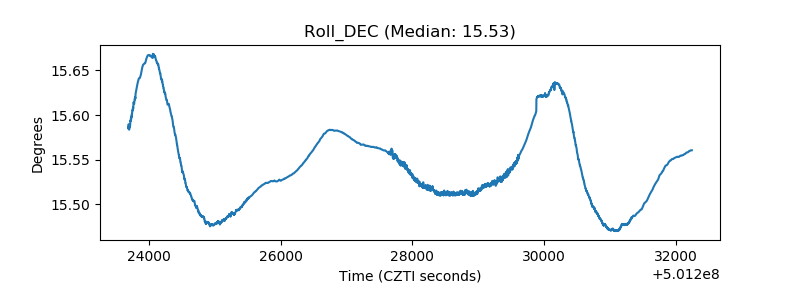 |
| _Roll_RA | 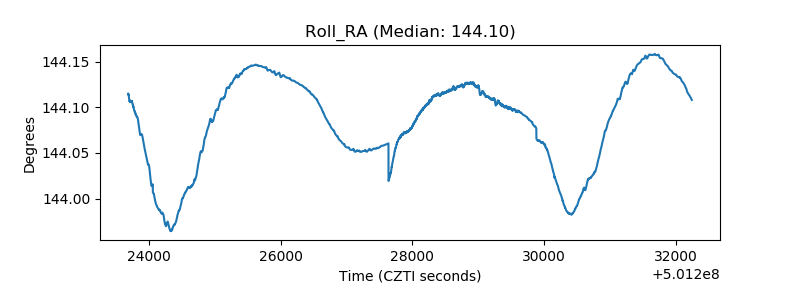 |
| Veto Counter | 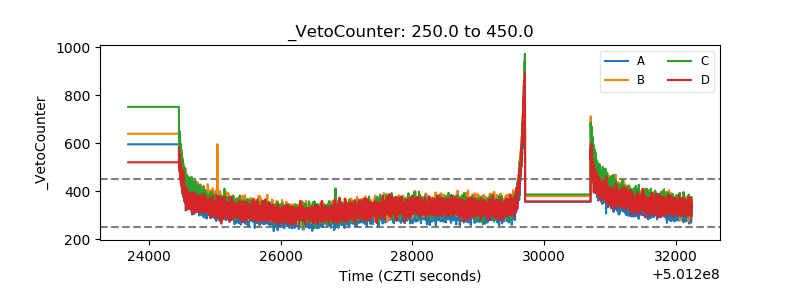 |