| Param | Original file | Final file |
|---|---|---|
| Filename | modeM0/AS1A14_039T06_9000006526_54878cztM0_level2.fits | modeM0/AS1A14_039T06_9000006526_54878cztM0_level2_quad_clean.evt |
| Size (bytes) | 240,981,120 | 56,088,000 |
| Size | 229.8 MB | 53.5 MB |
| Events in quadrant A | 2,041,138 | 367,407 |
| Events in quadrant B | 1,826,853 | 404,913 |
| Events in quadrant C | 2,392,247 | 332,119 |
| Events in quadrant D | 2,354,864 | 319,132 |
| Mode M9 | |||
|---|---|---|---|
| Quadrant | BADHDUFLAG | Total packets | Discarded packets |
| A | 0 | 11 | 0 |
| B | 0 | 11 | 0 |
| C | 0 | 11 | 0 |
| D | 0 | 11 | 0 |
| Mode M0 | |||
|---|---|---|---|
| Quadrant | BADHDUFLAG | Total packets | Discarded packets |
| A | 0 | 9925 | 1385 |
| B | 0 | 9457 | 1216 |
| C | 0 | 11899 | 2008 |
| D | 0 | 11651 | 2067 |
| Mode SS | |||
|---|---|---|---|
| Quadrant | BADHDUFLAG | Total packets | Discarded packets |
| A | 0 | 91 | 16 |
| B | 0 | 92 | 10 |
| C | 0 | 92 | 10 |
| D | 0 | 91 | 10 |
| Quadrant | Total seconds | Saturated seconds | Saturation percentage |
|---|---|---|---|
| A | 3903 | 39 | 0.999231% |
| B | 3944 | 33 | 0.836714% |
| C | 3866 | 227 | 5.871702% |
| D | 3840 | 104 | 2.708333% |
Noise dominated data is calculated using 1-second bins in cleaned event files. If a bin has >2000 counts, and if more than 50% of those come from <1% of pixels, then it is considered to be noise-dominated and hence unusable.
| Quadrant | # 1 sec bins | Bins with >0 counts | Bins with >2000 counts | High rate bins dominated by noise | Noise dominated (total time) | Noise dominated (detector-on time) | Marked lightcurve |
|---|---|---|---|---|---|---|---|
| A | 6457 | 4342 | 0 | 0 | 0.00% | 0.00% | 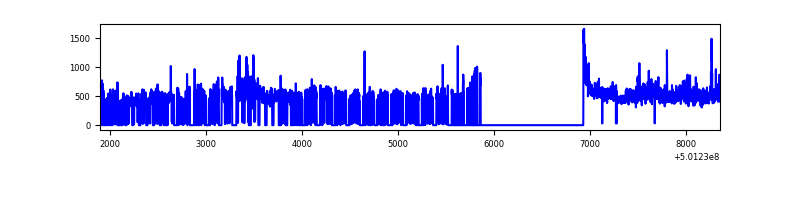 |
| B | 6460 | 4351 | 4 | 4 | 0.06% | 0.09% | 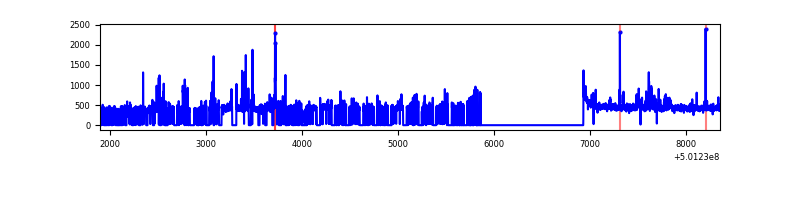 |
| C | 6459 | 4252 | 183 | 183 | 2.83% | 4.30% | 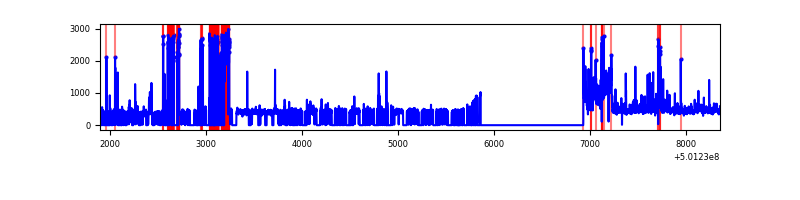 |
| D | 6456 | 4244 | 90 | 90 | 1.39% | 2.12% | 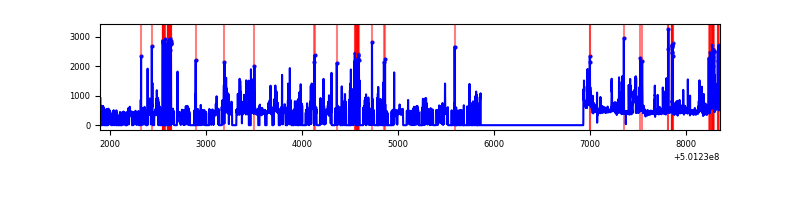 |
Top three noisy pixels from each quadrant. If the there are fewer than three noisy pixels in the level2.evt file, extra rows are filled as -1
| Pixel properties | Quadrant properties | ||||||
|---|---|---|---|---|---|---|---|
| Quadrant | DetID | PixID | Counts | Sigma | Mean | Median | Sigma |
| A | 3 | 14 | 358568 | 3377.64 | 425 | 415 | 106.0 |
| A | 13 | 248 | 10083 | 91.18 | 425 | 415 | 106.0 |
| A | 13 | 254 | 8540 | 76.62 | 425 | 415 | 106.0 |
| B | 5 | 185 | 70721 | 766.43 | 423 | 408 | 91.7 |
| B | 10 | 247 | 39753 | 428.87 | 423 | 408 | 91.7 |
| B | 10 | 245 | 20946 | 223.87 | 423 | 408 | 91.7 |
| C | 4 | 5 | 661638 | 5961.84 | 396 | 392 | 110.9 |
| C | 14 | 254 | 74580 | 668.88 | 396 | 392 | 110.9 |
| C | 15 | 178 | 38215 | 341.01 | 396 | 392 | 110.9 |
| D | 10 | 181 | 179258 | 1549.19 | 403 | 385 | 115.5 |
| D | 11 | 176 | 171595 | 1482.82 | 403 | 385 | 115.5 |
| D | 6 | 239 | 171186 | 1479.28 | 403 | 385 | 115.5 |
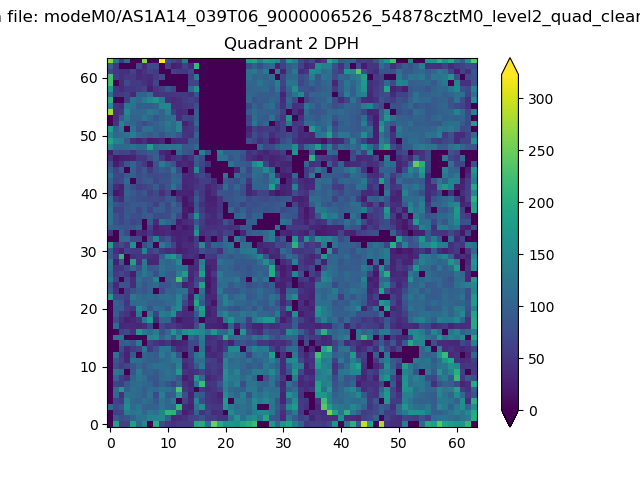
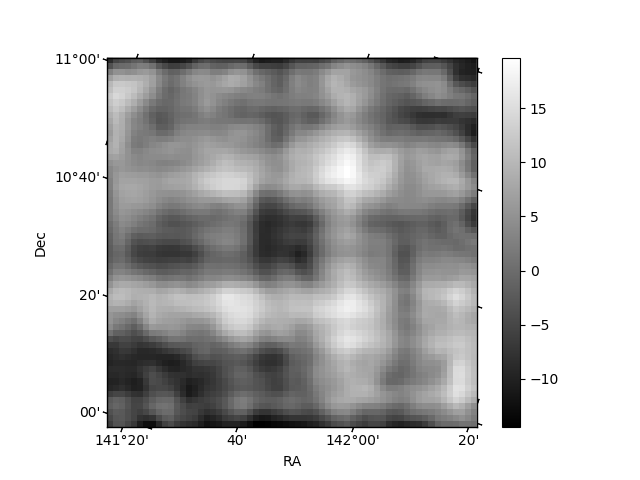
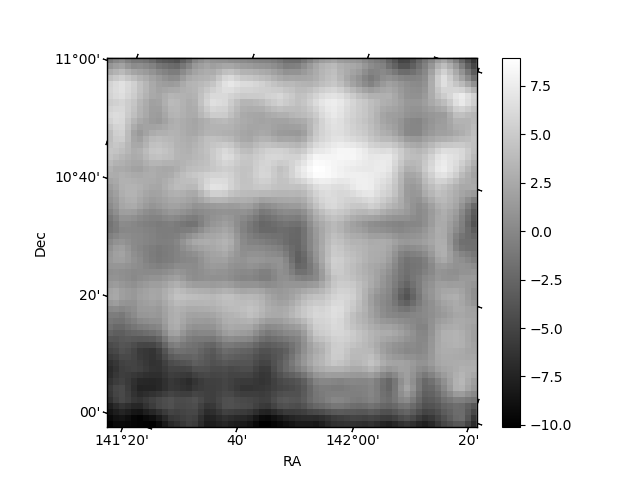
Histogram calculated using DETX and DETY for each event in the final _common_clean file
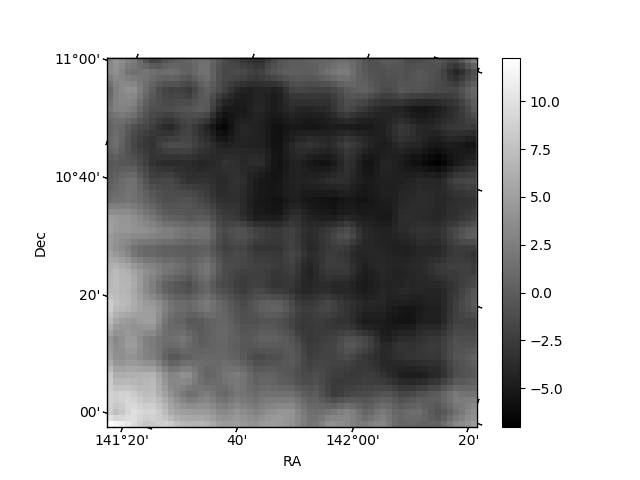
| Quadrant A | 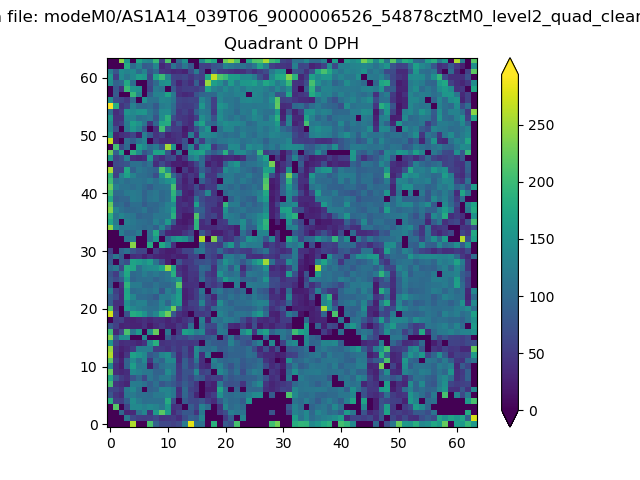 |
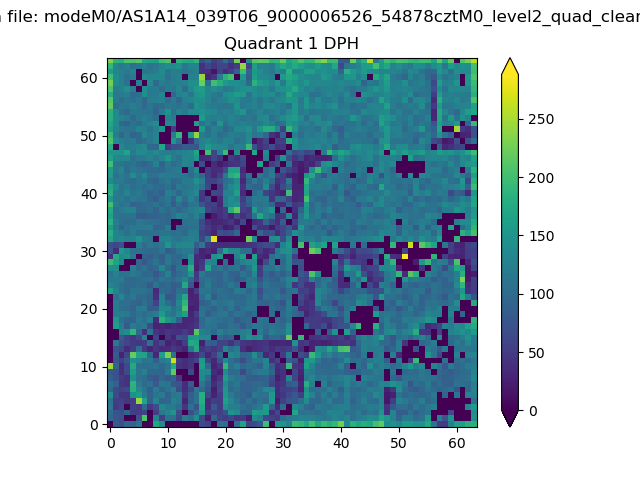 |
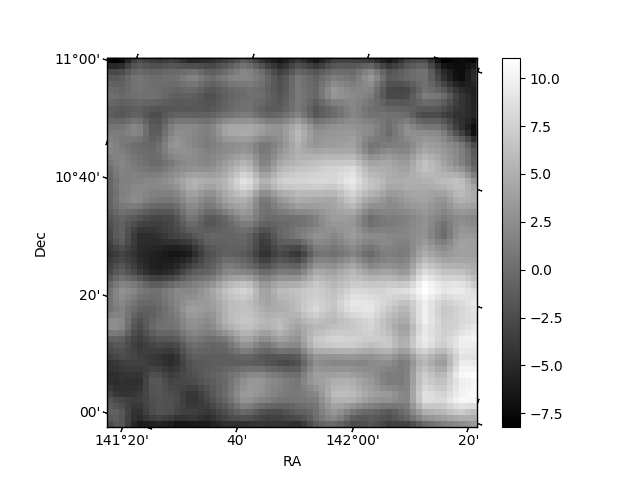
Quadrant B |
|---|---|---|---|
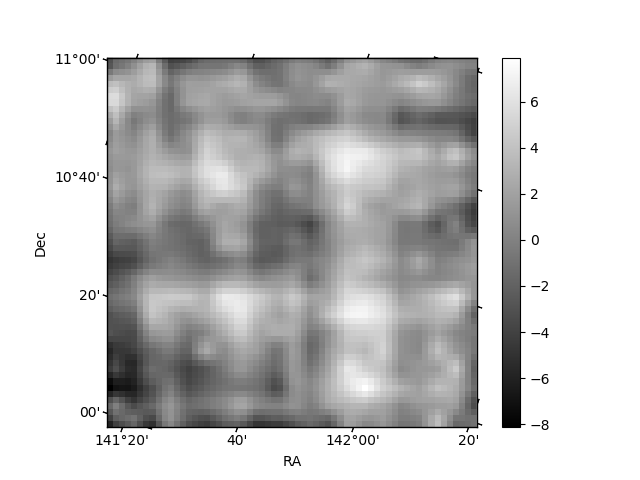
| Quadrant D | 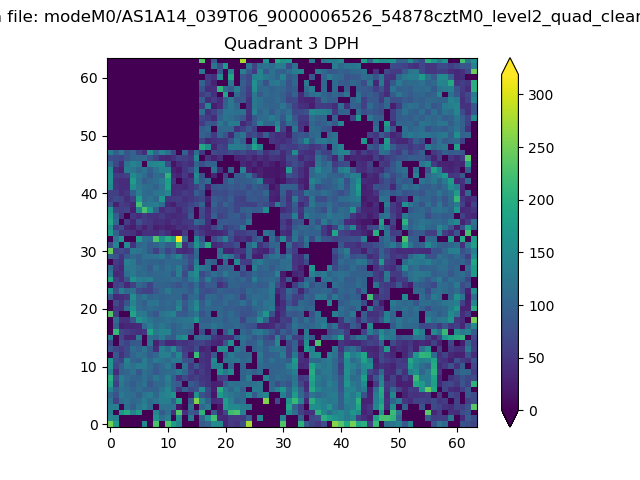 |
 |
Quadrant C |
| Plot type | Count rate plots | Images |
|---|---|---|
| Comparison with Poisson distribution Blue bars denote a histogram of data divided into 1 sec bins. Red curve is a Poisson curve with rate = median count rate of data. |
 |
 |
| Quadrant-wise count rates Data is divided into 100 sec bins |
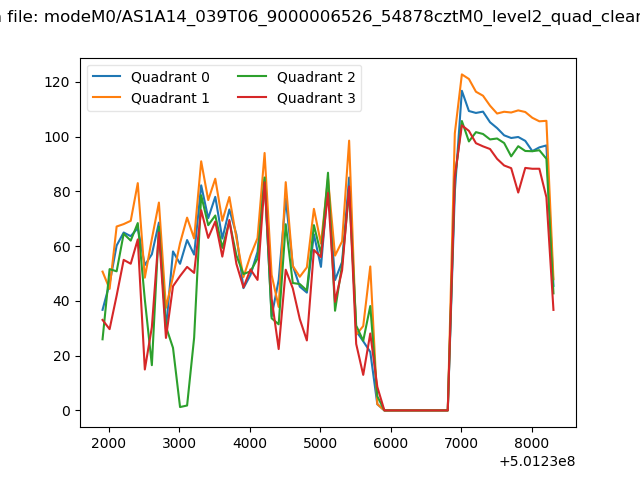 |
|
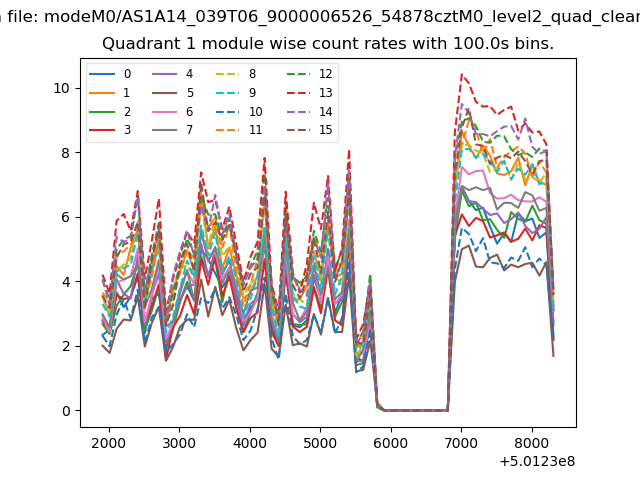
| Module-wise count rates for Quadrant A Data is divided into 100 sec bins |
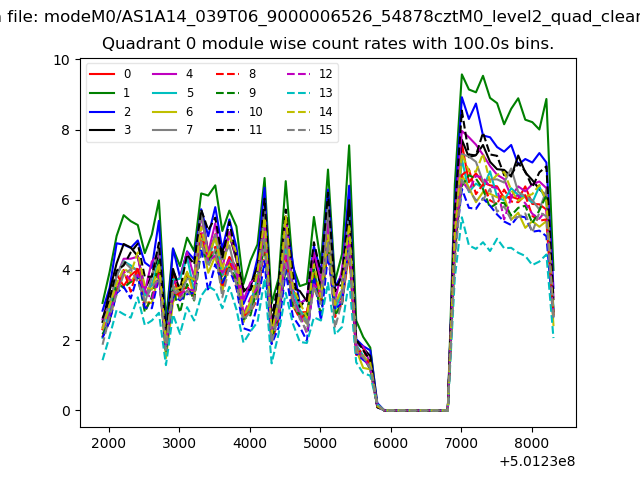 |
 |
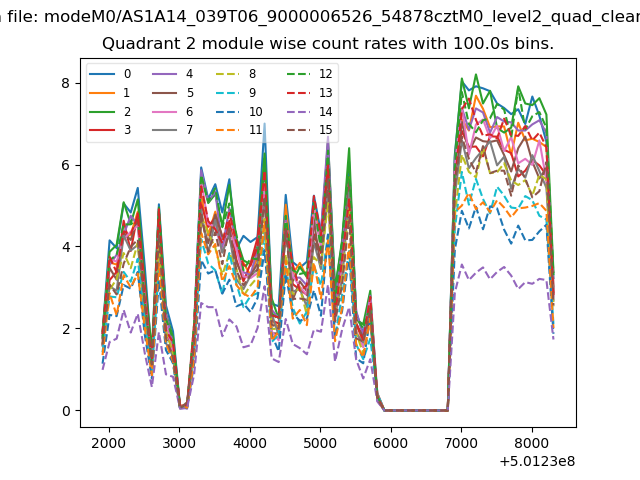
| Module-wise count rates for Quadrant B Data is divided into 100 sec bins |
 |
 |
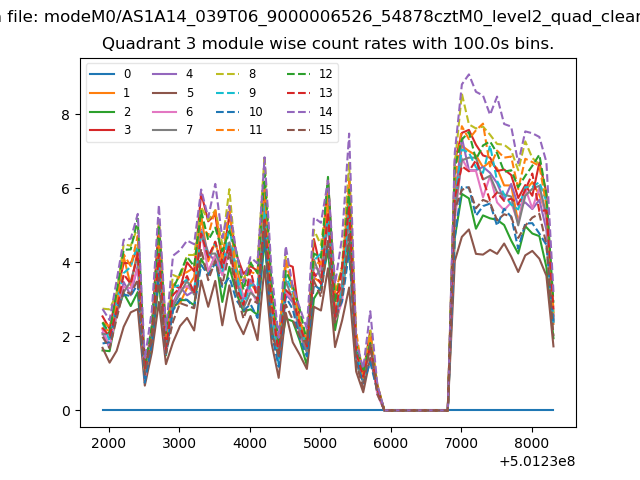
| Module-wise count rates for Quadrant C Data is divided into 100 sec bins |
 |
 |
| Module-wise count rates for Quadrant D Data is divided into 100 sec bins |
 |
 |
| Parameter | Plot |
|---|---|
| CZT HV Monitor | 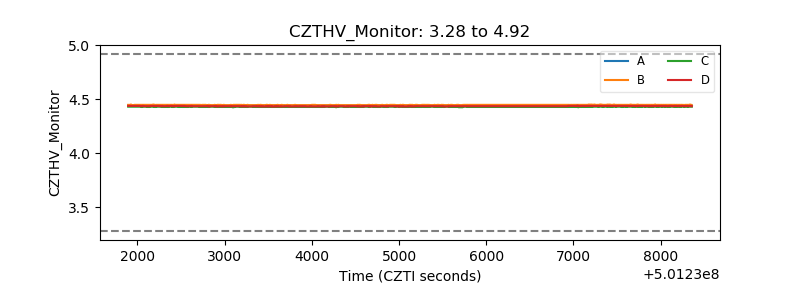 |
| D_VDD | 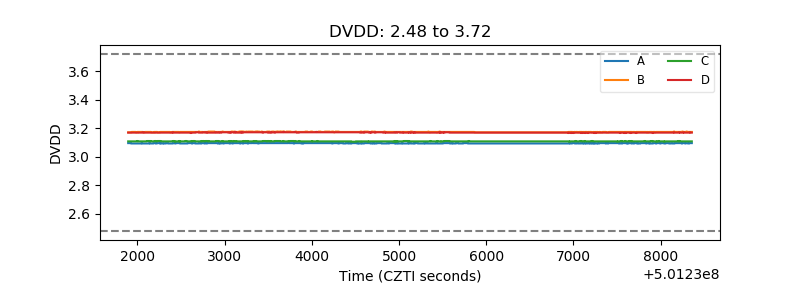 |
| Temperature 1 |  |
| Veto HV Monitor |  |
| Veto LLD |  |
| Alpha Counter | 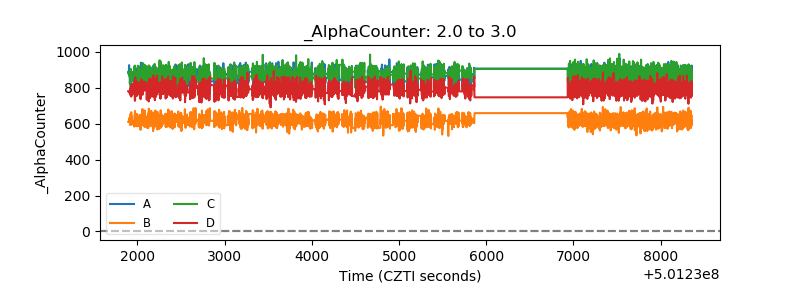 |
| _CPM_Rate | 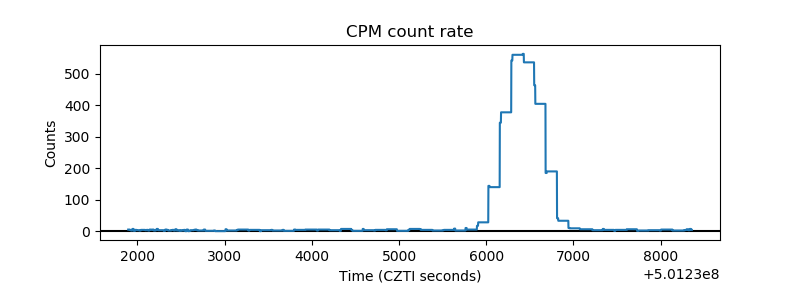 |
| CZT Counter | 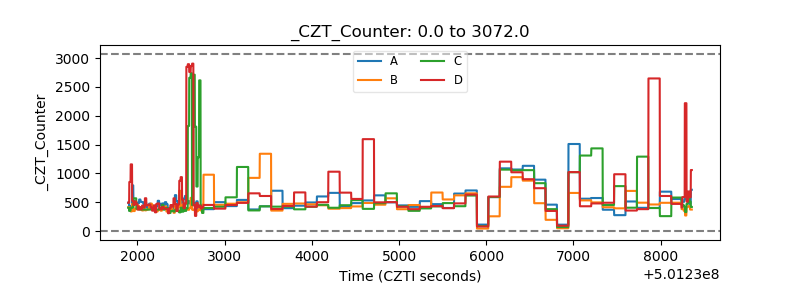 |
| +2.5 Volts monitor | 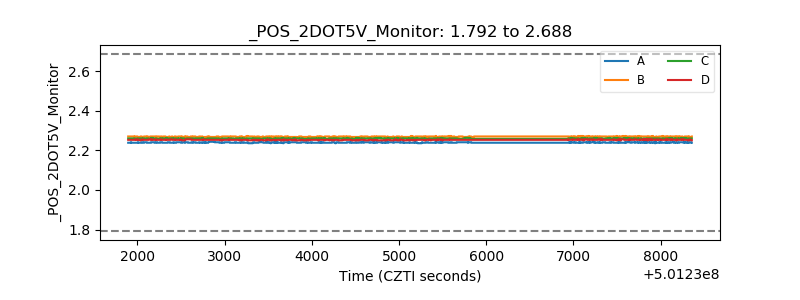 |
| +5 Volts monitor |  |
| _ROLL_ROT | 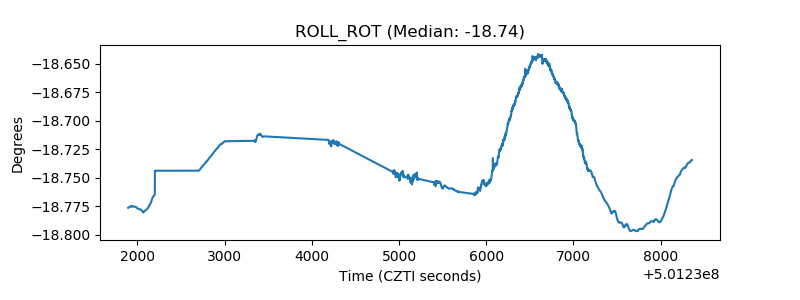 |
| _Roll_DEC | 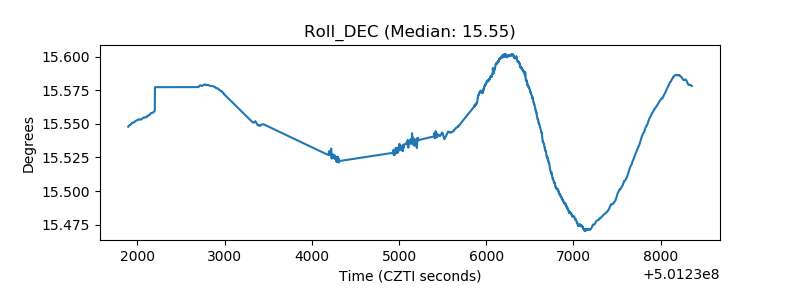 |
| _Roll_RA | 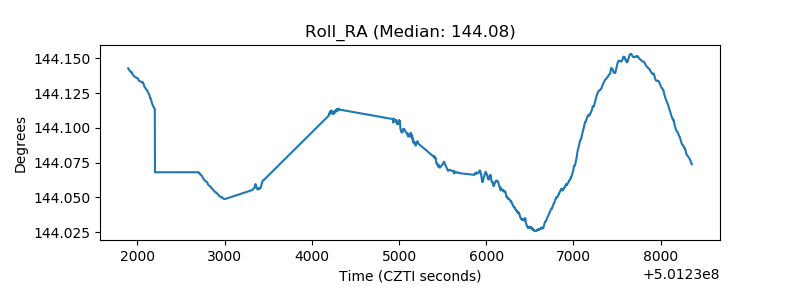 |
| Veto Counter | 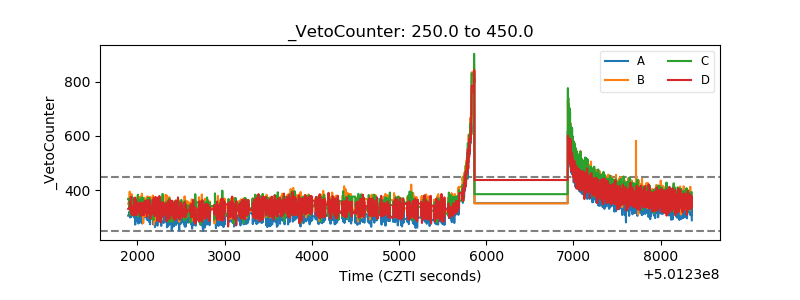 |