| Param | Original file | Final file |
|---|---|---|
| Filename | modeM0/AS1A14_039T06_9000006526_54879cztM0_level2.fits | modeM0/AS1A14_039T06_9000006526_54879cztM0_level2_quad_clean.evt |
| Size (bytes) | 496,684,800 | 89,121,600 |
| Size | 473.7 MB | 85.0 MB |
| Events in quadrant A | 3,640,866 | 610,237 |
| Events in quadrant B | 4,885,706 | 563,937 |
| Events in quadrant C | 4,324,957 | 568,247 |
| Events in quadrant D | 5,052,693 | 523,553 |
| Mode M9 | |||
|---|---|---|---|
| Quadrant | BADHDUFLAG | Total packets | Discarded packets |
| A | 0 | 11 | 0 |
| B | 0 | 11 | 0 |
| C | 0 | 11 | 0 |
| D | 0 | 11 | 0 |
| Mode M0 | |||
|---|---|---|---|
| Quadrant | BADHDUFLAG | Total packets | Discarded packets |
| A | 0 | 14950 | 2 |
| B | 0 | 18921 | 2 |
| C | 0 | 17033 | 1 |
| D | 0 | 19207 | 1 |
| Mode SS | |||
|---|---|---|---|
| Quadrant | BADHDUFLAG | Total packets | Discarded packets |
| A | 0 | 126 | 0 |
| B | 0 | 126 | 0 |
| C | 0 | 126 | 0 |
| D | 0 | 126 | 0 |
| Quadrant | Total seconds | Saturated seconds | Saturation percentage |
|---|---|---|---|
| A | 6197 | 118 | 1.904147% |
| B | 6197 | 968 | 15.620462% |
| C | 6198 | 284 | 4.582123% |
| D | 6198 | 434 | 7.002259% |
Noise dominated data is calculated using 1-second bins in cleaned event files. If a bin has >2000 counts, and if more than 50% of those come from <1% of pixels, then it is considered to be noise-dominated and hence unusable.
| Quadrant | # 1 sec bins | Bins with >0 counts | Bins with >2000 counts | High rate bins dominated by noise | Noise dominated (total time) | Noise dominated (detector-on time) | Marked lightcurve |
|---|---|---|---|---|---|---|---|
| A | 7293 | 6198 | 24 | 24 | 0.33% | 0.39% | 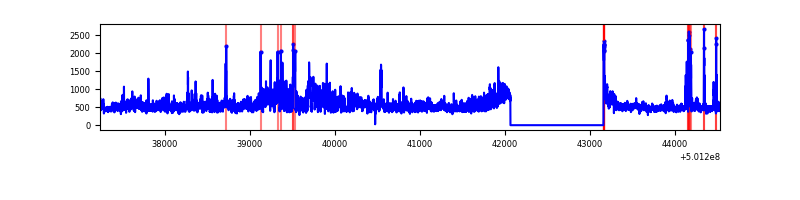 |
| B | 7292 | 6197 | 754 | 754 | 10.34% | 12.17% | 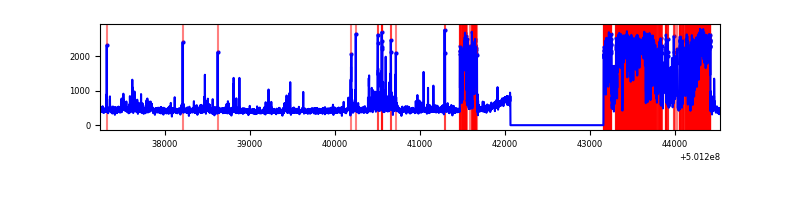 |
| C | 7293 | 6198 | 236 | 236 | 3.24% | 3.81% | 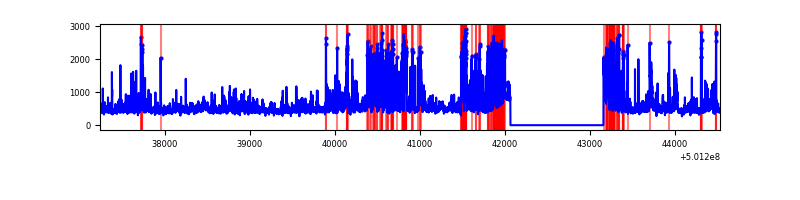 |
| D | 7293 | 6198 | 365 | 365 | 5.00% | 5.89% | 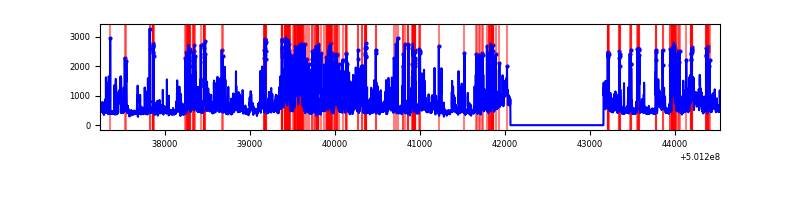 |
Top three noisy pixels from each quadrant. If the there are fewer than three noisy pixels in the level2.evt file, extra rows are filled as -1
| Pixel properties | Quadrant properties | ||||||
|---|---|---|---|---|---|---|---|
| Quadrant | DetID | PixID | Counts | Sigma | Mean | Median | Sigma |
| A | 3 | 14 | 857484 | 5031.88 | 688 | 670 | 170.3 |
| A | 0 | 8 | 82239 | 479.04 | 688 | 670 | 170.3 |
| A | 13 | 254 | 13417 | 74.86 | 688 | 670 | 170.3 |
| B | 5 | 185 | 2255707 | 16498.59 | 634 | 611 | 136.7 |
| B | 10 | 247 | 41360 | 298.13 | 634 | 611 | 136.7 |
| B | 10 | 245 | 28249 | 202.2 | 634 | 611 | 136.7 |
| C | 4 | 5 | 1307718 | 7186.25 | 659 | 654 | 181.9 |
| C | 12 | 252 | 188025 | 1030.17 | 659 | 654 | 181.9 |
| C | 14 | 254 | 141370 | 773.66 | 659 | 654 | 181.9 |
| D | 11 | 176 | 1127581 | 6020.05 | 655 | 625 | 187.2 |
| D | 6 | 239 | 320370 | 1708.03 | 655 | 625 | 187.2 |
| D | 10 | 181 | 185932 | 989.88 | 655 | 625 | 187.2 |
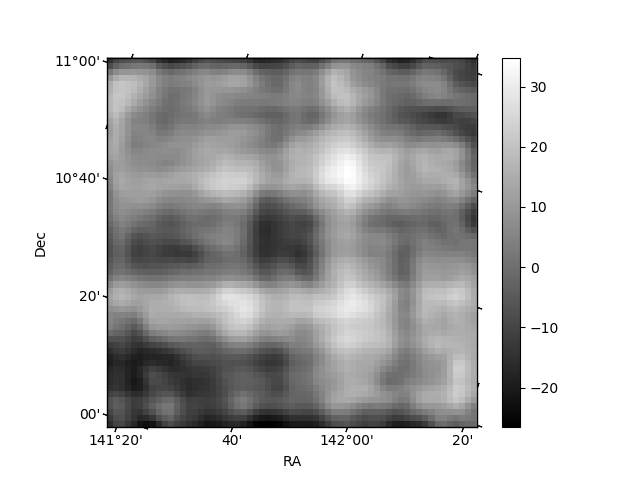
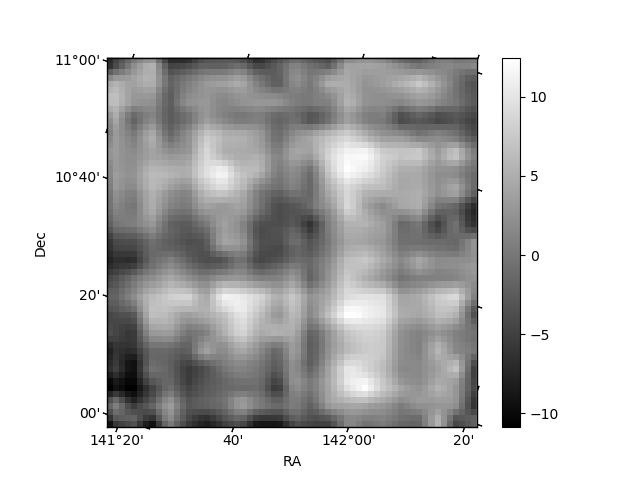
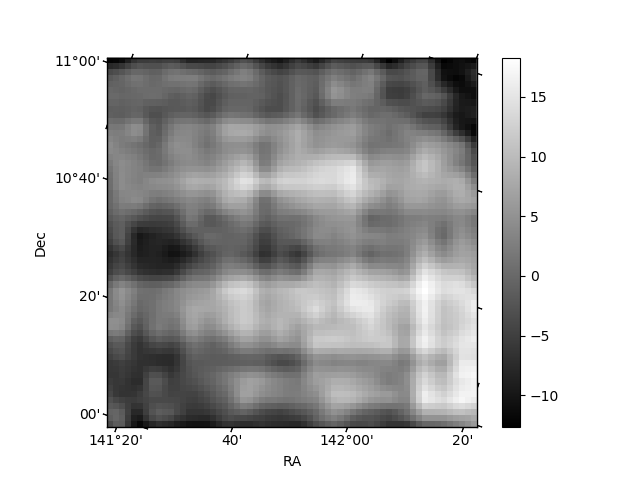
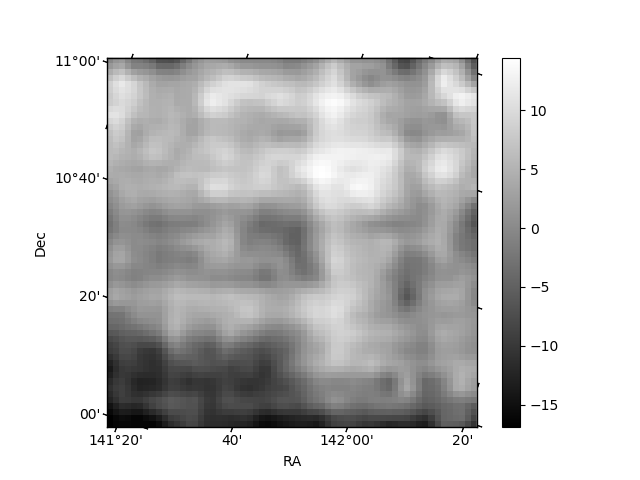
Histogram calculated using DETX and DETY for each event in the final _common_clean file
| Quadrant A | 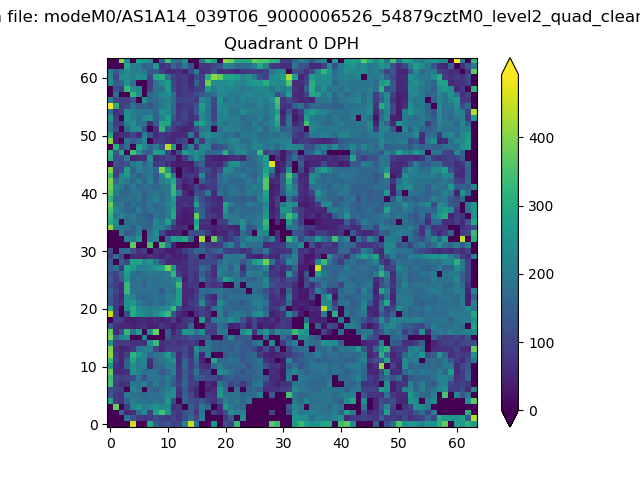 |
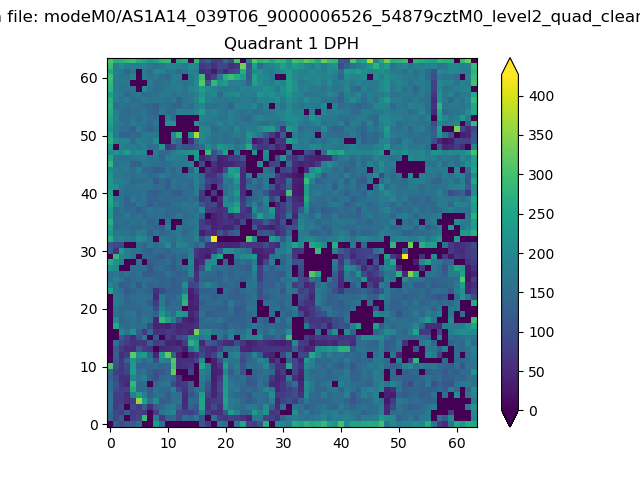 |
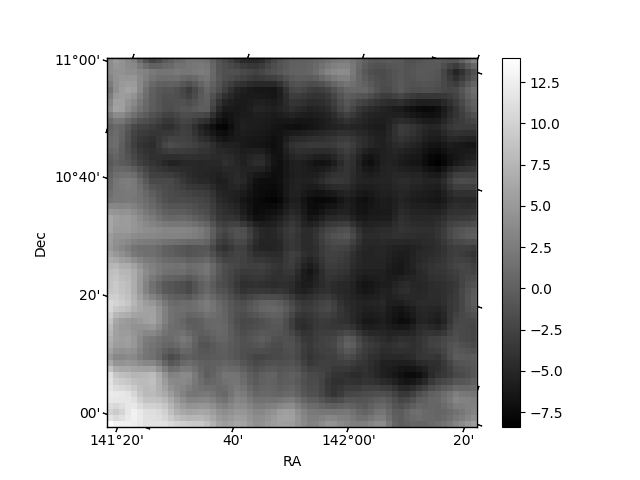
Quadrant B |
|---|---|---|---|
| Quadrant D | 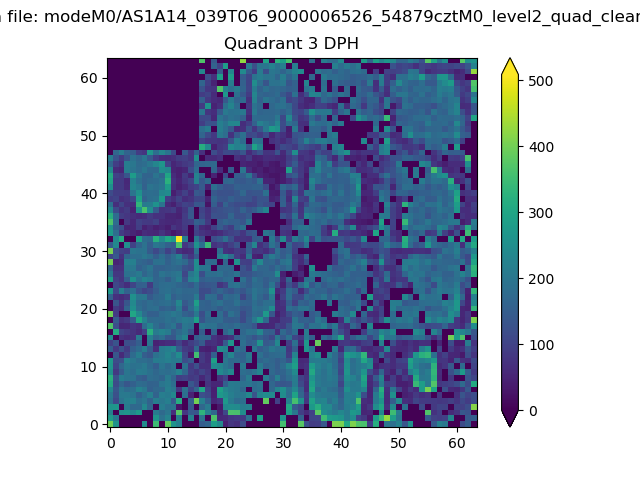 |
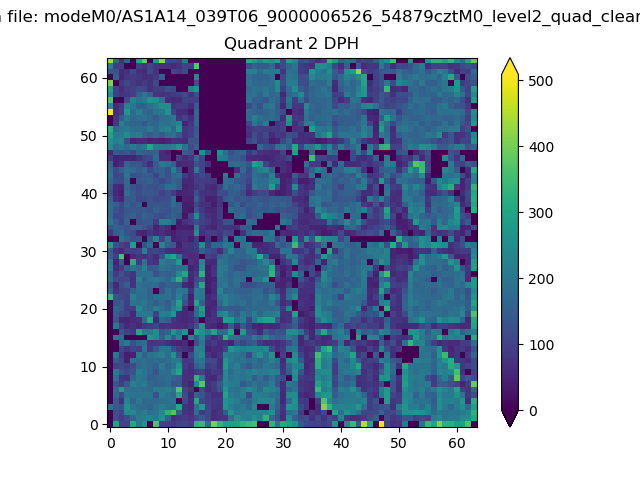 |
Quadrant C |
| Plot type | Count rate plots | Images |
|---|---|---|
| Comparison with Poisson distribution Blue bars denote a histogram of data divided into 1 sec bins. Red curve is a Poisson curve with rate = median count rate of data. |
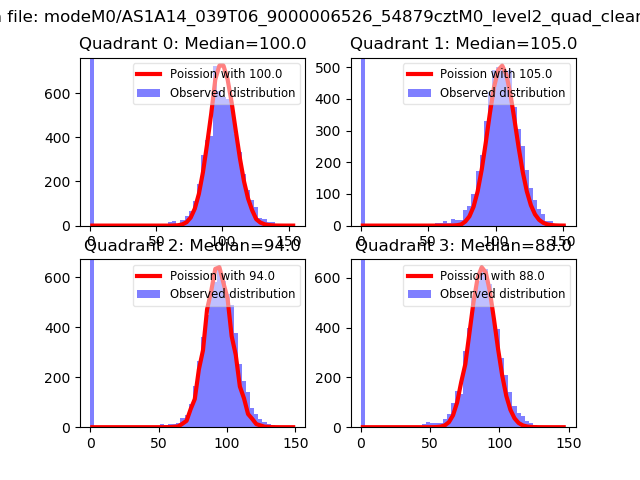 |
 |
| Quadrant-wise count rates Data is divided into 100 sec bins |
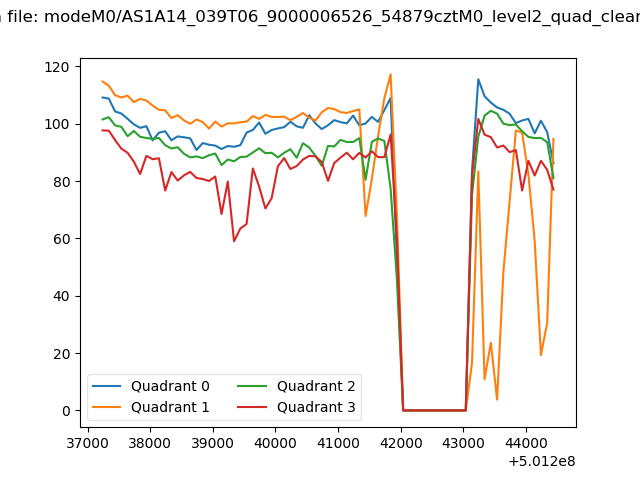 |
|
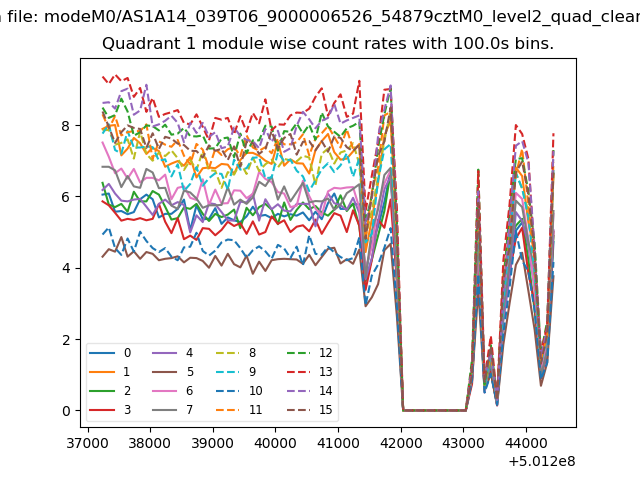
| Module-wise count rates for Quadrant A Data is divided into 100 sec bins |
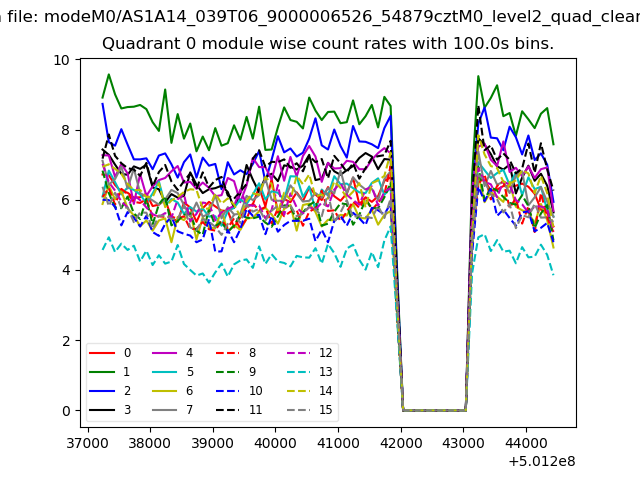 |
 |
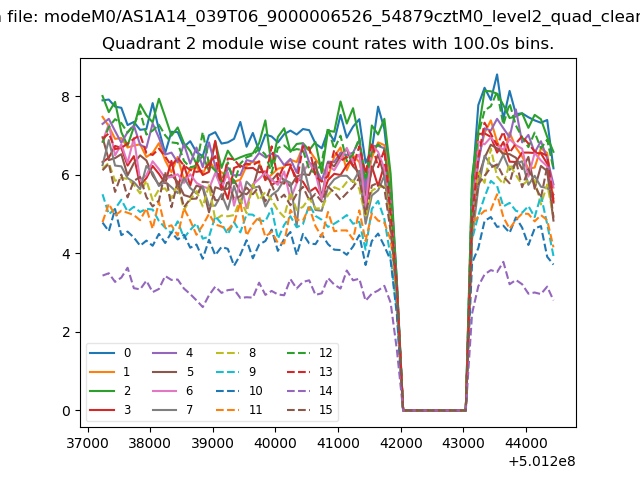
| Module-wise count rates for Quadrant B Data is divided into 100 sec bins |
 |
 |
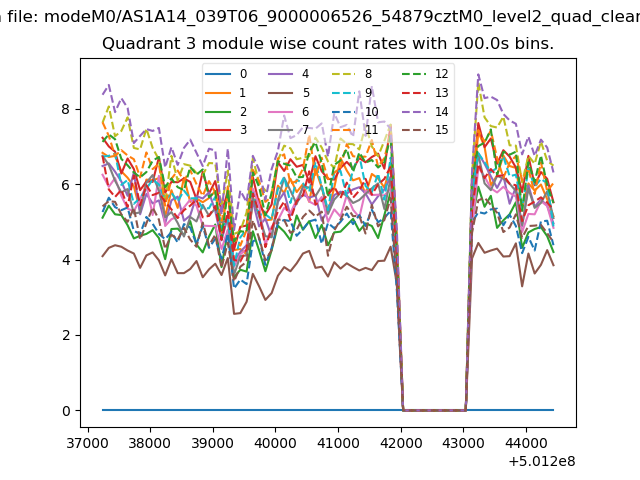
| Module-wise count rates for Quadrant C Data is divided into 100 sec bins |
 |
 |
| Module-wise count rates for Quadrant D Data is divided into 100 sec bins |
 |
 |
| Parameter | Plot |
|---|---|
| CZT HV Monitor |  |
| D_VDD | 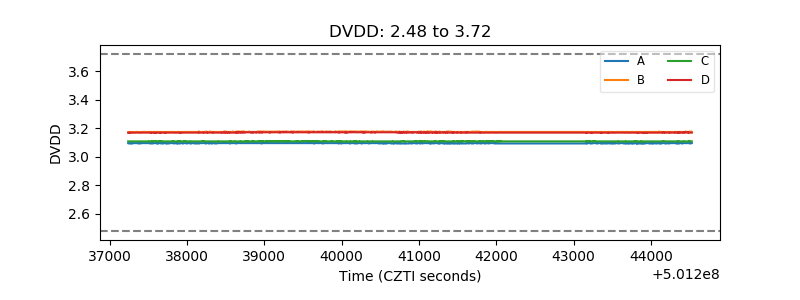 |
| Temperature 1 | 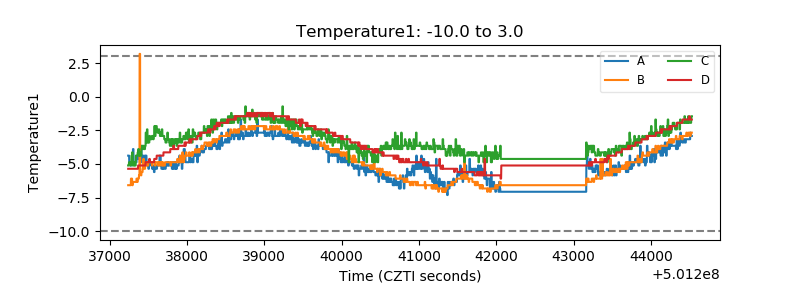 |
| Veto HV Monitor | 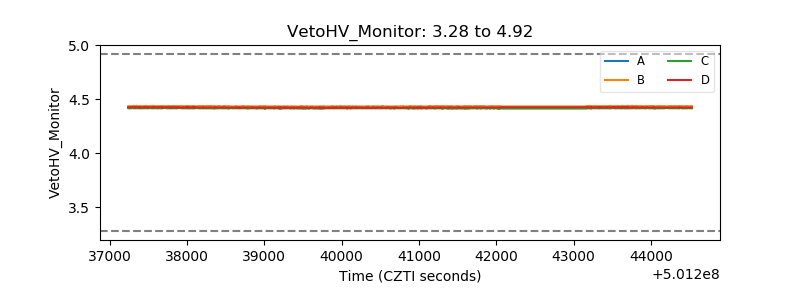 |
| Veto LLD | 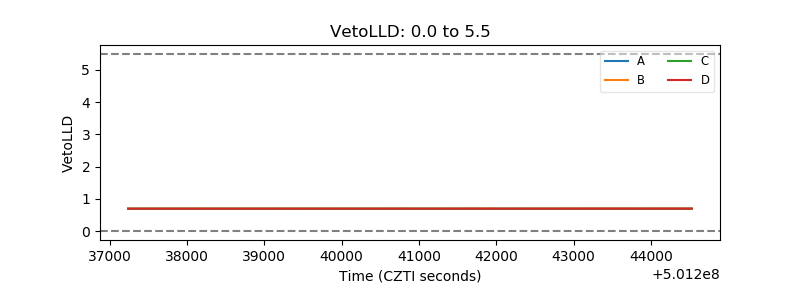 |
| Alpha Counter | 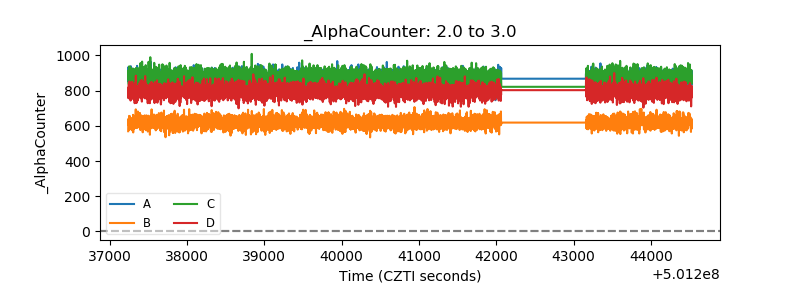 |
| _CPM_Rate | 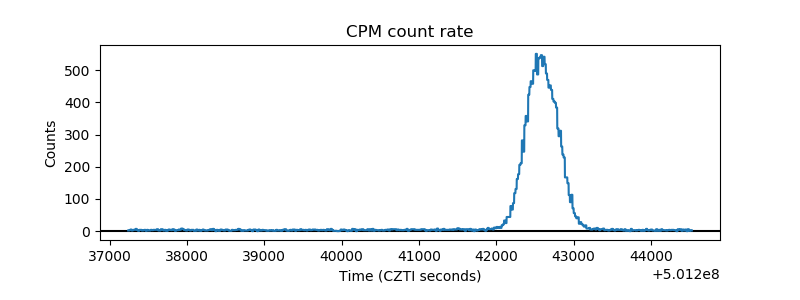 |
| CZT Counter | 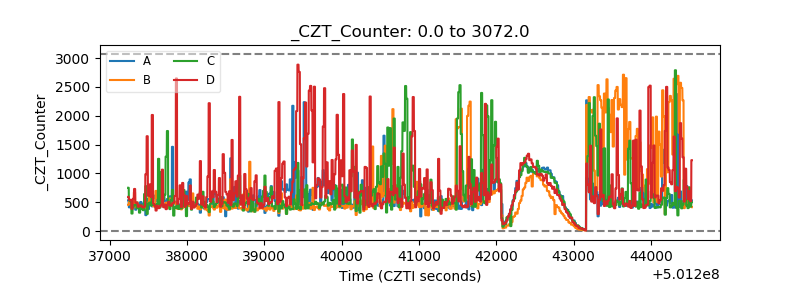 |
| +2.5 Volts monitor |  |
| +5 Volts monitor |  |
| _ROLL_ROT | 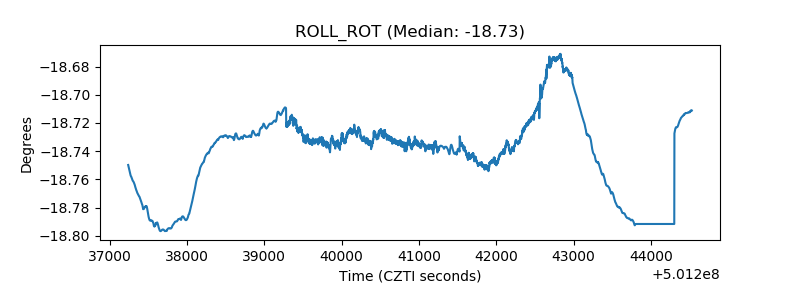 |
| _Roll_DEC | 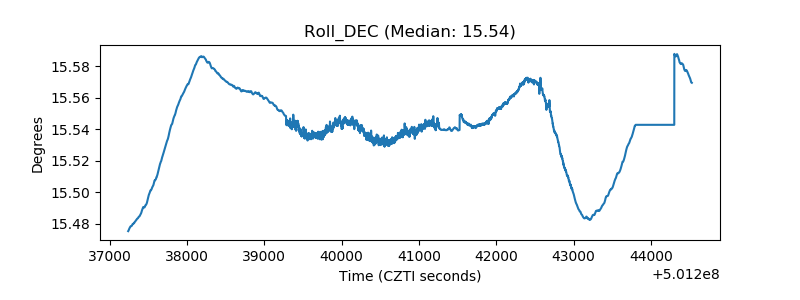 |
| _Roll_RA | 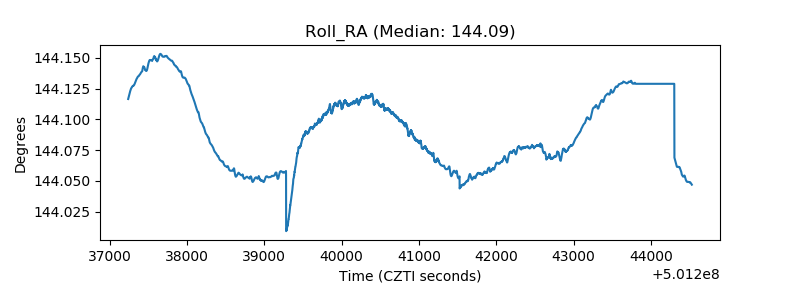 |
| Veto Counter | 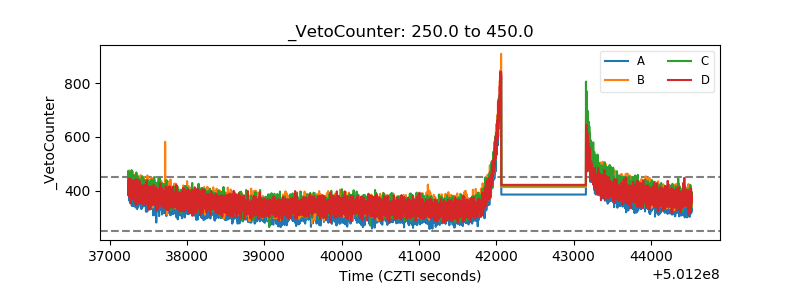 |