| Param | Original file | Final file |
|---|---|---|
| Filename | modeM0/AS1A14_039T06_9000006526_54880cztM0_level2.fits | modeM0/AS1A14_039T06_9000006526_54880cztM0_level2_quad_clean.evt |
| Size (bytes) | 460,281,600 | 91,601,280 |
| Size | 439.0 MB | 87.4 MB |
| Events in quadrant A | 3,115,318 | 619,089 |
| Events in quadrant B | 4,594,486 | 597,988 |
| Events in quadrant C | 4,057,985 | 581,791 |
| Events in quadrant D | 4,781,870 | 536,412 |
| Mode M9 | |||
|---|---|---|---|
| Quadrant | BADHDUFLAG | Total packets | Discarded packets |
| A | 0 | 11 | 0 |
| B | 0 | 11 | 0 |
| C | 0 | 11 | 0 |
| D | 0 | 11 | 0 |
| Mode M0 | |||
|---|---|---|---|
| Quadrant | BADHDUFLAG | Total packets | Discarded packets |
| A | 0 | 13427 | 1 |
| B | 0 | 18010 | 1 |
| C | 0 | 16406 | 1 |
| D | 0 | 18470 | 1 |
| Mode SS | |||
|---|---|---|---|
| Quadrant | BADHDUFLAG | Total packets | Discarded packets |
| A | 0 | 128 | 0 |
| B | 0 | 128 | 0 |
| C | 0 | 128 | 0 |
| D | 0 | 128 | 0 |
| Quadrant | Total seconds | Saturated seconds | Saturation percentage |
|---|---|---|---|
| A | 6282 | 81 | 1.289398% |
| B | 6282 | 732 | 11.652340% |
| C | 6282 | 189 | 3.008596% |
| D | 6282 | 340 | 5.412289% |
Noise dominated data is calculated using 1-second bins in cleaned event files. If a bin has >2000 counts, and if more than 50% of those come from <1% of pixels, then it is considered to be noise-dominated and hence unusable.
| Quadrant | # 1 sec bins | Bins with >0 counts | Bins with >2000 counts | High rate bins dominated by noise | Noise dominated (total time) | Noise dominated (detector-on time) | Marked lightcurve |
|---|---|---|---|---|---|---|---|
| A | 7397 | 6282 | 14 | 14 | 0.19% | 0.22% | 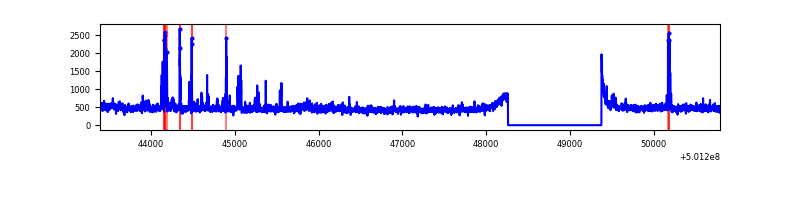 |
| B | 7397 | 6282 | 580 | 580 | 7.84% | 9.23% | 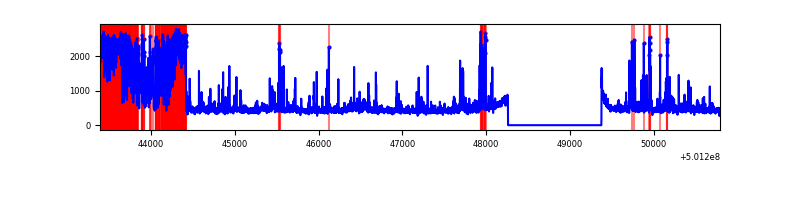 |
| C | 7397 | 6282 | 179 | 179 | 2.42% | 2.85% |  |
| D | 7397 | 6282 | 330 | 330 | 4.46% | 5.25% | 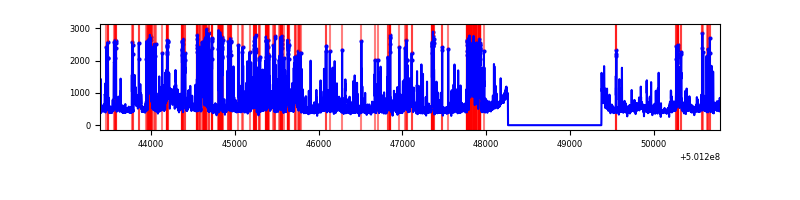 |
Top three noisy pixels from each quadrant. If the there are fewer than three noisy pixels in the level2.evt file, extra rows are filled as -1
| Pixel properties | Quadrant properties | ||||||
|---|---|---|---|---|---|---|---|
| Quadrant | DetID | PixID | Counts | Sigma | Mean | Median | Sigma |
| A | 3 | 14 | 170115 | 979.62 | 700 | 683 | 173.0 |
| A | 0 | 8 | 142726 | 821.26 | 700 | 683 | 173.0 |
| A | 7 | 173 | 28780 | 162.45 | 700 | 683 | 173.0 |
| B | 5 | 185 | 1801380 | 12752.12 | 655 | 634 | 141.2 |
| B | 2 | 249 | 67610 | 474.3 | 655 | 634 | 141.2 |
| B | 10 | 247 | 38478 | 268.0 | 655 | 634 | 141.2 |
| C | 12 | 252 | 956569 | 5147.76 | 672 | 667 | 185.7 |
| C | 4 | 5 | 251815 | 1352.49 | 672 | 667 | 185.7 |
| C | 14 | 254 | 139435 | 747.3 | 672 | 667 | 185.7 |
| D | 11 | 176 | 771753 | 4086.41 | 668 | 638 | 188.7 |
| D | 2 | 207 | 265775 | 1405.05 | 668 | 638 | 188.7 |
| D | 2 | 120 | 195755 | 1033.99 | 668 | 638 | 188.7 |
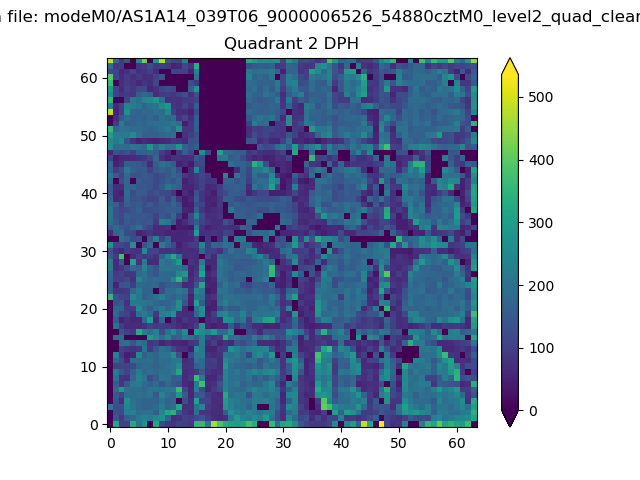
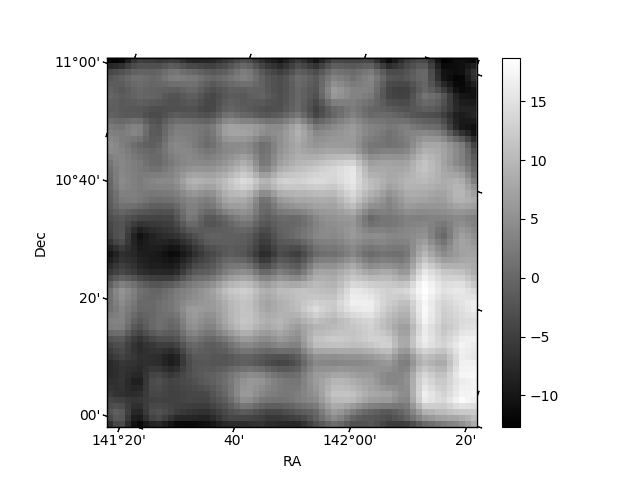
Histogram calculated using DETX and DETY for each event in the final _common_clean file
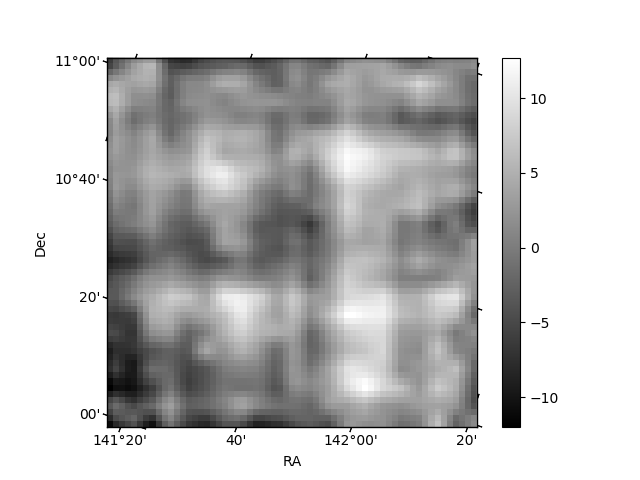
| Quadrant A | 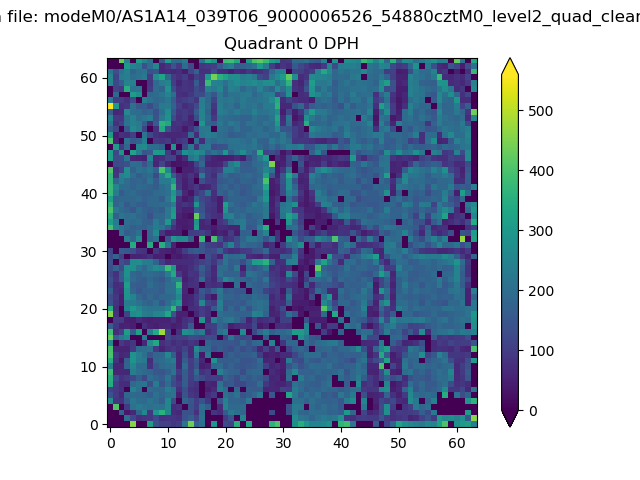 |
 |
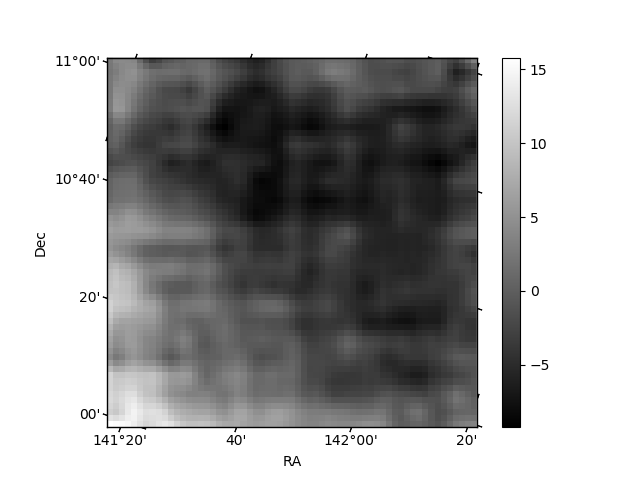
Quadrant B |
|---|---|---|---|
| Quadrant D |  |
 |
Quadrant C |
| Plot type | Count rate plots | Images |
|---|---|---|
| Comparison with Poisson distribution Blue bars denote a histogram of data divided into 1 sec bins. Red curve is a Poisson curve with rate = median count rate of data. |
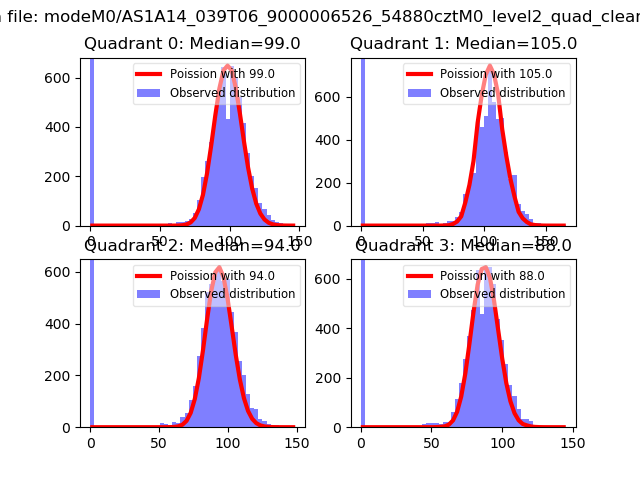 |
 |
| Quadrant-wise count rates Data is divided into 100 sec bins |
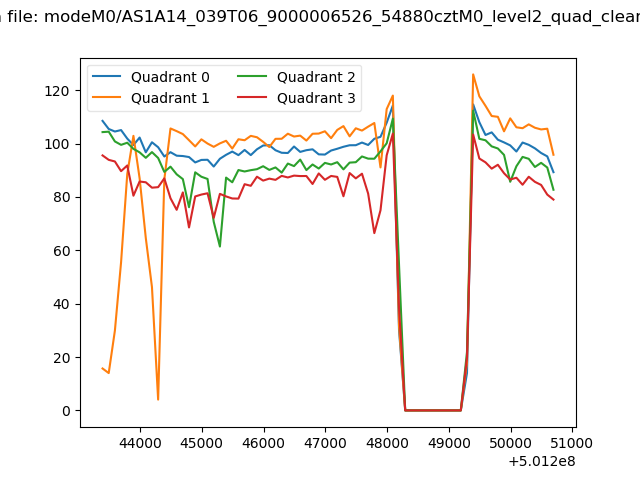 |
|
| Module-wise count rates for Quadrant A Data is divided into 100 sec bins |
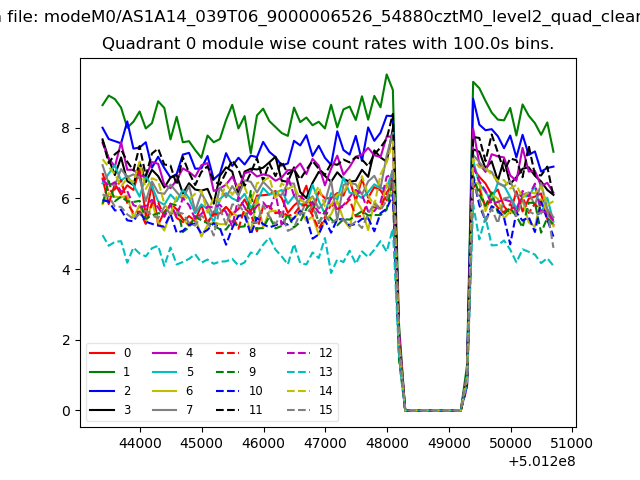 |
 |
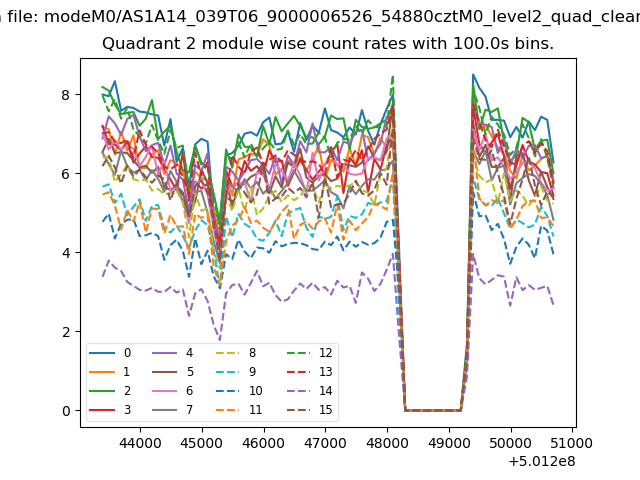
| Module-wise count rates for Quadrant B Data is divided into 100 sec bins |
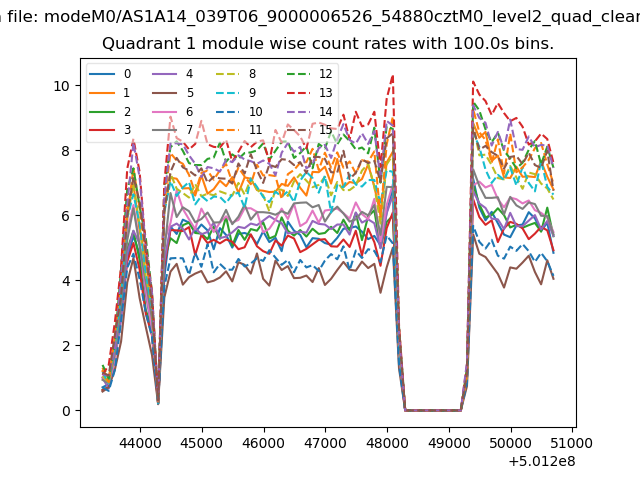 |
 |
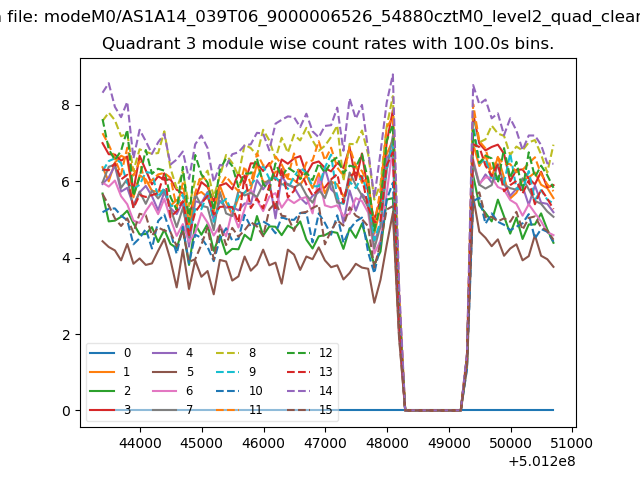
| Module-wise count rates for Quadrant C Data is divided into 100 sec bins |
 |
 |
| Module-wise count rates for Quadrant D Data is divided into 100 sec bins |
 |
 |
| Parameter | Plot |
|---|---|
| CZT HV Monitor | 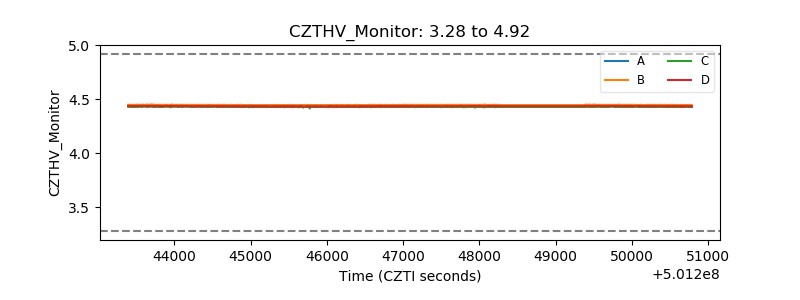 |
| D_VDD | 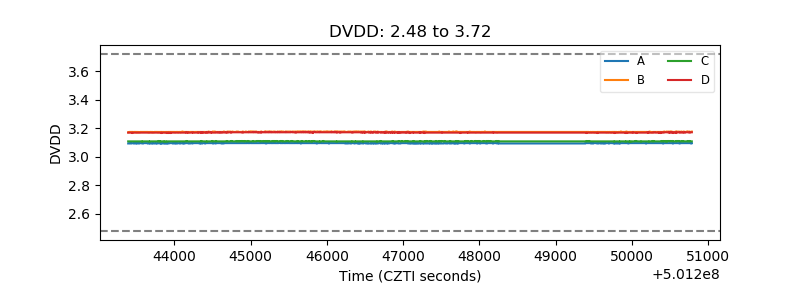 |
| Temperature 1 | 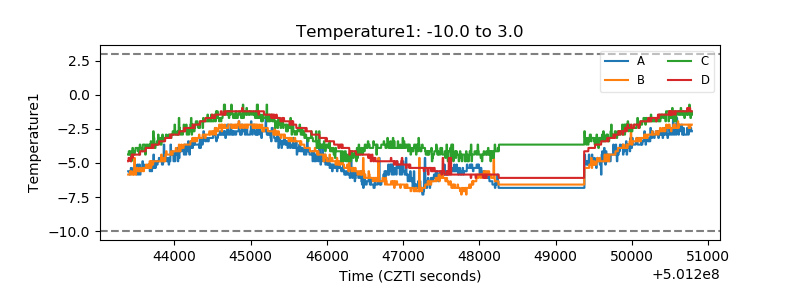 |
| Veto HV Monitor |  |
| Veto LLD | 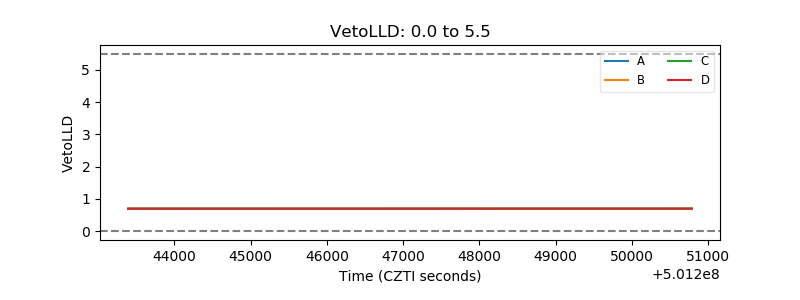 |
| Alpha Counter | 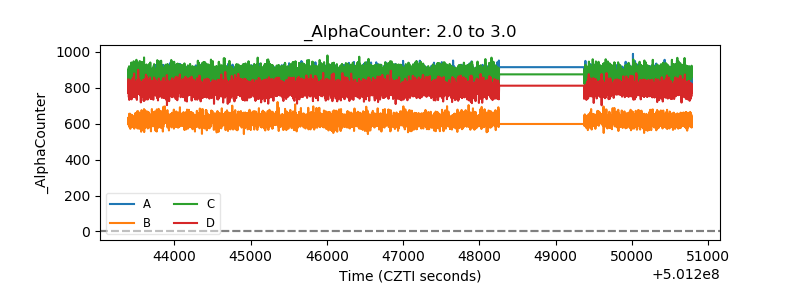 |
| _CPM_Rate | 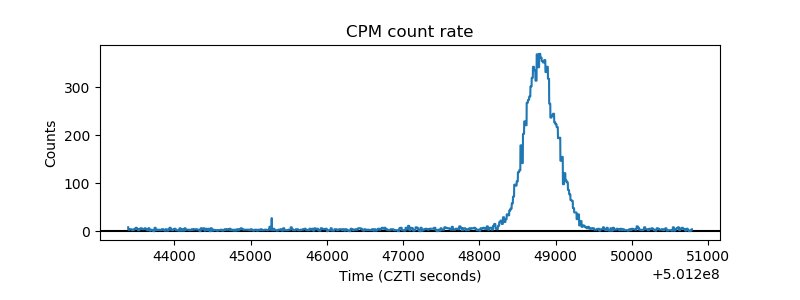 |
| CZT Counter | 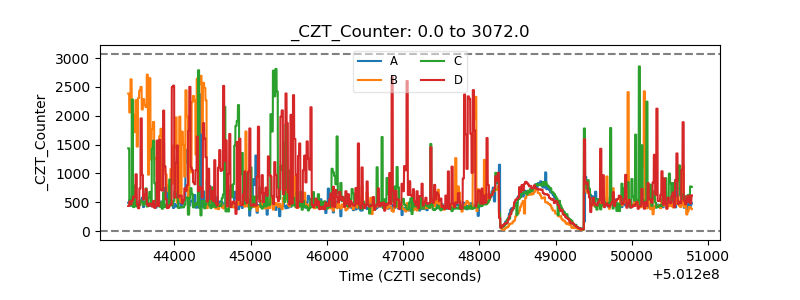 |
| +2.5 Volts monitor |  |
| +5 Volts monitor |  |
| _ROLL_ROT | 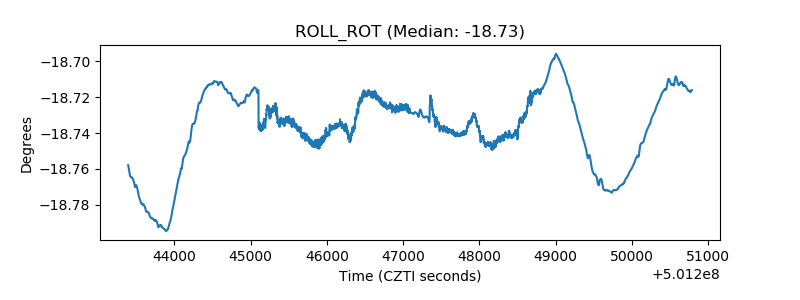 |
| _Roll_DEC | 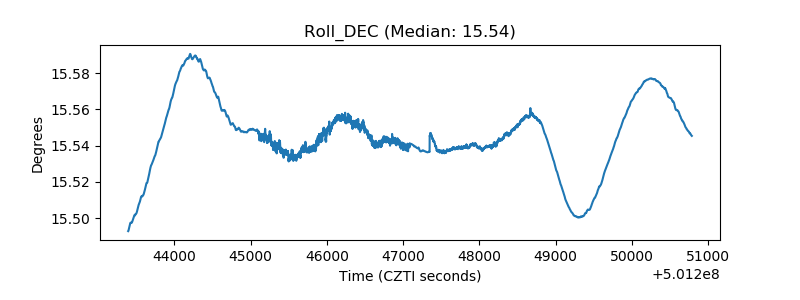 |
| _Roll_RA | 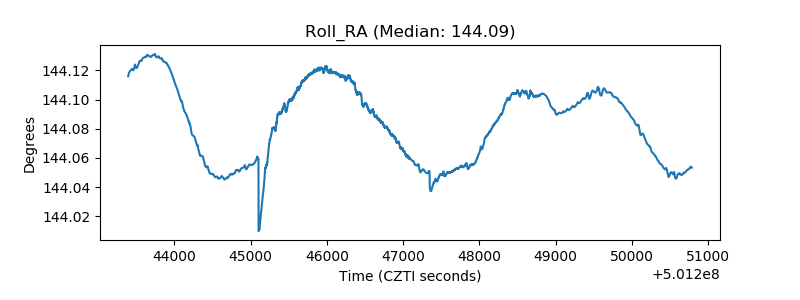 |
| Veto Counter | 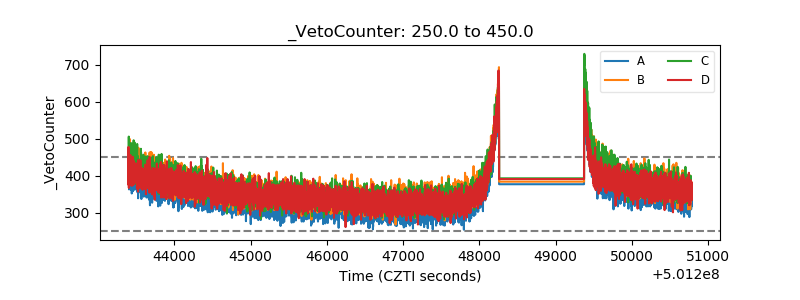 |